Home > Comparison > Technology > PLTR vs OKTA
The strategic rivalry between Palantir Technologies Inc. and Okta, Inc. shapes the future of the software infrastructure sector. Palantir operates as a data analytics powerhouse with government and enterprise focus, while Okta excels as a leading identity management provider for diverse organizations. This head-to-head reflects a contest between advanced data integration and secure access solutions. This analysis aims to identify which business model delivers the superior risk-adjusted return for a diversified portfolio in technology.
Table of contents
Companies Overview
Palantir Technologies Inc. and Okta, Inc. stand as pivotal players in the software infrastructure market, shaping enterprise digital frameworks worldwide.
Palantir Technologies Inc.: Data-Driven Intelligence Platform
Palantir dominates the intelligence and data analytics software sector by enabling governments and organizations to uncover hidden patterns in complex datasets. Its core revenue stems from deploying platforms like Gotham and Foundry, which facilitate operational decision-making and data integration. In 2026, Palantir emphasizes expanding its AI capabilities and cross-environment software deployment to enhance real-time responsiveness.
Okta, Inc.: Identity and Access Management Leader
Okta leads in identity security solutions, providing cloud-based authentication and access management for enterprises and public institutions. Its revenue engine revolves around the Okta Identity Cloud and Auth0 products, securing user access across multiple platforms. Strategic priorities for 2026 focus on enhancing adaptive security measures and expanding passwordless authentication to reduce friction and bolster protection.
Strategic Collision: Similarities & Divergences
Both companies operate within software infrastructure but diverge sharply in their philosophies; Palantir offers a closed, data-centric ecosystem while Okta champions an open, user-centric identity framework. Their primary battleground lies in securing enterprise digital operations—Palantir on data intelligence, Okta on access control. This contrast results in distinctly different risk profiles and growth trajectories for investors.
Income Statement Comparison
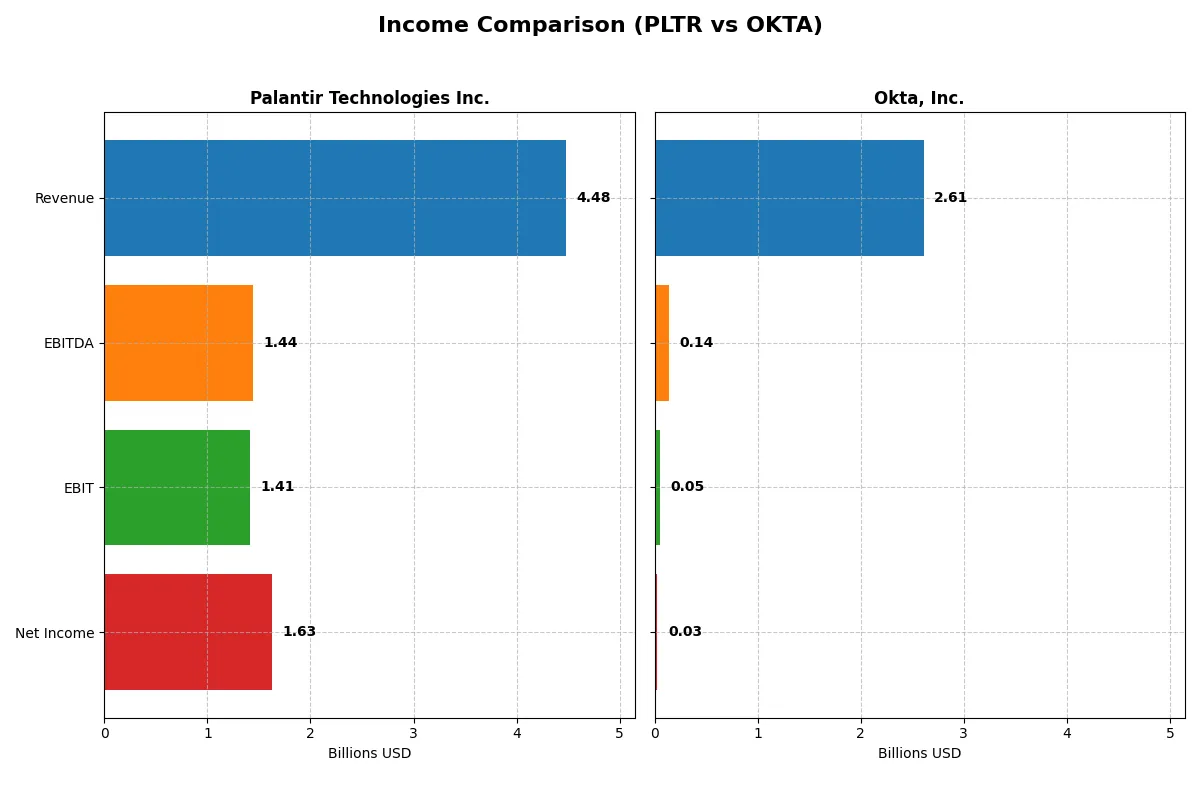
This table dissects the core profitability and scalability of both corporate engines to reveal who dominates the bottom line:
| Metric | Palantir Technologies Inc. (PLTR) | Okta, Inc. (OKTA) |
|---|---|---|
| Revenue | 4.48B | 2.61B |
| Cost of Revenue | 789M | 618M |
| Operating Expenses | 2.27B | 2.07B |
| Gross Profit | 3.69B | 1.99B |
| EBITDA | 1.44B | 139M |
| EBIT | 1.41B | 51M |
| Interest Expense | 0 | 5M |
| Net Income | 1.63B | 28M |
| EPS | 0.69 | 0.17 |
| Fiscal Year | 2025 | 2025 |
Income Statement Analysis: The Bottom-Line Duel
This income statement comparison reveals which company runs a more efficient and profitable business engine through recent years.
Palantir Technologies Inc. Analysis
Palantir’s revenue surged from 1.54B in 2021 to 4.48B in 2025, while net income jumped from a -520M loss to 1.63B profit. Gross margins remain robust above 82%, and net margins expanded impressively to 36%. The latest year highlights strong operating leverage and profitability momentum, signaling efficient capital allocation and cost control.
Okta, Inc. Analysis
Okta’s revenue grew steadily from 835M in 2021 to 2.61B in 2025, with net income recovering from an 815M loss to a modest 28M profit. Gross margins hold firm near 76%, but net margin is thin at about 1%. The company shows improvement but still struggles with high operating expenses, indicating a slower path to consistent profitability.
Margin Leadership vs. Revenue Growth Resilience
Palantir dominates on profitability with superior margins and a substantial net income leap, while Okta posts solid revenue growth but weak bottom-line results. Palantir’s efficiency and margin gains make it the fundamental winner. Investors seeking robust profit generation should favor Palantir’s profile over Okta’s ongoing margin challenges.
Financial Ratios Comparison
These vital ratios act as a diagnostic tool to expose the underlying fiscal health, valuation premiums, and capital efficiency of the companies compared below:
| Ratios | Palantir Technologies Inc. (PLTR) | Okta, Inc. (OKTA) |
|---|---|---|
| ROE | 22.0% | 0.44% |
| ROIC | 17.9% | -0.61% |
| P/E | 259.2 | 570.6 |
| P/B | 57.0 | 2.49 |
| Current Ratio | 7.11 | 1.35 |
| Quick Ratio | 7.11 | 1.35 |
| D/E | 0.03 | 0.15 |
| Debt-to-Assets | 2.58% | 10.1% |
| Interest Coverage | 0 | -14.8 |
| Asset Turnover | 0.50 | 0.28 |
| Fixed Asset Turnover | 17.8 | 22.3 |
| Payout ratio | 0 | 0 |
| Dividend yield | 0% | 0% |
| Fiscal Year | 2025 | 2025 |
Efficiency & Valuation Duel: The Vital Signs
Financial ratios serve as a company’s DNA, uncovering hidden risks and operational strengths that drive investment outcomes.
Palantir Technologies Inc.
Palantir exhibits strong profitability with a 22% ROE and a robust 36.31% net margin, signaling operational efficiency. However, its valuation appears stretched, trading at a high P/E of 259. Shareholders receive no dividends; instead, Palantir reinvests heavily in R&D, fueling growth and innovation.
Okta, Inc.
Okta shows weak profitability with a 0.44% ROE and a slim 1.07% net margin, reflecting operational challenges. Its valuation is expensive with a P/E of 571 but a more reasonable price-to-book of 2.49. Okta pays no dividends, focusing on reinvestment in R&D to support future scale.
Premium Valuation vs. Operational Safety
Palantir balances strong returns on equity against a demanding valuation, while Okta’s pricey shares mask weak profitability. Palantir offers a better blend of operational strength and shareholder reinvestment. Investors seeking growth with operational resilience may prefer Palantir’s profile over Okta’s riskier valuation.
Which one offers the Superior Shareholder Reward?
Palantir Technologies Inc. (PLTR) and Okta, Inc. (OKTA) both forgo dividends, focusing on reinvestment and buybacks. PLTR shows zero dividend yield and payout ratio, emphasizing free cash flow growth with a nearly 1.0 FCF to OCF ratio. OKTA also pays no dividends but has a more modest P/FCF of ~22 versus PLTR’s 200+. Okta’s buyback activity is less visible but implied by capital allocation given lower margins and higher leverage. PLTR’s robust operating margins (31.6% EBIT in 2025) and ultra-high current ratio (7.1) signal financial strength that can sustain aggressive buybacks. Okta’s thinner margins and higher debt ratios limit buyback scope. I see PLTR’s reinvestment and potential buybacks as the more sustainable path for total shareholder return in 2026.
Comparative Score Analysis: The Strategic Profile
The radar chart reveals the fundamental DNA and trade-offs of Palantir Technologies Inc. and Okta, Inc., highlighting their financial strengths and valuation challenges:
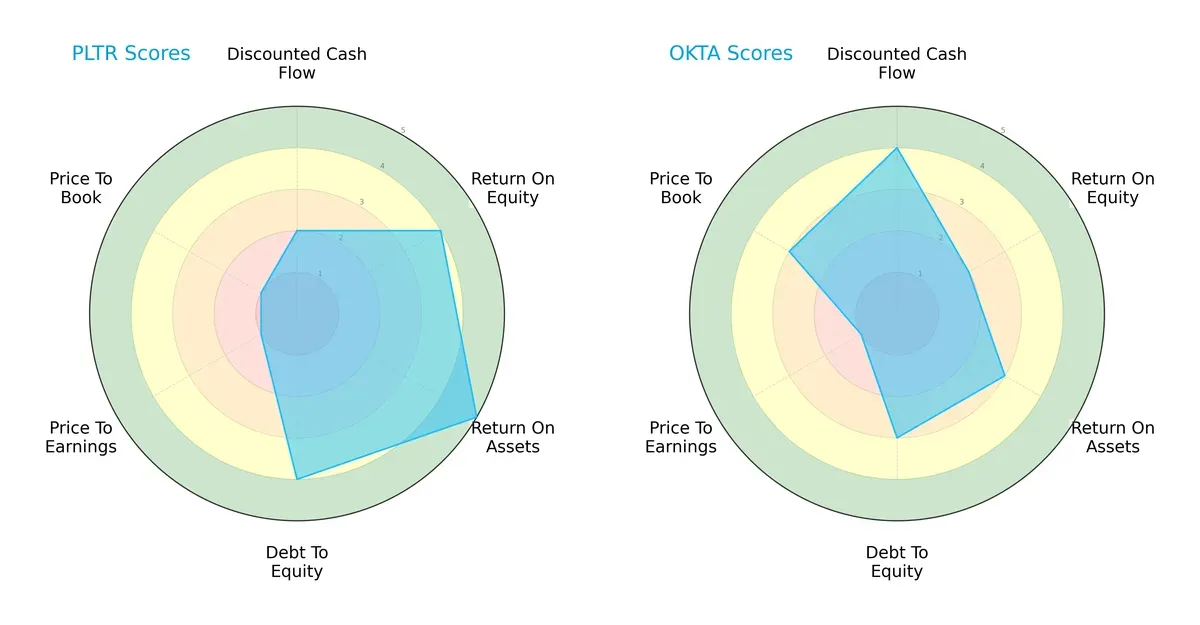
Palantir excels in operational efficiency with higher ROE (4 vs. 2) and ROA (5 vs. 3) scores, reflecting superior asset utilization. It also shows stronger balance sheet discipline with a debt-to-equity score of 4 compared to Okta’s 3. Conversely, Okta leads in discounted cash flow (DCF) valuation (4 vs. 2), suggesting better market expectations for future cash flows. Both companies suffer from weak valuation metrics, but Okta’s price-to-book score (3) outperforms Palantir’s (1). Overall, Palantir offers a more balanced profile driven by operational strength, while Okta relies on growth potential priced into its DCF.
Bankruptcy Risk: Solvency Showdown
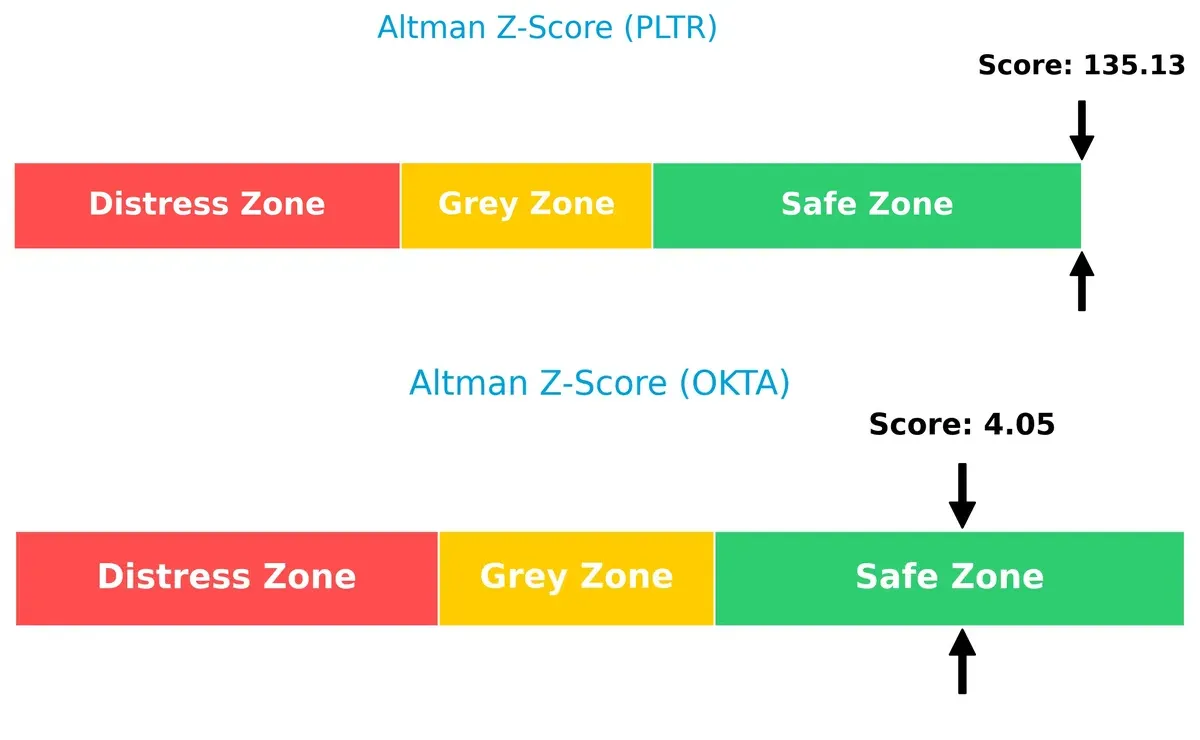
The Altman Z-Scores place both firms securely in the safe zone, though Palantir’s exceptionally high score (135.1 vs. 4.0) signals an extraordinarily robust solvency position for long-term survival in this cycle:
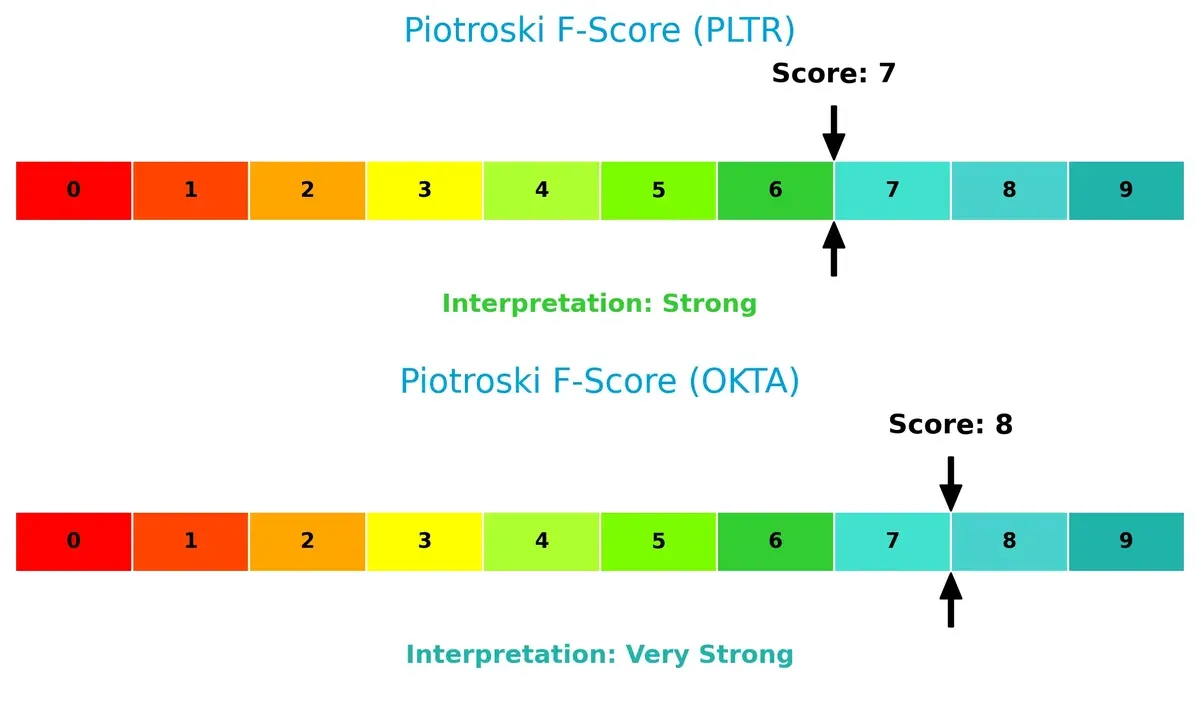
Financial Health: Quality of Operations
Piotroski F-Scores confirm strong financial health for both, with Okta scoring very strong (8) and Palantir strong (7). Okta’s slightly higher score suggests marginally better internal financial metrics and operational quality:
How are the two companies positioned?
This section dissects the operational DNA of Palantir and Okta by comparing their revenue distribution and internal dynamics. The goal is to confront their economic moats to identify which model offers the most resilient, sustainable competitive advantage today.
Revenue Segmentation: The Strategic Mix
This visual comparison dissects how Palantir Technologies Inc. and Okta, Inc. diversify their income streams and where their primary sector bets lie:
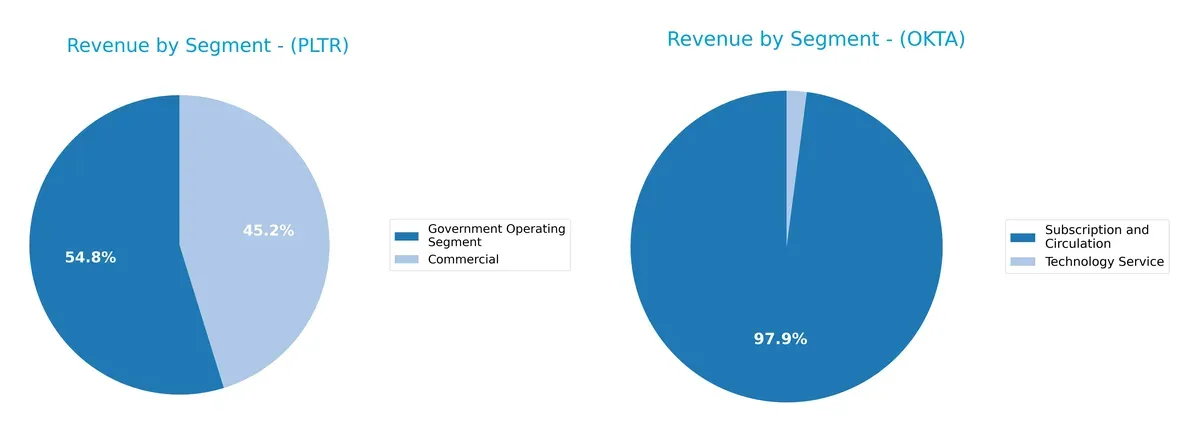
Palantir anchors revenue in two segments: $1.57B government and $1.30B commercial in 2024, showing a balanced but government-tilted mix. Okta relies heavily on subscription and circulation, $2.56B in 2025, dwarfing its $54M technology service income. Palantir’s dual-segment approach mitigates risk, leveraging government contracts’ stability. Okta’s concentration on subscriptions signals strong ecosystem lock-in but increases exposure to market shifts in recurring revenues.
Strengths and Weaknesses Comparison
This table compares the strengths and weaknesses of Palantir Technologies Inc. and Okta, Inc.:
Palantir Strengths
- Strong profitability with 36.31% net margin
- High ROE of 22% and ROIC of 17.95%
- Low debt-to-assets at 2.58%
- Solid quick ratio at 7.11
- Diverse revenue from commercial and government sectors
- Expanding global presence, notably in US, UK, and Rest of World
Okta Strengths
- Favorable WACC at 7.21% supporting capital costs
- Maintains a quick ratio of 1.35 indicating liquidity
- Moderate debt level with 10.09% debt-to-assets
- Strong fixed asset turnover at 22.31
- Revenue growth driven by Subscription and Circulation segment
- Significant US market share with growing non-US revenue
Palantir Weaknesses
- Unfavorable high P/E ratio at 259.19 indicating valuation risk
- Current ratio unusually high at 7.11, may signal inefficient asset use
- No dividend yield to return capital to shareholders
- WACC above ROIC at 11.79%
- Price-to-book ratio extremely elevated at 57.02
- Moderate asset turnover at 0.5
Okta Weaknesses
- Low profitability with 1.07% net margin and negative ROIC at -0.61%
- Low ROE at 0.44% reflecting minimal returns on equity
- High P/E at 570.6 suggests overvaluation
- Unfavorable asset turnover at 0.28
- No dividend yield
- Current ratio at 1.35 neutral, potentially tight liquidity
Palantir’s clear profit metrics and diversified revenue base contrast with Okta’s liquidity and asset efficiency strengths. However, each faces valuation and profitability challenges that require strategic capital management.
The Moat Duel: Analyzing Competitive Defensibility
A structural moat is the only thing protecting long-term profits from competition’s relentless erosion. Let’s examine two tech firms’ moats in 2026:
Palantir Technologies Inc.: Data Dominance via Intangible Assets
Palantir’s moat stems from proprietary software platforms and deep government ties. This drives high ROIC (above WACC by 6.16%) and margin stability near 36%. Expansion into AI-powered analytics deepens this moat.
Okta, Inc.: Identity Security with Network Effects
Okta’s moat relies on network effects from its identity cloud platform. Unlike Palantir, it struggles with ROIC below WACC, signaling value destruction despite rising profitability. Cloud security demand offers growth, but competition intensifies.
The Decisive Battle: Proprietary Intelligence vs. Network Effects
Palantir’s intangible asset moat is deeper and more durable, reflected in superior ROIC and margin profiles. Okta’s network effects provide opportunity but fall short of sustaining excess returns. Palantir is better equipped to defend its market share long term.
Which stock offers better returns?
The past year shows Palantir’s stock surged sharply overall but slowed recently, while Okta’s price declined steadily with a recent mild recovery.
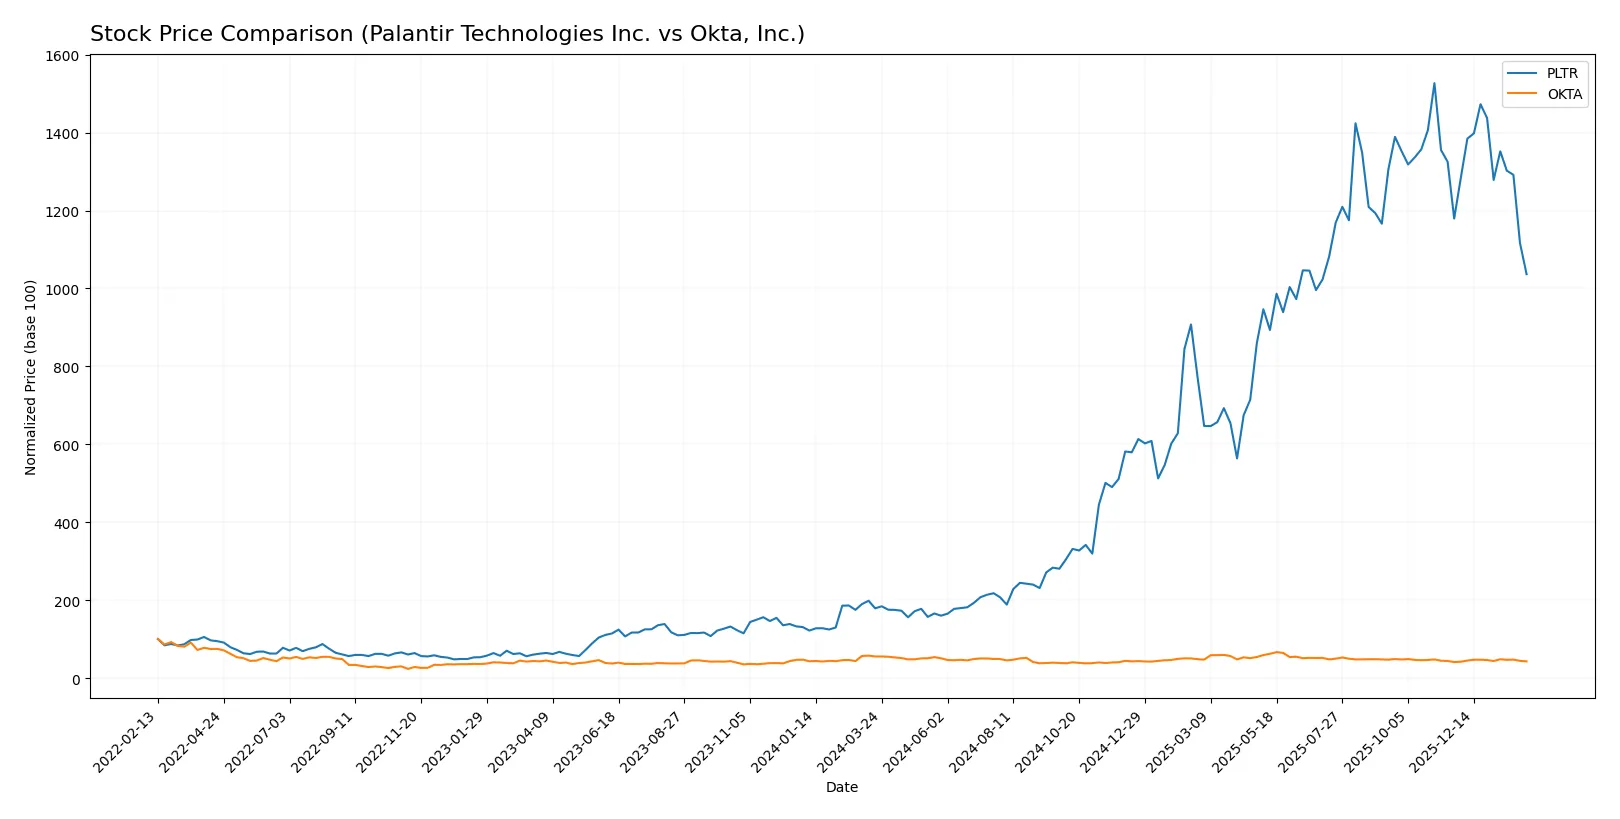
Trend Comparison
Palantir Technologies Inc. exhibited a strong bullish trend over 12 months with a 479.4% gain but showed deceleration and a recent 12-week decline of 12.11%. The price ranged from 20.47 to 200.47.
Okta, Inc. faced a bearish trend over the year with a 22.72% loss but accelerated downward. Recently, it posted a mild 4.21% gain, indicating a slight bullish shift from a low of 72.24 to a high of 127.3.
Palantir’s overall market performance vastly outpaced Okta’s despite recent weakness, delivering the highest total price appreciation during the analyzed period.
Target Prices
Analysts show a cautiously optimistic consensus for both Palantir Technologies and Okta, reflecting growth potential above current prices.
| Company | Target Low | Target High | Consensus |
|---|---|---|---|
| Palantir Technologies Inc. | 180 | 230 | 198.8 |
| Okta, Inc. | 60 | 140 | 110.67 |
Palantir’s consensus target of 199 exceeds its current 136 price, signaling analyst confidence in its infrastructure software growth. Okta’s consensus of 111 is also well above the 82 current price, implying upside despite recent volatility.

Don’t Let Luck Decide Your Entry Point
Optimize your entry points with our advanced ProRealTime indicators. You’ll get efficient buy signals with precise price targets for maximum performance. Start outperforming now!
How do institutions grade them?
Palantir Technologies Inc. Grades
The table below shows recent grades from leading institutions for Palantir Technologies Inc.:
| Grading Company | Action | New Grade | Date |
|---|---|---|---|
| Citigroup | Maintain | Buy | 2026-02-03 |
| UBS | Maintain | Neutral | 2026-02-03 |
| DA Davidson | Maintain | Neutral | 2026-02-03 |
| Citigroup | Upgrade | Buy | 2026-01-12 |
| Morgan Stanley | Maintain | Equal Weight | 2025-11-04 |
| Piper Sandler | Maintain | Overweight | 2025-11-04 |
| Goldman Sachs | Maintain | Neutral | 2025-11-04 |
| Baird | Maintain | Neutral | 2025-11-04 |
| B of A Securities | Maintain | Buy | 2025-11-04 |
| UBS | Maintain | Neutral | 2025-11-04 |
Okta, Inc. Grades
Below is a summary of recent institutional grades for Okta, Inc.:
| Grading Company | Action | New Grade | Date |
|---|---|---|---|
| Stephens & Co. | Upgrade | Overweight | 2026-01-14 |
| Piper Sandler | Maintain | Neutral | 2026-01-05 |
| RBC Capital | Maintain | Outperform | 2026-01-05 |
| Jefferies | Upgrade | Buy | 2025-12-16 |
| Needham | Maintain | Buy | 2025-12-12 |
| BTIG | Maintain | Buy | 2025-12-04 |
| Goldman Sachs | Maintain | Buy | 2025-12-03 |
| Citigroup | Maintain | Neutral | 2025-12-03 |
| Guggenheim | Maintain | Buy | 2025-12-03 |
| Piper Sandler | Maintain | Neutral | 2025-12-03 |
Which company has the best grades?
Okta holds generally stronger grades, with multiple Buy and Outperform ratings, including recent upgrades. Palantir mostly carries Neutral and Buy ratings with fewer upgrades. Stronger grades for Okta may suggest higher analyst confidence, affecting investor sentiment.
Risks specific to each company
The following categories identify critical pressure points and systemic threats facing Palantir Technologies Inc. and Okta, Inc. in the 2026 market environment:
1. Market & Competition
Palantir Technologies Inc.
- Operates in a competitive software infrastructure sector with strong government and commercial demand.
Okta, Inc.
- Faces fierce competition in identity and access management with rising market entrants.
2. Capital Structure & Debt
Palantir Technologies Inc.
- Very low debt-to-equity (0.03) and debt-to-assets (2.58%), minimal financial risk.
Okta, Inc.
- Moderate leverage with debt-to-equity at 0.15 and debt-to-assets at 10.09%, manageable but higher risk.
3. Stock Volatility
Palantir Technologies Inc.
- High beta at 1.687 indicates significant stock price volatility relative to market.
Okta, Inc.
- Low beta at 0.767 suggests lower volatility and more stability in market fluctuations.
4. Regulatory & Legal
Palantir Technologies Inc.
- Exposure to sensitive government contracts brings regulatory scrutiny and compliance risks.
Okta, Inc.
- Privacy and data security regulations pose ongoing legal challenges in identity management services.
5. Supply Chain & Operations
Palantir Technologies Inc.
- Relies heavily on software deployment and cloud infrastructure, with risks in operational scalability.
Okta, Inc.
- Dependent on cloud infrastructure stability and integration capabilities, with operational complexity.
6. ESG & Climate Transition
Palantir Technologies Inc.
- Limited direct ESG risks, but increasing demands for transparency and ethical data use.
Okta, Inc.
- Growing pressure to integrate ESG principles in product offerings and corporate governance.
7. Geopolitical Exposure
Palantir Technologies Inc.
- International government contracts subject to geopolitical shifts and export restrictions.
Okta, Inc.
- Primarily US-based but expanding internationally, exposed to geopolitical tensions affecting cloud services.
Which company shows a better risk-adjusted profile?
Palantir’s dominant risk centers on geopolitical exposure tied to government contracts. Okta’s biggest risk is its weak profitability amid intense competition and operational complexity. Palantir’s strong balance sheet and higher returns suggest a superior risk-adjusted profile despite volatility. Okta’s financials reveal tighter margins and more leverage, increasing risk. Palantir’s 36.3% net margin contrasts sharply with Okta’s 1.07%, underscoring profit resilience as a key differentiator.
Final Verdict: Which stock to choose?
Palantir’s superpower lies in its ability to generate robust returns on invested capital well above its cost of capital, signaling a durable competitive edge. Its rapid revenue and earnings growth underscore strong operational momentum. The key point of vigilance remains its sky-high valuation multiples, which may compress if growth slows. Palantir suits aggressive growth portfolios willing to embrace valuation risk for outsized returns.
Okta’s moat is rooted in its recurring revenue model and strong position in identity management, offering steadier cash flow visibility. Compared to Palantir, Okta presents a more conservative financial profile with moderate leverage and healthier liquidity ratios, though profitability remains thin. This makes Okta a fitting candidate for GARP investors seeking growth with a margin of safety.
If you prioritize strong economic moats and accelerating profitability, Palantir outshines Okta as a high-growth opportunity despite its stretched valuation. However, if you seek better financial stability and more predictable cash flows, Okta offers a safer foothold with its recurring revenue model and improving fundamentals. Both represent distinct analytical scenarios aligned with different risk tolerances and investment horizons.
Disclaimer: Investment carries a risk of loss of initial capital. The past performance is not a reliable indicator of future results. Be sure to understand risks before making an investment decision.
Go Further
I encourage you to read the complete analyses of Palantir Technologies Inc. and Okta, Inc. to enhance your investment decisions: