Oracle Corporation and Okta, Inc. are two key players in the software infrastructure industry, each driving innovation in enterprise technology solutions. Oracle, with its vast cloud applications and database services, contrasts with Okta’s specialized focus on identity and access management. Their overlapping markets and distinct innovation strategies make this comparison essential. In this article, I will help you determine which company presents the most compelling investment opportunity for your portfolio.

Table of contents
Companies Overview
I will begin the comparison between Oracle Corporation and Okta, Inc. by providing an overview of these two companies and their main differences.
Oracle Overview
Oracle Corporation focuses on delivering software and hardware solutions for enterprise IT environments worldwide. Its offerings include a wide range of cloud software applications such as ERP, human capital management, and supply chain management, alongside infrastructure technologies like Oracle Database and Java. Oracle also provides hardware systems and consulting services, serving various industries, government agencies, and educational institutions from its Austin, Texas headquarters.
Okta Overview
Okta, Inc. specializes in identity management solutions for enterprises, SMBs, universities, non-profits, and government agencies. Its core product, Okta Identity Cloud, offers capabilities like Single Sign-On, Multi-Factor Authentication, and API Access Management. The company also provides Auth0 products to enhance login security and user experience. Headquartered in San Francisco, Okta supports customers with direct sales and channel partners, focusing solely on identity security and management.
Key similarities and differences
Both Oracle and Okta operate in the software infrastructure sector, providing cloud-based solutions to enterprise clients and government organizations. Oracle offers a broader technology portfolio including cloud applications, databases, middleware, and hardware, while Okta concentrates exclusively on identity and access management solutions. Oracle’s scale and workforce are significantly larger, reflecting its diversified product range, whereas Okta targets a niche market with specialized security offerings.
Income Statement Comparison
This table compares the key income statement metrics for Oracle Corporation and Okta, Inc. for their most recent fiscal years.
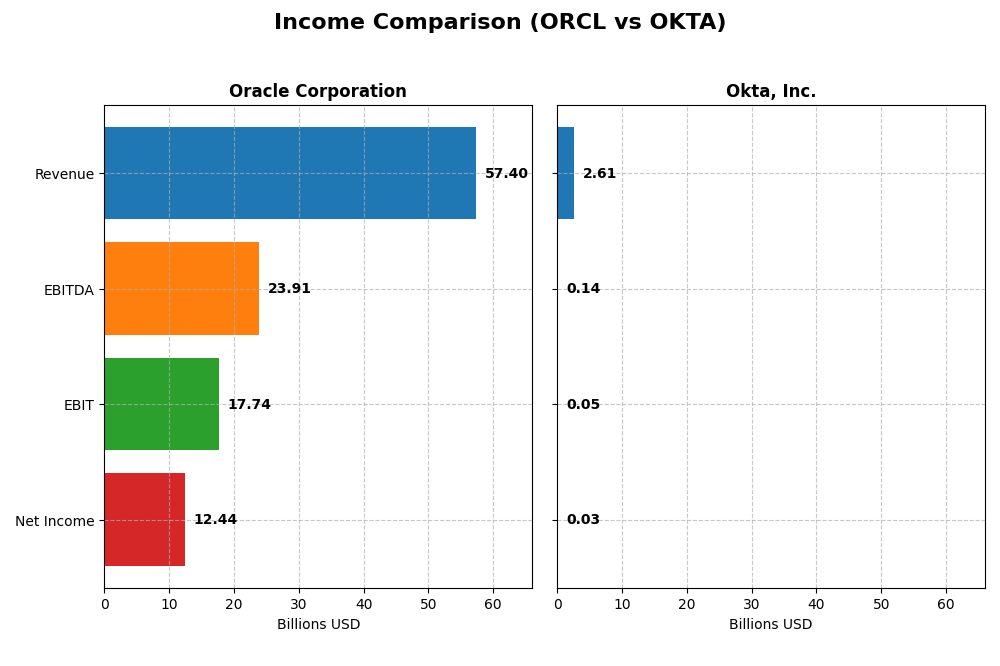
| Metric | Oracle Corporation | Okta, Inc. |
|---|---|---|
| Market Cap | 549B | 15.2B |
| Revenue | 57.4B | 2.61B |
| EBITDA | 23.9B | 139M |
| EBIT | 17.7B | 51M |
| Net Income | 12.4B | 28M |
| EPS | 4.46 | 0.17 |
| Fiscal Year | 2025 | 2025 |
Income Statement Interpretations
Oracle Corporation
Oracle’s revenue increased steadily from $40.5B in 2021 to $57.4B in 2025, reflecting strong growth. Net income showed fluctuations, peaking at $13.7B in 2021 but declining to $12.4B in 2025. Margins generally improved with a favorable gross margin of 70.5% and net margin of 21.7% in 2025. The latest year saw 8.4% revenue growth and nearly 17% EPS growth, indicating solid recent performance.
Okta, Inc.
Okta demonstrated rapid revenue growth from $835M in 2021 to $2.61B in 2025, more than tripling over five years. Net income turned positive in 2025 at $28M after years of losses, supported by improving margins. Gross margin remained favorable at 76.3%, while net margin was modest at 1.1%. The latest year showed strong momentum with 15.3% revenue growth and over 100% growth in net margin and EPS.
Which one has the stronger fundamentals?
Okta exhibits robust top-line expansion and consistent margin improvement, turning profitable after sustained losses, reflecting dynamic growth fundamentals. Oracle presents a mature profile with high revenue and solid margins but experienced net income decline over the period. While Oracle’s income statement is largely favorable, Okta’s accelerating growth and margin gains suggest stronger fundamental momentum currently.
Financial Ratios Comparison
Below is a comparison of key financial ratios for Oracle Corporation and Okta, Inc. for their most recent fiscal years available.
| Ratios | Oracle Corporation (2025) | Okta, Inc. (2025) |
|---|---|---|
| ROE | 60.8% | 0.44% |
| ROIC | 10.9% | -0.61% |
| P/E | 37.1 | 570.6 |
| P/B | 22.6 | 2.49 |
| Current Ratio | 0.75 | 1.35 |
| Quick Ratio | 0.75 | 1.35 |
| D/E (Debt-to-Equity) | 5.09 | 0.15 |
| Debt-to-Assets | 61.8% | 10.1% |
| Interest Coverage | 4.94 | -14.8 |
| Asset Turnover | 0.34 | 0.28 |
| Fixed Asset Turnover | 1.32 | 22.31 |
| Payout Ratio | 38.1% | 0% |
| Dividend Yield | 1.03% | 0% |
Interpretation of the Ratios
Oracle Corporation
Oracle shows strong profitability ratios, with a net margin of 21.68% and a very high return on equity of 60.84%, indicating effective capital use. However, liquidity ratios are weak, with a current ratio at 0.75, and leverage is high, as debt to equity stands at 5.09. Oracle pays dividends, yielding 1.03%, supported by a stable payout ratio, though some concerns exist about sustainability due to high debt.
Okta, Inc.
Okta’s profitability ratios are weak, with a net margin of just 1.07% and a return on equity near zero. Liquidity and solvency are better, with a current ratio of 1.35 and low debt levels, showing financial stability. Okta does not pay dividends, reflecting its reinvestment strategy in a high-growth phase, prioritizing R&D and expanding operations instead of shareholder distributions.
Which one has the best ratios?
Oracle excels in profitability and capital returns but shows weaknesses in liquidity and high leverage, increasing financial risk. Okta demonstrates better liquidity and lower debt but struggles with profitability and returns, typical for growth-focused firms. Overall, Oracle’s ratios suggest a mature, profitable business, while Okta reflects a growth-oriented profile with neutral overall ratios.
Strategic Positioning
This section compares the strategic positioning of Oracle and Okta, including their market position, key segments, and exposure to technological disruption:
Oracle Corporation
- Large market cap of 549B with broad competitive pressure in enterprise IT software and infrastructure sectors.
- Revenue driven by diversified segments: cloud and license (49B), services (5.2B), hardware (2.9B) in 2025.
- Exposure to disruption through cloud software, autonomous databases, IoT, and blockchain technologies.
Okta, Inc.
- Smaller market cap of 15B focused on identity solutions with moderate competitive pressure in cloud security.
- Revenue mainly from subscription and circulation (2.56B) with minor technology services segment (54M) in 2025.
- Faces technological disruption risks focused on identity cloud innovations and security enhancements.
Oracle Corporation vs Okta, Inc. Positioning
Oracle pursues a diversified strategy spanning cloud, hardware, and services, providing multiple revenue streams but facing complex integration challenges. Okta concentrates solely on identity management and security, allowing focused innovation but limiting market breadth and scale.
Which has the best competitive advantage?
Both companies are currently shedding value with slightly unfavorable MOAT evaluations. Oracle’s declining profitability contrasts with Okta’s improving ROIC trend, indicating different paths in competitive advantage sustainability.
Stock Comparison
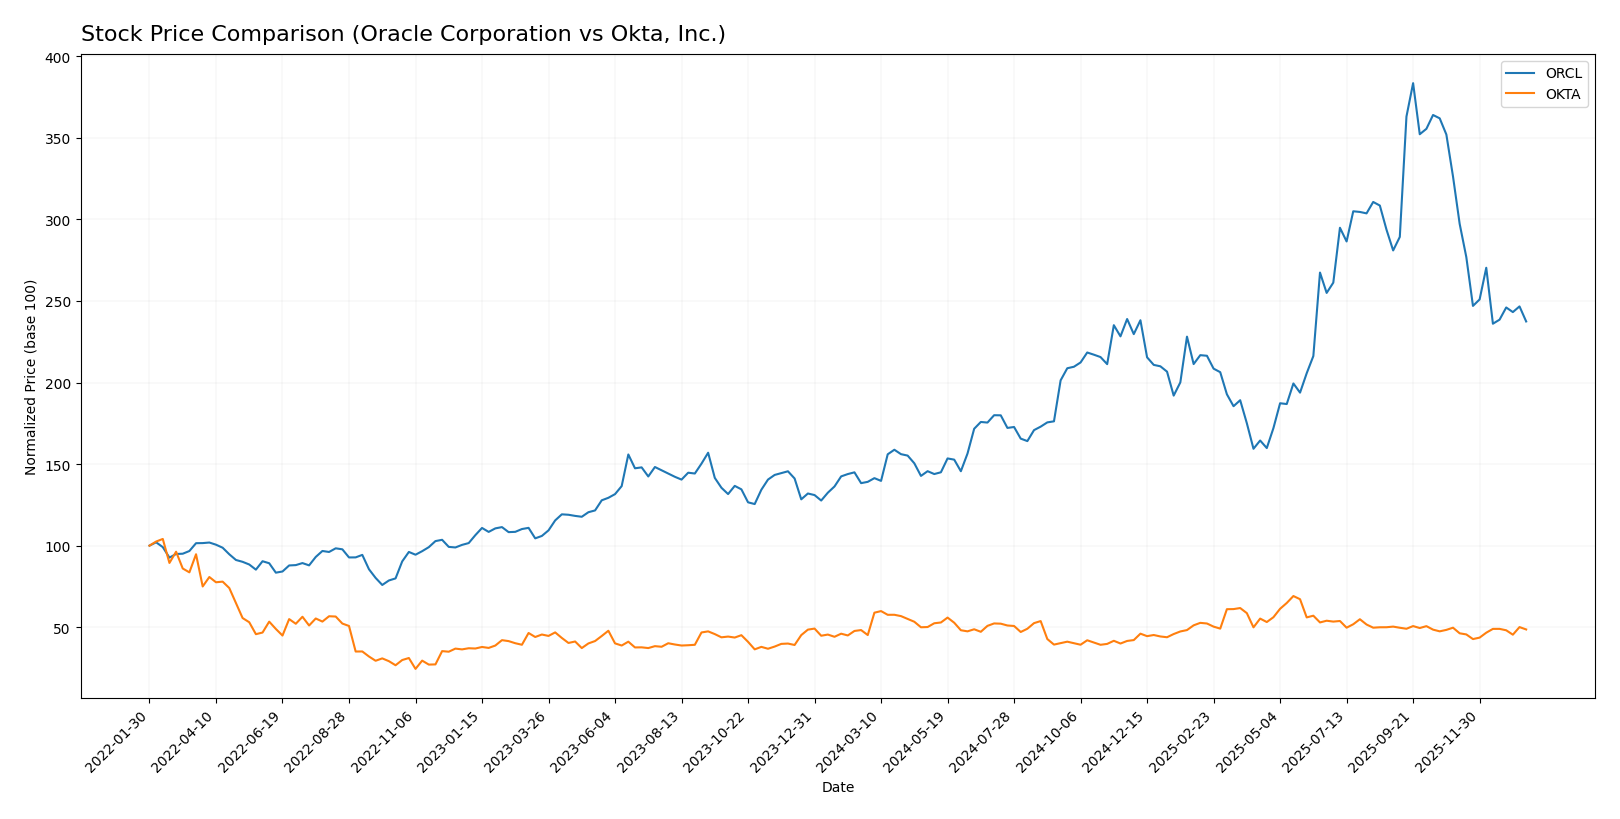
The stock price chart illustrates significant price movements and distinct trading dynamics for Oracle Corporation and Okta, Inc. over the past 12 months, highlighting Oracle’s strong overall gains alongside recent volatility and Okta’s steady but moderate appreciation.
Trend Analysis
Oracle Corporation’s stock demonstrated a bullish trend over the past year with a 70.69% increase, though the trend showed deceleration and a recent short-term decline of 27.23%. The stock experienced notable highs at 308.66 and lows at 111.95.
Okta, Inc. recorded a bullish trend with a 7.58% increase over the same period, accompanied by accelerating momentum and less volatility. Recent trading showed a slight negative change of 2.16% but maintained buyer dominance.
Comparing both stocks, Oracle delivered the highest market performance with a substantially larger price increase despite recent short-term weakness, while Okta showed consistent but more moderate gains.
Target Prices
The current analyst consensus presents a positive outlook with notable upside potential for both Oracle Corporation and Okta, Inc.
| Company | Target High | Target Low | Consensus |
|---|---|---|---|
| Oracle Corporation | 400 | 175 | 314.08 |
| Okta, Inc. | 140 | 60 | 110.67 |
Analysts expect Oracle’s price to potentially rise significantly above the current 191.09 USD, while Okta’s consensus target of 110.67 USD suggests a moderate upside from its current 89.55 USD price.
Analyst Opinions Comparison
This section compares analysts’ ratings and grades for Oracle Corporation and Okta, Inc.:
Rating Comparison
Oracle Corporation Rating
- Rating: B, considered very favorable by analysts.
- Discounted Cash Flow Score: 3, moderate valuation rating.
- ROE Score: 5, very favorable indication of profit efficiency.
- ROA Score: 4, favorable asset utilization.
- Debt To Equity Score: 1, very unfavorable, high financial risk.
- Overall Score: 3, moderate overall financial standing.
Okta, Inc. Rating
- Rating: B, also considered very favorable by analysts.
- Discounted Cash Flow Score: 4, favorable valuation rating.
- ROE Score: 2, moderate efficiency in profit generation.
- ROA Score: 3, moderate asset utilization.
- Debt To Equity Score: 4, favorable, lower financial risk.
- Overall Score: 3, moderate overall financial standing.
Which one is the best rated?
Both Oracle and Okta share the same overall rating of B and an overall score of 3, indicating moderate financial standing. Oracle excels in ROE and ROA, but Okta shows better scores in discounted cash flow and debt-to-equity, reflecting different strengths.
Scores Comparison
Here is a comparison of the Altman Z-Score and Piotroski Score for Oracle Corporation and Okta, Inc.:
Oracle Corporation Scores
- Altman Z-Score: 2.43, indicating a grey zone risk.
- Piotroski Score: 5, reflecting average financial strength.
Okta, Inc. Scores
- Altman Z-Score: 4.15, indicating a safe zone.
- Piotroski Score: 8, reflecting very strong financial strength.
Which company has the best scores?
Based on the provided data, Okta has stronger scores with a safe zone Altman Z-Score and a very strong Piotroski Score, while Oracle is in the grey zone with an average Piotroski Score.
Grades Comparison
The following section compares the latest available grades from reputable financial institutions for Oracle Corporation and Okta, Inc.:
Oracle Corporation Grades
This table summarizes recent grades assigned by leading financial analysts to Oracle Corporation:
| Grading Company | Action | New Grade | Date |
|---|---|---|---|
| UBS | Maintain | Buy | 2026-01-05 |
| RBC Capital | Maintain | Sector Perform | 2026-01-05 |
| Jefferies | Maintain | Buy | 2026-01-05 |
| Goldman Sachs | Maintain | Neutral | 2025-12-12 |
| Keybanc | Maintain | Overweight | 2025-12-11 |
| UBS | Maintain | Buy | 2025-12-11 |
| Citigroup | Maintain | Buy | 2025-12-11 |
| JP Morgan | Maintain | Neutral | 2025-12-11 |
| DA Davidson | Maintain | Neutral | 2025-12-11 |
| Scotiabank | Maintain | Sector Outperform | 2025-12-11 |
Oracle’s grades predominantly indicate a positive outlook, with multiple Buy and Overweight ratings alongside several Neutral and Sector Perform opinions, reflecting a generally favorable consensus.
Okta, Inc. Grades
Below is a summary of recent grades issued by recognized financial firms for Okta, Inc.:
| Grading Company | Action | New Grade | Date |
|---|---|---|---|
| Stephens & Co. | Upgrade | Overweight | 2026-01-14 |
| Piper Sandler | Maintain | Neutral | 2026-01-05 |
| RBC Capital | Maintain | Outperform | 2026-01-05 |
| Jefferies | Upgrade | Buy | 2025-12-16 |
| Needham | Maintain | Buy | 2025-12-12 |
| BTIG | Maintain | Buy | 2025-12-04 |
| Susquehanna | Maintain | Neutral | 2025-12-03 |
| Cantor Fitzgerald | Maintain | Overweight | 2025-12-03 |
| Canaccord Genuity | Maintain | Buy | 2025-12-03 |
| Scotiabank | Maintain | Sector Perform | 2025-12-03 |
Okta shows a strong trend toward Buy and Overweight ratings, with recent upgrades noted, indicating increasing analyst confidence.
Which company has the best grades?
Both Oracle and Okta hold a consensus “Buy” rating, but Okta has experienced recent upgrades and a higher proportion of Overweight and Buy ratings. This may suggest comparatively stronger analyst enthusiasm, potentially influencing investor sentiment and portfolio allocation decisions.
Strengths and Weaknesses
Below is a comparison of Oracle Corporation and Okta, Inc. across key business criteria based on the most recent data available.
| Criterion | Oracle Corporation | Okta, Inc. |
|---|---|---|
| Diversification | Highly diversified: Cloud & License $49.2B, Hardware $2.9B, Services $5.2B | Less diversified: Subscription $2.56B, Technology Service $54M |
| Profitability | Strong profitability: Net margin 21.7%, ROIC 10.9%, ROE 60.8% | Low profitability: Net margin 1.1%, ROIC -0.6%, ROE 0.4% |
| Innovation | Moderate innovation; declining ROIC trend (-17.7%) indicates challenges | Improving innovation: growing ROIC trend (+92%) but currently negative ROIC |
| Global presence | Extensive global footprint and market reach | Growing global presence but smaller scale |
| Market Share | Large and established market share in cloud and software | Emerging player with growing market share in identity management |
Key takeaways: Oracle shows strong diversification and profitability but faces declining efficiency in capital use. Okta is less diversified and currently less profitable but demonstrates a positive trajectory in innovation and profitability, signaling potential growth. Investors should weigh Oracle’s stability against Okta’s growth prospects with caution.
Risk Analysis
The following table summarizes key risks for Oracle Corporation (ORCL) and Okta, Inc. (OKTA) based on the most recent data from 2025-2026:
| Metric | Oracle Corporation (ORCL) | Okta, Inc. (OKTA) |
|---|---|---|
| Market Risk | High beta (1.65) indicates above-average volatility | Low beta (0.76) suggests lower volatility |
| Debt level | High debt-to-assets (61.8%), D/E ratio 5.09 (unfavorable) | Low debt-to-assets (10.1%), D/E ratio 0.15 (favorable) |
| Regulatory Risk | Moderate, due to global IT regulations | Moderate, focused on identity and data privacy laws |
| Operational Risk | Large scale operations with moderate interest coverage (4.96) | Smaller scale, strong interest coverage (10.2), but rapid growth challenges |
| Environmental Risk | Standard tech sector exposure, no major issues reported | Standard tech sector exposure, no major issues reported |
| Geopolitical Risk | Exposure due to global enterprise client base | Moderate, with international expansion efforts ongoing |
Oracle faces significant market risk and financial leverage concerns due to its high debt levels, which could impact stability in volatile markets. Okta’s lower debt and strong liquidity position it more favorably, but its high valuation multiples and operational risks from scaling remain concerns. Geopolitical and regulatory risks are moderate for both, reflecting their global tech footprint. Investors should weigh Oracle’s leverage risk against its strong profitability and Okta’s growth potential tempered by valuation and margin pressures.
Which Stock to Choose?
Oracle Corporation (ORCL) shows a favorable income evolution with 8.38% revenue growth in 2025 and strong profitability indicators including a 21.68% net margin and 60.84% ROE. However, it faces unfavorable financial ratios such as a high debt-to-equity ratio of 5.09 and low liquidity ratios, resulting in an overall unfavorable ratio evaluation. Its rating is very favorable (B), supported by strong return scores but weakened by valuation and leverage concerns.
Okta, Inc. (OKTA) presents robust income growth, with 15.33% revenue growth and a 1.07% net margin in 2025. Financial ratios are mixed, with favorable liquidity and low leverage but a very high P/E of 570.6 and weak profitability metrics, yielding a neutral global ratio evaluation. Its rating is also very favorable (B), driven by solid discounted cash flow and debt management but challenged by valuation and returns.
For investors prioritizing stability and efficient capital use, Oracle’s strong profitability and income growth might appear more favorable despite its leverage concerns. Conversely, growth-oriented investors could find Okta’s accelerating income growth and improving profitability appealing, albeit with higher valuation and profitability risks. The choice could depend on an investor’s risk tolerance and investment strategy.
Disclaimer: Investment carries a risk of loss of initial capital. The past performance is not a reliable indicator of future results. Be sure to understand risks before making an investment decision.
Go Further
I encourage you to read the complete analyses of Oracle Corporation and Okta, Inc. to enhance your investment decisions: