In the evolving energy sector, Xcel Energy Inc. (XEL) and Oklo Inc. (OKLO) stand out for their distinct approaches to power generation. Xcel Energy, a well-established utility giant, operates a diverse portfolio including renewables and traditional sources, while Oklo pioneers advanced fission technology targeting future energy needs. Comparing these innovators reveals contrasting strategies in regulated electric markets, helping investors identify which company aligns best with their portfolio goals. Let’s explore which stock offers the most compelling opportunity.
Table of contents
Companies Overview
I will begin the comparison between Xcel Energy Inc. and Oklo Inc. by providing an overview of these two companies and their main differences.
Xcel Energy Inc. Overview
Xcel Energy Inc. operates as a regulated electric utility serving approximately 3.7M electricity and 2.1M natural gas customers across several US states. The company generates electricity using diverse sources including coal, nuclear, natural gas, hydroelectric, solar, biomass, oil, wood/refuse, and wind. It also engages in natural gas pipeline development and renewable facility construction, positioning itself as a broad-based energy provider in the utilities sector.
Oklo Inc. Overview
Oklo Inc. focuses on designing and developing fission power plants to deliver reliable, commercial-scale energy within the United States. Additionally, it offers used nuclear fuel recycling services. Founded in 2013 and based in Santa Clara, California, Oklo represents a specialized player in the regulated electric industry with a concentrated emphasis on advanced nuclear technology and innovation.
Key similarities and differences
Both companies operate in the regulated electric utilities sector within the US, aiming to provide energy solutions to customers. Xcel Energy has a diversified energy generation portfolio and a larger customer base, while Oklo specializes in nuclear fission power and related recycling services. Xcel is an established utility with a broad operational footprint, contrasting with Oklo’s niche focus on advanced nuclear technology and smaller scale.
Income Statement Comparison
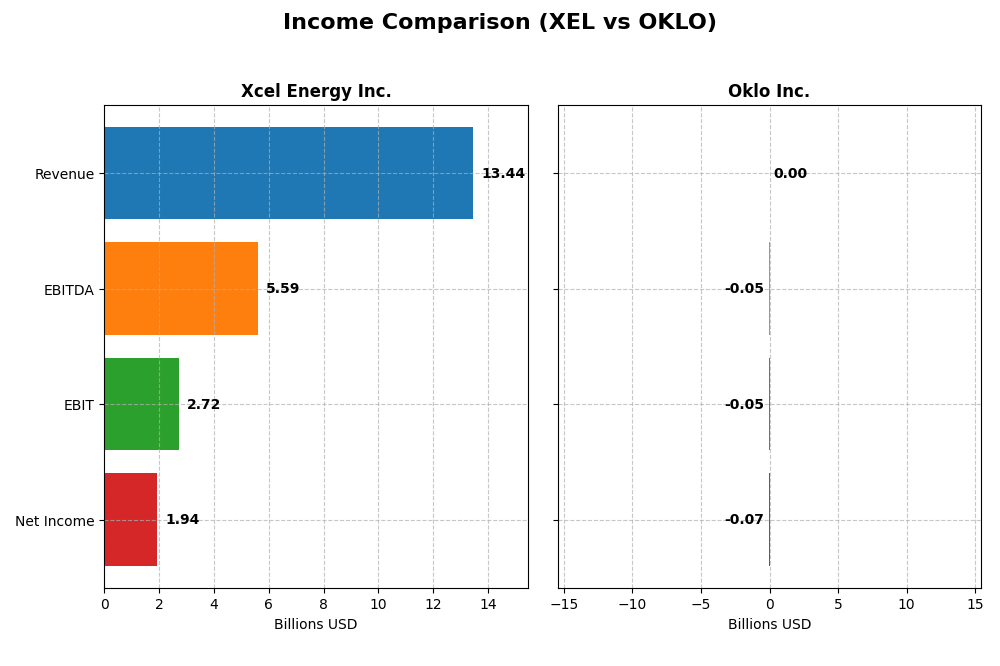
The table below presents a side-by-side comparison of key income statement metrics for Xcel Energy Inc. and Oklo Inc. for the fiscal year 2024.
| Metric | Xcel Energy Inc. (XEL) | Oklo Inc. (OKLO) |
|---|---|---|
| Market Cap | 43.9B | 16.5B |
| Revenue | 13.44B | 0 |
| EBITDA | 5.59B | -52.5M |
| EBIT | 2.72B | -52.8M |
| Net Income | 1.94B | -73.6M |
| EPS | 3.44 | -0.74 |
| Fiscal Year | 2024 | 2024 |
Income Statement Interpretations
Xcel Energy Inc.
Xcel Energy displayed overall revenue growth of 16.6% from 2020 to 2024, with net income increasing by 31.4% over the same period. Margins remained solid, with a gross margin of 45.7% and a net margin of 14.4%, both rated favorable. In 2024, revenue declined by 5.4%, but net income and net margin improved, indicating better profitability despite the top-line contraction.
Oklo Inc.
Oklo’s income statement shows no revenue generation from 2021 through 2024, resulting in consistent net losses. Margins remain unfavorable with zero gross, EBIT, and net margins, reflecting ongoing development-stage expenses. The net loss deepened in 2024, with EPS declining by 59.4%, underscoring the company’s continued investment phase without commercial revenue.
Which one has the stronger fundamentals?
Xcel Energy demonstrates stronger fundamentals with favorable margin profiles, positive net income growth, and a solid revenue base, despite a recent revenue dip. In contrast, Oklo operates at a significant loss with no revenue or margins, reflecting its early-stage status. Overall, Xcel Energy’s income statement reflects stability and profitability compared to Oklo’s unfavorable financial metrics.
Financial Ratios Comparison
The table below compares key financial ratios for Xcel Energy Inc. (XEL) and Oklo Inc. (OKLO) based on their most recent fiscal year data from 2024.
| Ratios | Xcel Energy Inc. (XEL) | Oklo Inc. (OKLO) |
|---|---|---|
| ROE | 9.92% | -29.35% |
| ROIC | 4.59% | -19.23% |
| P/E | 19.64 | -28.52 |
| P/B | 1.95 | 8.37 |
| Current Ratio | 0.67 | 43.47 |
| Quick Ratio | 0.57 | 43.47 |
| D/E | 1.55 | 0.005 |
| Debt-to-Assets | 43.13% | 0.46% |
| Interest Coverage | 2.02 | 0 |
| Asset Turnover | 0.19 | 0 |
| Fixed Asset Turnover | 0.23 | 0 |
| Payout Ratio | 60.7% | 0 |
| Dividend Yield | 3.09% | 0 |
Interpretation of the Ratios
Xcel Energy Inc.
Xcel Energy shows mixed ratio results with a strong net margin of 14.4% and a favorable dividend yield of 3.09%. However, weak return on equity at 9.92%, low asset turnover, and unfavorable liquidity ratios indicate operational and financial efficiency concerns. The company pays dividends supported by stable free cash flow, but cautious monitoring of payout sustainability is advisable.
Oklo Inc.
Oklo exhibits mostly unfavorable ratios, including negative return on equity (-29.35%) and return on invested capital (-19.23%), reflecting losses and operational challenges. The extremely high current ratio suggests excess liquidity but may signal inefficiency. Oklo does not pay dividends, likely due to its negative net income and focus on growth and R&D rather than shareholder returns.
Which one has the best ratios?
Comparing both, Xcel Energy presents a more balanced financial profile with some favorable profitability and dividend metrics despite weaknesses in efficiency and liquidity. Oklo’s ratios are predominantly unfavorable due to losses and operational inefficiencies, compounded by no dividend payments. Thus, Xcel Energy has the stronger ratio set overall.
Strategic Positioning
This section compares the strategic positioning of Xcel Energy Inc. and Oklo Inc., including market position, key segments, and exposure to technological disruption:
Xcel Energy Inc.
- Large market cap with established position, facing regulated electric industry competition.
- Diverse business segments: regulated electric and natural gas utilities driving revenue.
- Operates multiple energy sources including renewables, with potential disruption from new nuclear technologies.
Oklo Inc.
- Smaller market cap, emerging competitor in nuclear power plant design.
- Focused on fission power plants and nuclear fuel recycling services.
- Directly engaged in nuclear technology innovation, facing disruption risks inherent to new energy tech.
Xcel Energy Inc. vs Oklo Inc. Positioning
Xcel Energy has a diversified portfolio across electric and gas utilities with broad geographic coverage, providing stable revenue streams. Oklo is concentrated on advanced nuclear solutions, representing a niche with higher innovation risk and focused growth potential.
Which has the best competitive advantage?
Xcel Energy shows a slightly unfavorable moat due to value destruction but improving profitability, whereas Oklo has a very unfavorable moat with declining returns, indicating Xcel currently holds a stronger competitive advantage.
Stock Comparison
The stock price movements of Xcel Energy Inc. (XEL) and Oklo Inc. (OKLO) over the past year reveal significant bullish trends with notable deceleration and recent downward pressures in both equities.
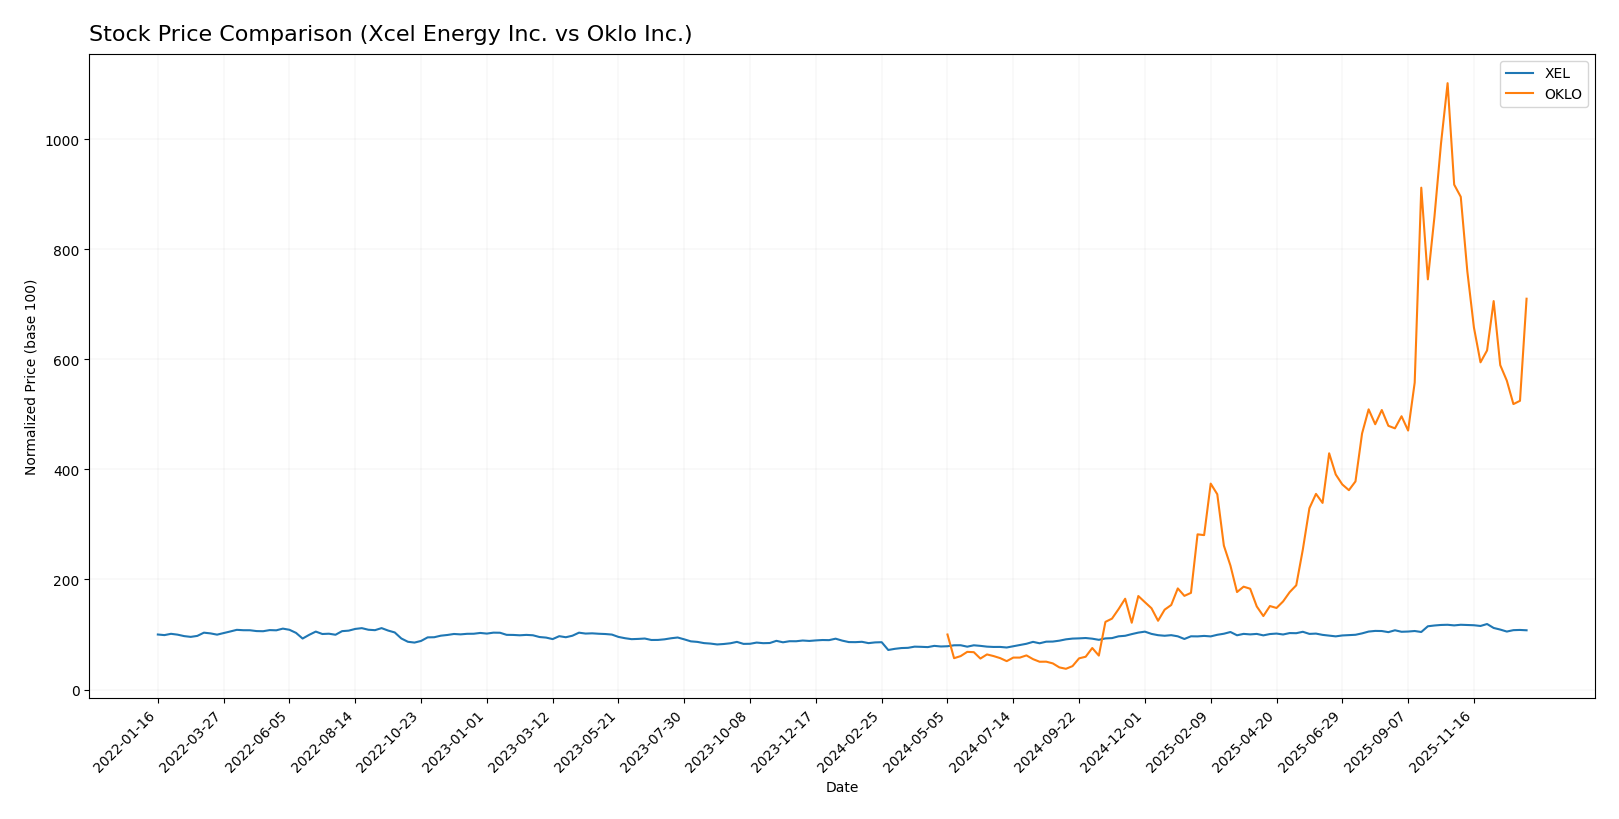
Trend Analysis
Xcel Energy Inc. (XEL) experienced a 25.72% price increase over the past 12 months, indicating a bullish trend with deceleration. The stock ranged from $49.57 to $82.11, showing moderate volatility (8.44 std deviation).
Oklo Inc. (OKLO) posted a substantial 610.11% gain over the same period, also bullish with deceleration. It exhibited higher volatility (39.02 std deviation), with prices moving between $5.59 and $163.39.
Comparing both, Oklo Inc. delivered the highest market performance with a significantly larger price increase despite greater volatility, while Xcel Energy showed steadier gains.
Target Prices
Here is the consensus target price overview for the selected utilities.
| Company | Target High | Target Low | Consensus |
|---|---|---|---|
| Xcel Energy Inc. | 96 | 81 | 87 |
| Oklo Inc. | 150 | 95 | 125.67 |
Analysts see Xcel Energy’s stock moving up from its current 74.26 USD toward a consensus target of 87 USD, suggesting moderate upside. Oklo’s consensus target of 125.67 USD implies significant growth potential from its current 105.31 USD price.
Analyst Opinions Comparison
This section compares analysts’ ratings and grades for Xcel Energy Inc. (XEL) and Oklo Inc. (OKLO):
Rating Comparison
XEL Rating
- Rating: C+ with a very favorable overall assessment.
- Discounted Cash Flow Score: 4, considered favorable for valuation.
- ROE Score: 3, a moderate indicator of profit generation efficiency.
- ROA Score: 2, moderate effectiveness in asset utilization.
- Debt To Equity Score: 1, very unfavorable, indicating higher financial risk.
- Overall Score: 2, moderate overall financial standing.
OKLO Rating
- Rating: C+ with a very favorable overall assessment.
- Discounted Cash Flow Score: 3, rated moderate for valuation.
- ROE Score: 1, very unfavorable, indicating low efficiency.
- ROA Score: 1, very unfavorable in using assets to generate earnings.
- Debt To Equity Score: 5, very favorable, showing strong balance sheet.
- Overall Score: 2, moderate overall financial standing.
Which one is the best rated?
Both XEL and OKLO share the same overall rating of C+ and overall score of 2, reflecting moderate standing. XEL scores better on cash flow and profitability metrics, while OKLO excels in debt management.
Scores Comparison
The scores comparison between Xcel Energy Inc. and Oklo Inc. highlights their financial risk and strength indicators:
XEL Scores
- Altman Z-Score: 0.89, indicating financial distress zone with high bankruptcy risk.
- Piotroski Score: 5, reflecting average financial strength.
OKLO Scores
- Altman Z-Score: 339.43, indicating a safe zone with very low bankruptcy risk.
- Piotroski Score: 2, reflecting very weak financial strength.
Which company has the best scores?
Based strictly on the provided data, Oklo Inc. has a significantly higher Altman Z-Score, placing it in the safe zone, while Xcel Energy is in distress. However, Xcel Energy’s Piotroski Score is higher, showing better financial strength than Oklo’s very weak score.
Grades Comparison
Here is the grades comparison from recognized grading companies for Xcel Energy Inc. and Oklo Inc.:
Xcel Energy Inc. Grades
The table below summarizes recent grades from reputable financial institutions for Xcel Energy Inc.:
| Grading Company | Action | New Grade | Date |
|---|---|---|---|
| UBS | Maintain | Neutral | 2025-12-17 |
| Keybanc | Maintain | Overweight | 2025-12-12 |
| JP Morgan | Maintain | Overweight | 2025-12-11 |
| Barclays | Maintain | Overweight | 2025-11-05 |
| Citigroup | Maintain | Buy | 2025-11-03 |
| UBS | Maintain | Neutral | 2025-10-31 |
| Mizuho | Maintain | Outperform | 2025-10-27 |
| Jefferies | Maintain | Buy | 2025-10-16 |
| Keybanc | Maintain | Overweight | 2025-10-15 |
| BMO Capital | Maintain | Outperform | 2025-10-15 |
The overall trend for Xcel Energy shows consistent positive ratings, mostly ranging from Neutral to Buy and Outperform, indicating stable confidence from major analysts.
Oklo Inc. Grades
The table below summarizes recent grades from reputable financial institutions for Oklo Inc.:
| Grading Company | Action | New Grade | Date |
|---|---|---|---|
| Seaport Global | Upgrade | Buy | 2025-12-08 |
| UBS | Maintain | Neutral | 2025-12-03 |
| B of A Securities | Maintain | Neutral | 2025-11-12 |
| B. Riley Securities | Maintain | Buy | 2025-11-12 |
| Wedbush | Maintain | Outperform | 2025-11-12 |
| B of A Securities | Downgrade | Neutral | 2025-09-30 |
| Seaport Global | Downgrade | Neutral | 2025-09-23 |
| Wedbush | Maintain | Outperform | 2025-09-22 |
| Wedbush | Maintain | Outperform | 2025-08-14 |
| Wedbush | Maintain | Outperform | 2025-08-12 |
Oklo Inc.’s grades show a mixture of Neutral, Buy, and Outperform ratings, with some recent upgrades but also downgrades to Neutral, reflecting a more variable analyst sentiment.
Which company has the best grades?
Xcel Energy Inc. demonstrates a more consistently positive analyst outlook with multiple Buy and Outperform ratings maintained over time. Oklo Inc. shows a mix of Neutral and Outperform ratings but with recent downgrades as well. This suggests Xcel Energy has received comparatively stronger and more stable grades, which may influence investor confidence in its valuation and risk profile.
Strengths and Weaknesses
Below is a comparison table highlighting key strengths and weaknesses of Xcel Energy Inc. (XEL) and Oklo Inc. (OKLO) based on their latest financial performance and operational metrics.
| Criterion | Xcel Energy Inc. (XEL) | Oklo Inc. (OKLO) |
|---|---|---|
| Diversification | Moderate: Primarily regulated electric (22.3B) and natural gas (4.5B) segments; steady revenue growth | Low: Early-stage company with limited revenue streams and product diversification |
| Profitability | Moderate: Net margin 14.4% favorable; ROIC 4.59% slightly below WACC (5.1%), shedding value but improving | Poor: Negative net margin, ROIC -19.23%, value destroying and declining profitability |
| Innovation | Moderate: Traditional utility with gradual improvements but limited breakthrough innovation | Low: Emerging tech company with high risk and uncertain innovation impact |
| Global presence | Limited: Mainly US-regulated markets with stable customer base | Very limited: Primarily US-based, early development phase |
| Market Share | Strong in regulated electric and gas markets with leading regional presence | Negligible: New entrant with no significant market share |
Key takeaways: Xcel Energy offers stable revenues and improving profitability despite currently shedding value, making it a cautiously favorable option for risk-managed portfolios. Oklo, however, faces serious profitability challenges and lacks diversification, indicating higher investment risk and uncertainty.
Risk Analysis
Below is a comparative table of key risks for Xcel Energy Inc. (XEL) and Oklo Inc. (OKLO) based on the most recent 2024 data:
| Metric | Xcel Energy Inc. (XEL) | Oklo Inc. (OKLO) |
|---|---|---|
| Market Risk | Low beta (0.47) indicates low volatility, stable utility sector | Moderate beta (0.77), higher volatility reflecting emerging tech in nuclear energy |
| Debt level | High debt-to-equity (1.55), interest coverage moderate (2.3) | Very low debt (0.01), excellent debt-to-assets (0.46%) |
| Regulatory Risk | Moderate, due to regulated electric utility environment across multiple states | High, given nuclear energy regulations and regulatory approvals required |
| Operational Risk | Diverse energy sources, potential complexity in management | High, early-stage technology and limited operational history |
| Environmental Risk | Exposure to fossil fuels but increasing renewable investments | Potentially lower emissions but nuclear waste and safety concerns |
| Geopolitical Risk | Low, mainly US operations | Moderate, limited to US but nuclear policies sensitive to political shifts |
Synthesis: Xcel Energy faces notable debt and operational complexity risks but benefits from stable market positioning and dividend yield. Oklo carries higher regulatory and operational risks due to its innovative nuclear technology and early development stage, despite low financial leverage. Market volatility and regulatory environment are the most impactful risks for both companies. Investors should weigh XEL’s financial leverage against OKLO’s nascent technology risks carefully.
Which Stock to Choose?
Xcel Energy Inc. (XEL) shows a generally favorable income evolution with a 16.61% revenue growth over 2020-2024 and strong profitability metrics, including a 14.4% net margin. Its financial ratios reveal some weaknesses, such as a low current ratio (0.67) and moderate debt levels (debt to equity 1.55), resulting in a slightly unfavorable global ratios assessment. The company’s rating is very favorable (C+), though some valuation ratios are neutral or unfavorable.
Oklo Inc. (OKLO) exhibits an unfavorable income statement with zero revenue growth and negative profitability indicators, including a -29.35% ROE. Its financial ratios are mixed, with favorable debt metrics and a high current ratio (43.47) but several unfavorable operational ratios. The overall ratios evaluation is unfavorable, yet its rating remains very favorable (C+), driven by strong debt scores but offset by weak profitability and valuation metrics.
Considering the ratings and the comprehensive analysis of income statements and financial ratios, Xcel Energy may appear more stable with improving profitability despite some leverage concerns. Conversely, Oklo shows significant operational and profitability challenges but strong balance sheet metrics. Investors with a risk-averse or quality-focused profile might find Xcel Energy’s financial profile more aligned with their preferences, whereas risk-tolerant or growth-oriented investors could interpret Oklo’s high volatility and potential for turnaround differently.
Disclaimer: Investment carries a risk of loss of initial capital. The past performance is not a reliable indicator of future results. Be sure to understand risks before making an investment decision.
Go Further
I encourage you to read the complete analyses of Xcel Energy Inc. and Oklo Inc. to enhance your investment decisions: