Investors seeking opportunities in the regulated electric sector must consider both established players and innovative newcomers. WEC Energy Group, Inc. is a seasoned utility giant with a diversified energy portfolio and extensive infrastructure, while Oklo Inc. is a rising star focused on advanced fission power and nuclear fuel recycling. This comparison explores their market positions and innovation strategies to help you identify the most compelling investment for your portfolio.
Table of contents
Companies Overview
I will begin the comparison between WEC Energy Group, Inc. and Oklo Inc. by providing an overview of these two companies and their main differences.
WEC Energy Group Overview
WEC Energy Group, Inc. operates in the regulated electric industry, providing natural gas, electricity, and renewable energy services across the United States. The company manages extensive infrastructure, including over 35,800 miles of overhead distribution lines and 50,900 miles of natural gas mains. Headquartered in Milwaukee, Wisconsin, WEC focuses on delivering energy from diverse sources such as coal, natural gas, hydroelectric, wind, and solar.
Oklo Overview
Oklo Inc. designs and develops fission power plants to supply reliable, commercial-scale energy in the U.S. The company also offers used nuclear fuel recycling services. Founded in 2013 and headquartered in Santa Clara, California, Oklo is a smaller entity with a specialized focus on nuclear power innovation within the utilities sector, employing around 120 full-time staff.
Key similarities and differences
Both WEC and Oklo operate within the regulated electric utilities sector in the United States. WEC has a broad energy portfolio covering traditional and renewable sources with large-scale infrastructure, while Oklo specializes in advanced nuclear technology and fuel recycling with a more focused business model. WEC’s operations are well-established and extensive, contrasting with Oklo’s innovative and emerging position in the market.
Income Statement Comparison
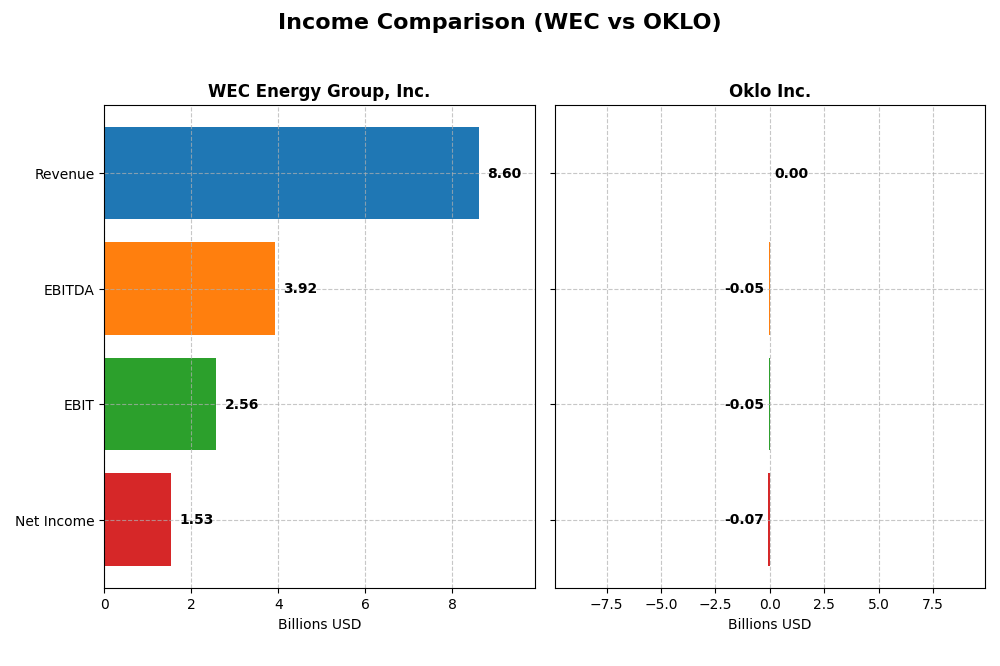
This table presents a side-by-side comparison of key income statement metrics for WEC Energy Group, Inc. and Oklo Inc. for the fiscal year 2024.
| Metric | WEC Energy Group, Inc. | Oklo Inc. |
|---|---|---|
| Market Cap | 33.5B | 16.5B |
| Revenue | 8.6B | 0 |
| EBITDA | 3.9B | -53M |
| EBIT | 2.6B | -53M |
| Net Income | 1.5B | -74M |
| EPS | 4.81 | -0.74 |
| Fiscal Year | 2024 | 2024 |
Income Statement Interpretations
WEC Energy Group, Inc.
WEC Energy Group exhibited steady revenue growth of 18.76% over 2020-2024, despite a 3.3% decline in 2024. Net income grew favorably by 27.25% overall, with a notable 18.58% net margin increase in the latest year. Margins remain strong, with a gross margin of 44.02% and EBIT margin close to 30%, highlighting operational efficiency in 2024.
Oklo Inc.
Oklo Inc. reported zero revenue throughout the period from 2021 to 2024, reflecting its developmental stage. The company consistently posted net losses, with net income declining sharply by over 1300% overall. Margins are unfavorable due to the absence of revenue and ongoing R&D and administrative expenses, resulting in a negative EBIT margin and a 59.38% EPS decrease in 2024.
Which one has the stronger fundamentals?
WEC Energy Group demonstrates stronger fundamentals with consistent revenue and net income growth, favorable margins, and positive earnings per share progression. In contrast, Oklo Inc. shows unfavorable income statement metrics, zero revenue, and significant net losses, reflecting its early-stage status. The disparity underscores WEC’s more stable and mature financial position.
Financial Ratios Comparison
The table below presents a side-by-side comparison of key financial ratios for WEC Energy Group, Inc. and Oklo Inc. based on their most recent fiscal year data (2024).
| Ratios | WEC Energy Group, Inc. | Oklo Inc. |
|---|---|---|
| ROE | 12.3% | -29.3% |
| ROIC | 4.14% | -19.2% |
| P/E | 19.5 | -28.5 |
| P/B | 2.39 | 8.37 |
| Current Ratio | 0.60 | 43.47 |
| Quick Ratio | 0.43 | 43.47 |
| D/E (Debt-to-Equity) | 1.64 | 0.005 |
| Debt-to-Assets | 42.9% | 0.46% |
| Interest Coverage | 2.64 | 0 |
| Asset Turnover | 0.18 | 0 |
| Fixed Asset Turnover | 0.25 | 0 |
| Payout ratio | 69.1% | 0 |
| Dividend yield | 3.55% | 0 |
Interpretation of the Ratios
WEC Energy Group, Inc.
WEC Energy Group shows mixed financial ratios with favorable net margin at 17.77% and a solid dividend yield of 3.55%. However, its return on invested capital at 4.14% and liquidity ratios like current ratio (0.6) are weak, indicating some operational concerns. The company maintains steady dividends supported by cash flow, but leverage and asset turnover metrics warrant caution.
Oklo Inc.
Oklo Inc. exhibits predominantly unfavorable ratios, including negative return on equity (-29.35%) and return on invested capital (-19.23%), reflecting ongoing losses and growth challenges. Its high current ratio (43.47) is flagged as unfavorable possibly due to balance sheet structure. Oklo does not pay dividends, focusing on reinvestment and development in its early stage with no shareholder returns currently.
Which one has the best ratios?
WEC Energy Group presents a slightly unfavorable but more balanced ratio profile with profitable margins and dividend payments, whereas Oklo suffers from significant negative returns and lack of dividends, reflecting its developmental phase. Overall, WEC demonstrates stronger financial health indicators compared to Oklo’s unfavorable metrics.
Strategic Positioning
This section compares the strategic positioning of WEC Energy Group and Oklo Inc., focusing on market position, key segments, and exposure to technological disruption:
WEC
- Large regulated electric utility with strong presence in multiple states, facing moderate competition.
- Operates diversified segments including Wisconsin, Illinois, Other States, and Non-Utility Energy Infrastructure.
- Exposure to traditional energy sources and renewable energy infrastructure, moderate risk from energy transition.
OKLO
- Smaller, specialized company designing fission power plants, competing in nuclear energy innovation.
- Focused solely on fission power plant design and nuclear fuel recycling services in the US market.
- High exposure to nuclear technology disruption, pioneering in commercial-scale fission power plants.
WEC vs OKLO Positioning
WEC employs a diversified geographic and segment strategy across regulated electric and non-utility energy, providing stable revenues but exposure to legacy energy risks. Oklo concentrates on innovative nuclear technology, offering growth potential but higher technological and market risks.
Which has the best competitive advantage?
Both companies are currently shedding value relative to their cost of capital. WEC shows a slightly unfavorable moat with growing profitability, whereas Oklo faces a very unfavorable moat with declining returns, indicating WEC has a comparatively stronger competitive advantage.
Stock Comparison
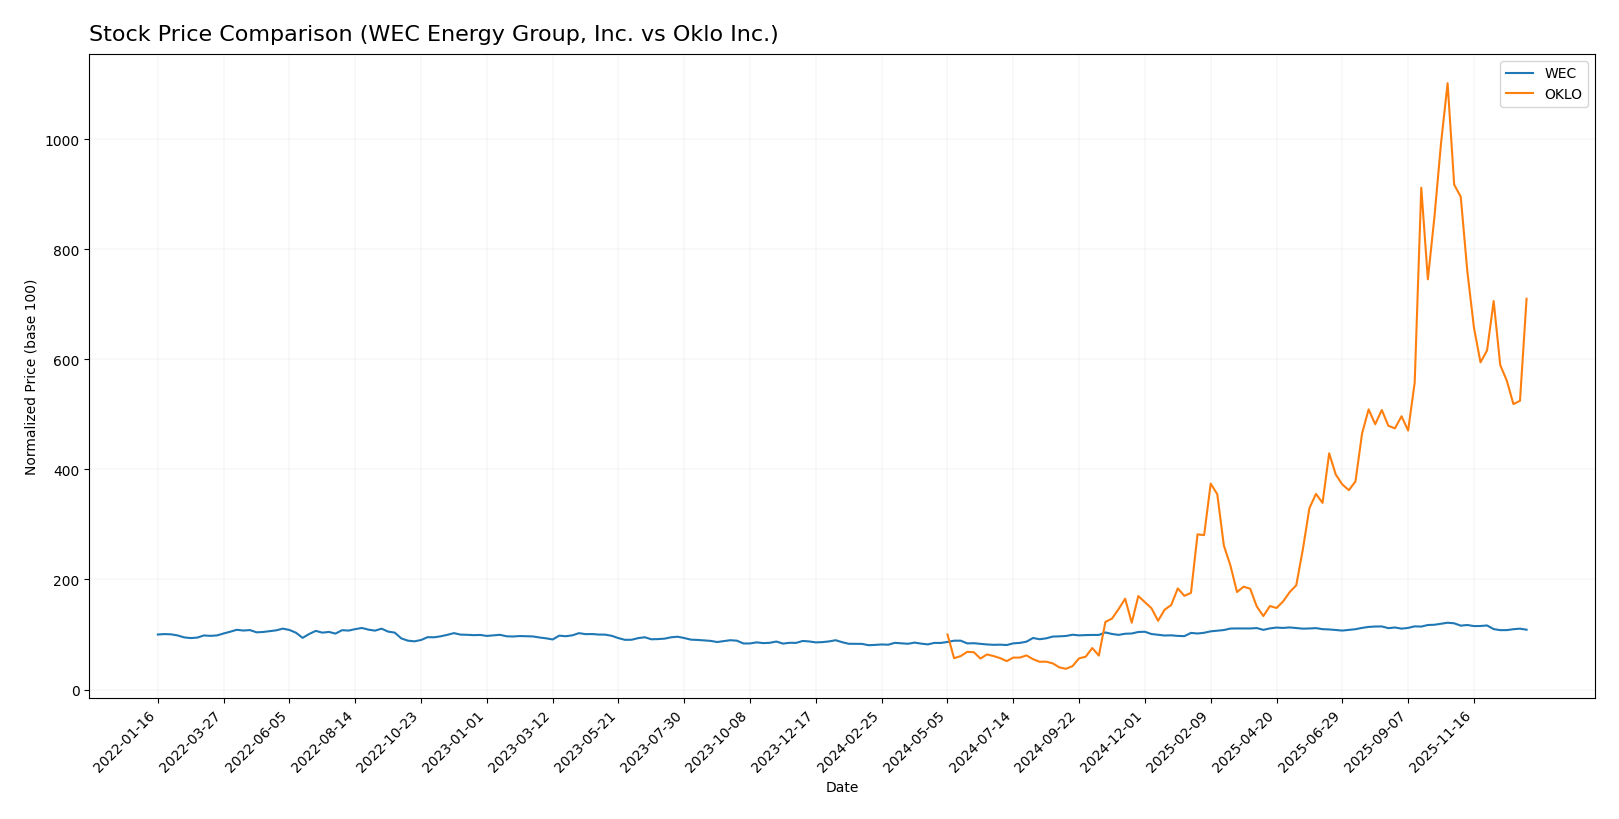
The stock price chart over the past year highlights significant bullish trends for both WEC Energy Group, Inc. and Oklo Inc., with notable overall gains followed by recent downward adjustments in trading activity.
Trend Analysis
WEC Energy Group, Inc. experienced a bullish trend with a 34.05% price increase over the past 12 months, though recent months show a 9.65% decline indicating a deceleration phase.
Oklo Inc. recorded a strong bullish trend with a 610.11% price increase over the past year, followed by a sharper 22.59% recent price drop, reflecting higher volatility and decelerating momentum.
Comparing both, Oklo Inc. delivered the highest market performance with a substantially larger overall price gain, despite both stocks facing recent downward pressure.
Target Prices
The current analyst consensus shows promising upside potential for both WEC Energy Group, Inc. and Oklo Inc.
| Company | Target High | Target Low | Consensus |
|---|---|---|---|
| WEC Energy Group, Inc. | 136 | 105 | 122.67 |
| Oklo Inc. | 150 | 95 | 125.67 |
Analysts expect WEC’s stock to rise moderately above the current price of 104.65 USD, while Oklo shows a wider range but also a consensus above its current 105.31 USD price. This suggests generally positive outlooks with some volatility for Oklo.
Analyst Opinions Comparison
This section compares analysts’ ratings and grades for WEC Energy Group, Inc. and Oklo Inc.:
Rating Comparison
WEC Rating
- Rating: B-, considered Very Favorable overall.
- Discounted Cash Flow Score: 1, rated Very Unfavorable for valuation.
- ROE Score: 4, rated Favorable for efficient profit generation.
- ROA Score: 4, rated Favorable for asset utilization.
- Debt To Equity Score: 2, rated Moderate financial risk.
- Overall Score: 3, rated Moderate overall financial standing.
OKLO Rating
- Rating: C+, considered Very Favorable overall.
- Discounted Cash Flow Score: 3, rated Moderate for valuation.
- ROE Score: 1, rated Very Unfavorable for profit efficiency.
- ROA Score: 1, rated Very Unfavorable for asset utilization.
- Debt To Equity Score: 5, rated Very Favorable for low financial risk.
- Overall Score: 2, rated Moderate overall financial standing.
Which one is the best rated?
Based on the provided data, WEC holds a higher overall rating (B-) and scores better in ROE and ROA, indicating stronger profitability and asset use. Oklo has a better debt-to-equity score but a lower overall rating (C+).
Scores Comparison
The comparison of WEC and OKLO scores provides insight into their financial health and risk levels:
WEC Scores
- Altman Z-Score: 1.14 in distress zone, indicating high bankruptcy risk.
- Piotroski Score: 6, rated average financial strength.
OKLO Scores
- Altman Z-Score: 339.43 in safe zone, indicating very low bankruptcy risk.
- Piotroski Score: 2, rated very weak financial strength.
Which company has the best scores?
OKLO has a significantly higher Altman Z-Score indicating a very low bankruptcy risk, but a much weaker Piotroski Score. WEC shows moderate financial strength but is in distress zone for bankruptcy risk.
Grades Comparison
Here is the detailed grades comparison for WEC Energy Group, Inc. and Oklo Inc.:
WEC Energy Group, Inc. Grades
The following table summarizes recent grades from reliable grading companies for WEC Energy Group, Inc.:
| Grading Company | Action | New Grade | Date |
|---|---|---|---|
| B of A Securities | Maintain | Neutral | 2025-12-31 |
| UBS | Maintain | Neutral | 2025-12-17 |
| Barclays | Maintain | Underweight | 2025-12-16 |
| Keybanc | Maintain | Overweight | 2025-12-12 |
| JP Morgan | Maintain | Neutral | 2025-12-11 |
| Scotiabank | Maintain | Sector Outperform | 2025-10-31 |
| BMO Capital | Maintain | Market Perform | 2025-10-21 |
| Barclays | Maintain | Equal Weight | 2025-10-21 |
| Keybanc | Maintain | Overweight | 2025-10-15 |
| UBS | Maintain | Neutral | 2025-10-10 |
WEC’s grades show a predominance of neutral and hold ratings with occasional overweight and sector outperform views, indicating a generally cautious but stable outlook.
Oklo Inc. Grades
The following table shows recent grades from reliable grading companies for Oklo Inc.:
| Grading Company | Action | New Grade | Date |
|---|---|---|---|
| Seaport Global | Upgrade | Buy | 2025-12-08 |
| UBS | Maintain | Neutral | 2025-12-03 |
| B of A Securities | Maintain | Neutral | 2025-11-12 |
| B. Riley Securities | Maintain | Buy | 2025-11-12 |
| Wedbush | Maintain | Outperform | 2025-11-12 |
| B of A Securities | Downgrade | Neutral | 2025-09-30 |
| Seaport Global | Downgrade | Neutral | 2025-09-23 |
| Wedbush | Maintain | Outperform | 2025-09-22 |
| Wedbush | Maintain | Outperform | 2025-08-14 |
| Wedbush | Maintain | Outperform | 2025-08-12 |
Oklo’s grades reflect a generally positive sentiment with multiple buy and outperform ratings, though some recent downgrades to neutral suggest mixed signals.
Which company has the best grades?
Oklo Inc. has received generally more favorable grades, including several buy and outperform ratings, compared to WEC Energy Group, which mostly has neutral and hold grades. This difference may influence investors seeking higher growth potential versus stability.
Strengths and Weaknesses
Below is a comparative table highlighting key strengths and weaknesses of WEC Energy Group, Inc. and Oklo Inc. based on the most recent financial and operational data available.
| Criterion | WEC Energy Group, Inc. | Oklo Inc. |
|---|---|---|
| Diversification | Moderate diversification across states and energy infrastructure segments, with significant revenue from Wisconsin (6.3B in 2024) and Illinois (1.6B in 2024) | Limited diversification as a smaller, specialized company focusing on innovative energy |
| Profitability | Moderate profitability with net margin of 17.77% and ROE at 12.3%, but ROIC at 4.14% below WACC (5.3%) indicating slight value destruction | Negative profitability with net margin at 0% and ROE at -29.35%, ROIC deeply negative (-19.23%) indicating value destruction |
| Innovation | Traditional energy utility with some infrastructure investments but limited breakthrough innovation | High innovation potential in advanced energy technology, though currently unprofitable and with declining ROIC |
| Global presence | Regional U.S. presence focused mainly on Midwest states; no significant global operations | No global presence; early-stage company focused on U.S. market and technology development |
| Market Share | Strong regional market share in Wisconsin and Illinois utilities | Very small market share as a startup in a niche energy segment |
In summary, WEC Energy Group shows stable regional revenues and moderate profitability but faces challenges in efficient capital use, while Oklo Inc. is an innovative but financially unproven company with significant losses and declining profitability trends. Investors should weigh WEC’s relative stability against Oklo’s high risk and speculative growth potential.
Risk Analysis
Below is a comparative overview of key risks for WEC Energy Group, Inc. and Oklo Inc. as of 2026:
| Metric | WEC Energy Group, Inc. | Oklo Inc. |
|---|---|---|
| Market Risk | Moderate (Beta 0.57) | Moderate (Beta 0.77) |
| Debt level | Elevated (D/E 1.64, 43% assets) | Very low (D/E 0.01, 0.46% assets) |
| Regulatory Risk | Medium (regulated utility) | High (nuclear power sector) |
| Operational Risk | Moderate (diverse sources) | High (emerging tech, nuclear) |
| Environmental Risk | Moderate (coal, gas, renewables mix) | Elevated (nuclear fuel cycle) |
| Geopolitical Risk | Low (domestic US focus) | Low (domestic US focus) |
WEC’s most impactful risks stem from elevated debt and moderate operational complexity with legacy energy sources, despite stable market risk and dividend yield. Oklo faces higher regulatory and operational risks typical of nuclear startups, compounded by weak profitability and financial metrics, though its low leverage reduces bankruptcy risk. Investors should weigh WEC’s financial distress signals against Oklo’s early-stage volatility and innovation risk.
Which Stock to Choose?
WEC Energy Group, Inc. shows a favorable income statement with strong margins and profit growth, but a slight decline in revenue last year. Its financial ratios reveal mixed signals: a high debt level and weak liquidity contrast with decent profitability and a moderate rating of B-. The company is shedding value as ROIC stays below WACC despite a rising trend in profitability.
Oklo Inc. presents an unfavorable income profile marked by negative margins and significant net income decline. Financial ratios mostly indicate weakness, though low debt levels stand out positively. Its rating of C+ reflects challenges in profitability and asset efficiency. Oklo is destroying value with a sharply declining ROIC over recent years.
Considering these assessments, WEC may appear more favorable for investors prioritizing income stability and profitability, while Oklo might attract those with a higher risk tolerance seeking growth potential despite financial weaknesses. The choice could depend on whether the investor values stable cash flow and moderate risk or is willing to accept volatility for possible expansion gains.
Disclaimer: Investment carries a risk of loss of initial capital. The past performance is not a reliable indicator of future results. Be sure to understand risks before making an investment decision.
Go Further
I encourage you to read the complete analyses of WEC Energy Group, Inc. and Oklo Inc. to enhance your investment decisions: