In the dynamic utilities sector, Public Service Enterprise Group Incorporated (PEG) and Oklo Inc. (OKLO) stand out as key players with distinct approaches to energy. PEG, a veteran in regulated electric services, focuses on traditional power distribution and renewable projects in the Northeastern U.S. Meanwhile, Oklo brings innovation with advanced fission power technology and nuclear fuel recycling. This article will explore which company offers the most compelling opportunity for investors seeking growth and stability.
Table of contents
Companies Overview
I will begin the comparison between Public Service Enterprise Group Incorporated and Oklo Inc. by providing an overview of these two companies and their main differences.
Public Service Enterprise Group Incorporated Overview
Public Service Enterprise Group Incorporated operates primarily in the Northeastern and Mid-Atlantic United States as an energy company. Its two main segments, PSE&G and PSEG Power, handle electricity transmission, distribution of electricity and gas, solar generation projects, energy efficiency programs, and appliance services. The company maintains extensive infrastructure, including 25,000 circuit miles of electric transmission and distribution and 18,000 miles of gas mains.
Oklo Inc. Overview
Oklo Inc. is a designer and developer of fission power plants aimed at delivering reliable, commercial-scale energy in the United States. Founded in 2013 and based in Santa Clara, California, the company also offers used nuclear fuel recycling services. Oklo operates with a smaller workforce and a focus on advanced nuclear technology, reflecting a more specialized and emerging segment within the regulated electric utility sector.
Key similarities and differences
Both companies operate in the regulated electric utility sector in the US, but they differ significantly in scale and technology focus. Public Service Enterprise Group is a large, established utility with extensive transmission and distribution infrastructure and diversified energy services. Oklo, meanwhile, is a smaller, newer company specializing in nuclear fission technology and fuel recycling, representing innovation within the energy industry beyond traditional electricity and gas distribution.
Income Statement Comparison
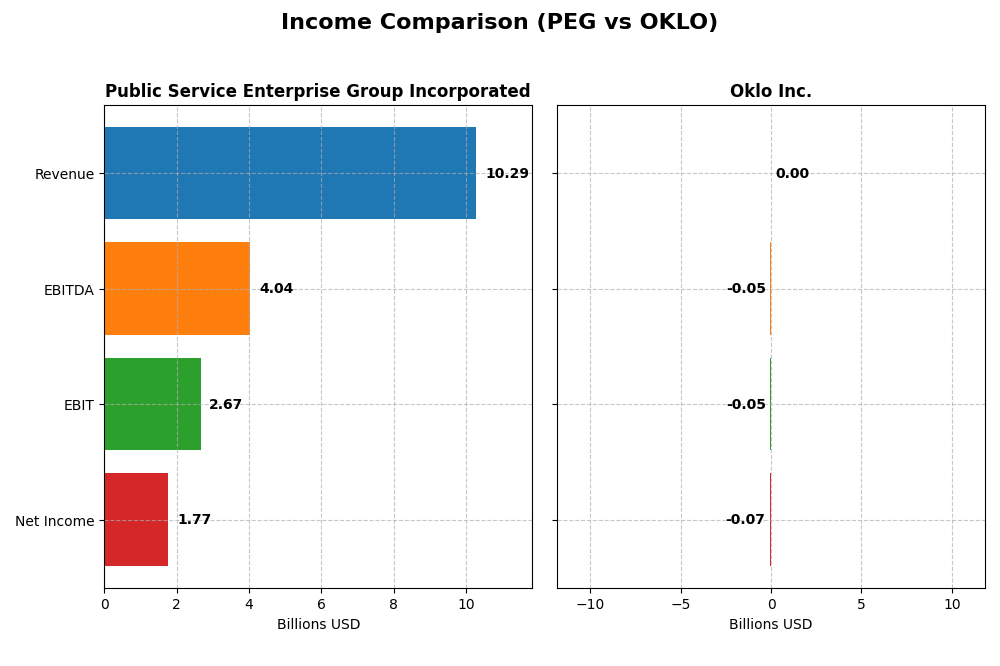
The table below compares key income statement metrics for Public Service Enterprise Group Incorporated and Oklo Inc. for the fiscal year 2024, highlighting their financial performance in USD.
| Metric | Public Service Enterprise Group Incorporated (PEG) | Oklo Inc. (OKLO) |
|---|---|---|
| Market Cap | 39.3B | 16.5B |
| Revenue | 10.3B | 0 |
| EBITDA | 4.0B | -52.5M |
| EBIT | 2.7B | -52.8M |
| Net Income | 1.8B | -73.6M |
| EPS | 3.56 | -0.7443 |
| Fiscal Year | 2024 | 2024 |
Income Statement Interpretations
Public Service Enterprise Group Incorporated
From 2020 to 2024, PEG’s revenue generally increased, peaking at $11.2B in 2023 before declining 8.4% to $10.3B in 2024. Net income followed a volatile pattern, hitting a low negative in 2021, then rising to $2.56B in 2023, but falling to $1.77B in 2024. Margins remained favorable overall, though the latest year showed declines in growth and profitability metrics.
Oklo Inc.
Oklo reported zero revenue from 2021 through 2024, reflecting its developmental stage. Net losses widened substantially from -$5.16M in 2021 to -$73.6M in 2024, with operating expenses increasing accordingly. Margins are unfavorable as the company has yet to generate gross profit or positive earnings, and recent years have seen a steep decline in earnings per share and net income.
Which one has the stronger fundamentals?
PEG demonstrates stronger fundamentals with significant revenues and positive net income, despite a recent downturn in growth and margins. Oklo remains in a loss-making phase with no revenue and escalating expenses. Both have unfavorable overall income statement evaluations, but PEG’s scale and profitability metrics position it with relatively more robust financial footing.
Financial Ratios Comparison
This table presents a side-by-side comparison of key financial ratios for Public Service Enterprise Group Incorporated (PEG) and Oklo Inc. (OKLO) based on their most recent fiscal year data from 2024.
| Ratios | Public Service Enterprise Group Incorporated (PEG) | Oklo Inc. (OKLO) |
|---|---|---|
| ROE | 11.0% | -29.3% |
| ROIC | 4.4% | -19.2% |
| P/E | 23.7 | -28.5 |
| P/B | 2.61 | 8.37 |
| Current Ratio | 0.65 | 43.5 |
| Quick Ratio | 0.48 | 43.5 |
| D/E (Debt-to-Equity) | 1.42 | 0.005 |
| Debt-to-Assets | 41.9% | 0.5% |
| Interest Coverage | 2.80 | 0 |
| Asset Turnover | 0.19 | 0 |
| Fixed Asset Turnover | 0.26 | 0 |
| Payout Ratio | 67.5% | 0 |
| Dividend Yield | 2.84% | 0 |
Interpretation of the Ratios
Public Service Enterprise Group Incorporated
Public Service Enterprise Group (PEG) shows a mix of strengths and weaknesses in its 2024 financial ratios. It has a favorable net margin of 17.22% and a dividend yield of 2.84%, reflecting steady shareholder returns. However, its liquidity ratios (current ratio 0.65, quick ratio 0.48) and asset turnover metrics are unfavorable, indicating potential operational efficiency and short-term liquidity concerns. PEG pays dividends supported by a consistent payout.
Oklo Inc.
Oklo Inc. (OKLO) exhibits predominantly unfavorable ratios in 2024, with negative returns on equity (-29.35%) and invested capital (-19.23%), reflecting operational losses and inefficiencies. Its current ratio is extremely high at 43.47 but deemed unfavorable, possibly signaling excess liquidity or asset management issues. OKLO does not pay dividends, likely due to its negative earnings and focus on growth and innovation in nuclear power development.
Which one has the best ratios?
Comparing the two, Public Service Enterprise Group has a more balanced ratio profile with some favorable profitability and dividend metrics despite liquidity and efficiency weaknesses. Oklo’s ratios are mostly unfavorable with significant losses and no dividend returns, reflecting a higher risk profile. PEG’s global ratios opinion is slightly unfavorable, whereas OKLO’s is unfavorable, indicating PEG has relatively stronger financial health.
Strategic Positioning
This section compares the strategic positioning of PEG and OKLO, including market position, key segments, and exposure to technological disruption:
Public Service Enterprise Group Incorporated (PEG)
- Large market cap of 39B; operates primarily in Northeastern and Mid-Atlantic U.S. under regulated electric utilities with stable demand.
- Diverse segments including electric transmission, gas distribution, solar projects, and appliance services drive revenue streams.
- Operates in a traditional regulated electric sector with incremental solar investments; limited direct exposure to rapid tech disruption.
Oklo Inc. (OKLO)
- Smaller market cap of 16B; focused on innovative fission power plant designs targeting U.S. commercial-scale energy customers.
- Concentrated business model centered on nuclear power plant design and used nuclear fuel recycling services.
- Highly exposed to technological disruption through advanced nuclear technology development and recycling innovations.
PEG vs OKLO Positioning
PEG’s diversified business across regulated electric and gas services offers stable, broad-based revenue, while OKLO’s concentrated focus on nuclear innovation targets emerging energy markets with higher technological risk and potential rewards.
Which has the best competitive advantage?
PEG shows a slightly unfavorable moat with growing profitability but still sheds value, indicating moderate competitive durability. OKLO has a very unfavorable moat with declining profitability, reflecting challenges in sustaining competitive advantage in its technology-driven niche.
Stock Comparison
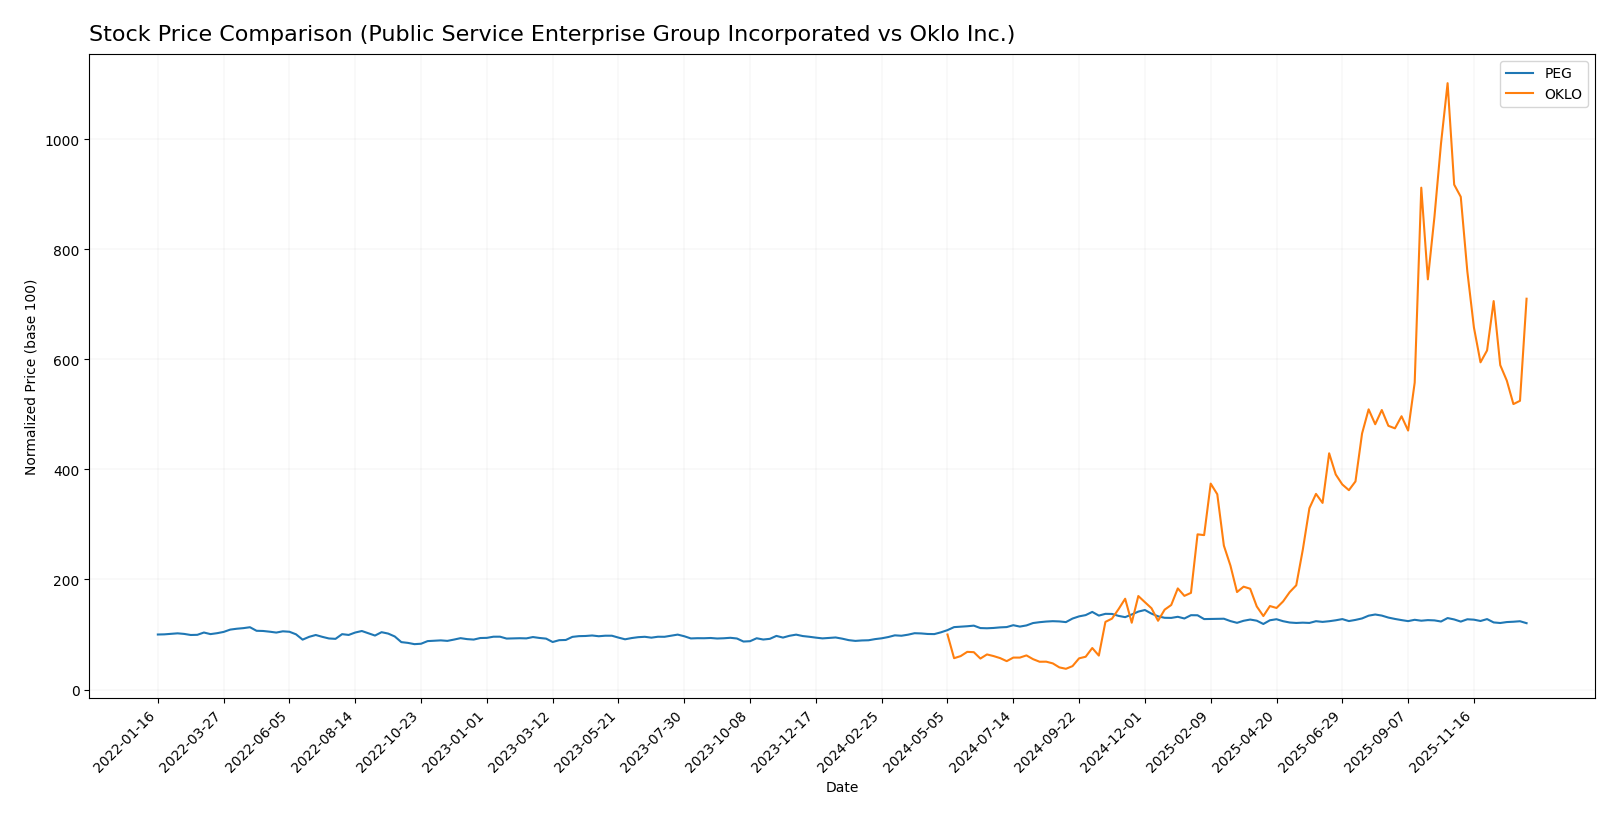
The stock prices of Public Service Enterprise Group Incorporated (PEG) and Oklo Inc. (OKLO) exhibited significant upward momentum over the past year, with both showing bullish trends but recent months revealing a downward correction phase.
Trend Analysis
Public Service Enterprise Group Incorporated’s stock price increased by 31.59% over the past 12 months, reflecting a bullish trend with decelerating momentum. The price ranged between 59.79 and 94.3, with recent weeks showing a mild decline of 5.33%.
Oklo Inc. experienced a substantial 610.11% gain over the past year, also bullish with deceleration. Its price fluctuated widely from 5.59 to 163.39. However, recent months saw a sharper drop of 22.59%, accompanied by higher volatility.
Comparing both, Oklo Inc. delivered the highest market performance with a remarkable 610.11% gain, significantly outperforming Public Service Enterprise Group Incorporated’s 31.59% increase.
Target Prices
The target price consensus for these utilities stocks indicates moderate to strong upside potential based on analyst evaluations.
| Company | Target High | Target Low | Consensus |
|---|---|---|---|
| Public Service Enterprise Group Incorporated | 98 | 83 | 89 |
| Oklo Inc. | 150 | 95 | 125.67 |
Analysts expect Public Service Enterprise Group’s stock to trade modestly above its current 78.68 USD price, while Oklo Inc. shows significant upside potential versus its 105.31 USD price.
Analyst Opinions Comparison
This section compares analysts’ ratings and financial scores for Public Service Enterprise Group Incorporated (PEG) and Oklo Inc. (OKLO):
Rating Comparison
PEG Rating
- Rating: B-, considered very favorable overall.
- Discounted Cash Flow Score: 1, very unfavorable.
- ROE Score: 4, favorable.
- ROA Score: 4, favorable.
- Debt To Equity Score: 2, moderate.
- Overall Score: 3, moderate.
OKLO Rating
- Rating: C+, also considered very favorable overall.
- Discounted Cash Flow Score: 3, moderate.
- ROE Score: 1, very unfavorable.
- ROA Score: 1, very unfavorable.
- Debt To Equity Score: 5, very favorable.
- Overall Score: 2, moderate.
Which one is the best rated?
Based strictly on provided data, PEG holds a higher rating (B- vs. C+) and stronger profitability scores (ROE and ROA), while OKLO scores better on debt-to-equity, indicating lower financial risk but weaker returns. PEG is better rated overall.
Scores Comparison
Here is a comparison of the Altman Z-Score and Piotroski Score for both companies:
PEG Scores
- Altman Z-Score: 1.32, indicating financial distress and high bankruptcy risk.
- Piotroski Score: 7, showing strong financial health.
OKLO Scores
- Altman Z-Score: 339.43, indicating very safe financial condition.
- Piotroski Score: 2, reflecting very weak financial strength.
Which company has the best scores?
OKLO has a significantly higher Altman Z-Score, placing it in the safe zone, while PEG is in financial distress. However, PEG’s Piotroski Score is much stronger than OKLO’s very weak score.
Grades Comparison
Here is a detailed comparison of the latest reliable grades assigned to Public Service Enterprise Group Incorporated and Oklo Inc.:
Public Service Enterprise Group Incorporated Grades
The following table lists recent grades from recognized grading companies for PEG:
| Grading Company | Action | New Grade | Date |
|---|---|---|---|
| Ladenburg Thalmann | Buy | Buy | 2026-01-07 |
| UBS | Maintain | Buy | 2025-12-17 |
| JP Morgan | Maintain | Overweight | 2025-12-12 |
| Jefferies | Upgrade | Buy | 2025-11-06 |
| TD Cowen | Maintain | Buy | 2025-11-05 |
| BMO Capital | Maintain | Market Perform | 2025-11-04 |
| Barclays | Maintain | Equal Weight | 2025-10-21 |
| BMO Capital | Maintain | Market Perform | 2025-10-20 |
| Morgan Stanley | Maintain | Overweight | 2025-09-25 |
| BMO Capital | Maintain | Market Perform | 2025-08-06 |
Overall, PEG’s grades show a positive trend with multiple upgrades to Buy and consistent Buy or Overweight ratings from major firms.
Oklo Inc. Grades
Recent reliable grades assigned to OKLO by established grading companies are summarized below:
| Grading Company | Action | New Grade | Date |
|---|---|---|---|
| Seaport Global | Upgrade | Buy | 2025-12-08 |
| UBS | Maintain | Neutral | 2025-12-03 |
| B of A Securities | Maintain | Neutral | 2025-11-12 |
| B. Riley Securities | Maintain | Buy | 2025-11-12 |
| Wedbush | Maintain | Outperform | 2025-11-12 |
| B of A Securities | Downgrade | Neutral | 2025-09-30 |
| Seaport Global | Downgrade | Neutral | 2025-09-23 |
| Wedbush | Maintain | Outperform | 2025-09-22 |
| Wedbush | Maintain | Outperform | 2025-08-14 |
| Wedbush | Maintain | Outperform | 2025-08-12 |
Grades for OKLO reflect mixed signals with upgrades to Buy but several downgrades to Neutral, alongside repeated Outperform ratings.
Which company has the best grades?
Public Service Enterprise Group Incorporated has received more consistent Buy and Overweight grades compared to Oklo Inc., which shows mixed Neutral and Outperform ratings. This consistency may influence investor confidence and risk assessment differently for each stock.
Strengths and Weaknesses
Below is a comparative table of key strengths and weaknesses for Public Service Enterprise Group Incorporated (PEG) and Oklo Inc. (OKLO) based on their latest financial and operational data.
| Criterion | Public Service Enterprise Group (PEG) | Oklo Inc. (OKLO) |
|---|---|---|
| Diversification | Strong revenue streams from Gas Distribution (2.06B), Electric & Gas operations (3.98B), and Transmission (1.75B) | Limited diversification; focused on emerging tech sector with no reported revenue segments yet |
| Profitability | Net margin 17.22% (favorable), ROE 11% (neutral), but ROIC 4.4% below WACC 5.37% (unfavorable) | Negative net margin (0%), ROE -29.35%, ROIC -19.23%, indicating ongoing losses |
| Innovation | Moderate; traditional utility with incremental improvements | High risk, high potential innovation in nuclear tech, but financials show value destruction |
| Global presence | Primarily US-focused utility operations | Early stage, no global footprint reported |
| Market Share | Established leader in regional utility markets with stable contracts | Nascent player without measurable market share |
Key takeaways: PEG shows stable cash flows and diversified utility operations but struggles with efficient capital returns, reflecting a slightly unfavorable moat. OKLO, as an early-stage innovative company, faces significant financial hurdles with deep losses and shrinking returns, marking a very unfavorable investment profile at present. Investors should weigh PEG’s stability against OKLO’s high risk and potential future rewards.
Risk Analysis
Below is a comparative table of key risks for Public Service Enterprise Group Incorporated (PEG) and Oklo Inc. (OKLO) based on the most recent data from 2024 and 2026 insights:
| Metric | Public Service Enterprise Group (PEG) | Oklo Inc. (OKLO) |
|---|---|---|
| Market Risk | Moderate (Beta 0.61, stable range) | Higher volatility (Beta 0.77, wide price range) |
| Debt level | High (D/E 1.42, 41.9% debt to assets) | Very low (D/E 0.01, 0.46% debt to assets) |
| Regulatory Risk | Moderate (regulated electric sector) | Elevated (nuclear energy regulations) |
| Operational Risk | Moderate (large infrastructure) | High (early stage nuclear technology) |
| Environmental Risk | Moderate (energy transition focus) | Elevated (nuclear fuel cycle and waste) |
| Geopolitical Risk | Low (US regional utility) | Moderate (nuclear energy sensitive to policy) |
PEG faces moderate market and operational risks typical of a regulated utility with significant infrastructure and debt load. OKLO, as a nuclear energy startup, carries higher regulatory, operational, and environmental risks due to the complexity and sensitivities around nuclear technology and waste management.
The most impactful risks are OKLO’s regulatory and operational challenges, which could affect its growth and cash flow stability. PEG’s financial distress risk is elevated, indicated by an Altman Z-Score in the distress zone (1.32), signaling caution despite stable dividends and moderate market risk. Investors should carefully weigh OKLO’s innovation potential against its financial weakness and PEG’s stable but leveraged position.
Which Stock to Choose?
Public Service Enterprise Group Incorporated (PEG) shows an unfavorable income evolution with declining revenue and net margin over recent years. Its financial ratios are slightly unfavorable, marked by weak liquidity and efficiency metrics, but it maintains moderate debt levels and a very favorable overall rating of B-. Despite shedding value, PEG’s profitability is on a gradual increase.
Oklo Inc. (OKLO) presents a severely unfavorable income profile, with zero revenue growth and significant losses. Its financial ratios are largely unfavorable, despite low debt and a strong current ratio. The company’s rating is also very favorable at C+, but its return on invested capital is sharply declining, indicating persistent value destruction and weak profitability.
Investors focused on stability and improving profitability might find PEG’s growing yet challenged financials more aligned with their profiles, whereas those with a higher risk tolerance and interest in early-stage growth might interpret OKLO’s situation differently due to its volatile but bullish price trend and very favorable rating. Overall, the choice could depend significantly on the investor’s risk appetite and strategy.
Disclaimer: Investment carries a risk of loss of initial capital. The past performance is not a reliable indicator of future results. Be sure to understand risks before making an investment decision.
Go Further
I encourage you to read the complete analyses of Public Service Enterprise Group Incorporated and Oklo Inc. to enhance your investment decisions: