Investors seeking opportunities in the regulated electric industry face a compelling choice between PPL Corporation and Oklo Inc. Both companies operate in the utilities sector but differ significantly in scale and innovation focus—PPL with its established electric and natural gas delivery, and Oklo pioneering advanced nuclear power technologies. This article will carefully analyze these players to help you identify which company aligns best with your investment goals.
Table of contents
Companies Overview
I will begin the comparison between PPL Corporation and Oklo Inc. by providing an overview of these two companies and their main differences.
PPL Corporation Overview
PPL Corporation operates as a utility holding company focused on delivering electricity and natural gas primarily in the United States and the United Kingdom. It manages regulated electric and gas segments with a customer base exceeding 2.7M across Kentucky, Pennsylvania, and Virginia. Founded in 1920, PPL maintains a diversified electricity generation portfolio including coal, gas, hydro, and solar sources, positioning itself as a long-established player in the regulated electric utility sector.
Oklo Inc. Overview
Oklo Inc. is a newer entrant in the utilities sector, specializing in designing and developing fission power plants to supply reliable, commercial-scale energy in the United States. Founded in 2013 and headquartered in Santa Clara, California, Oklo also offers used nuclear fuel recycling services. With a workforce of around 120 employees, Oklo represents an innovative approach within the regulated electric industry focused on nuclear energy technologies.
Key similarities and differences
Both PPL and Oklo operate within the regulated electric utilities sector in the US, serving energy needs with a focus on reliability. However, PPL is a large, diversified utility with a long history and extensive customer base, relying on multiple energy sources including fossil fuels and renewables. In contrast, Oklo is a smaller, newer company specializing in advanced nuclear power and fuel recycling, highlighting a distinct technological approach within the same industry landscape.
Income Statement Comparison
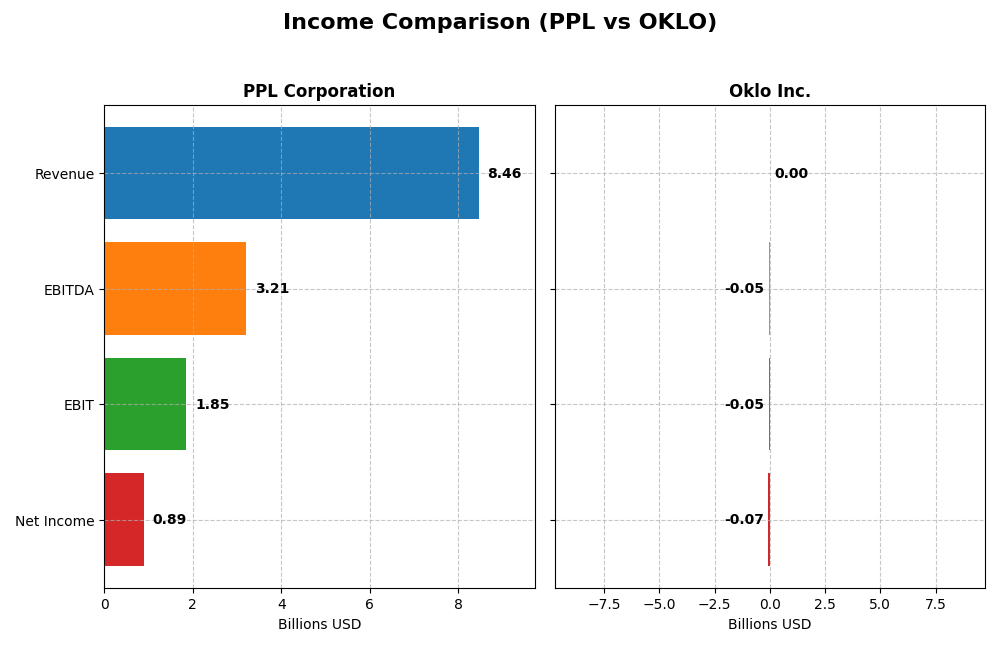
This table compares key income statement metrics for PPL Corporation and Oklo Inc. for the fiscal year 2024, reflecting their recent financial performance.
| Metric | PPL Corporation | Oklo Inc. |
|---|---|---|
| Market Cap | 25.6B | 16.5B |
| Revenue | 8.46B | 0 |
| EBITDA | 3.21B | -52.5M |
| EBIT | 1.85B | -52.8M |
| Net Income | 888M | -73.6M |
| EPS | 1.20 | -0.7443 |
| Fiscal Year | 2024 | 2024 |
Income Statement Interpretations
PPL Corporation
PPL Corporation experienced steady revenue growth of 54.6% from 2020 to 2024, with revenue reaching $8.46B in 2024. Net income showed volatility, declining overall by 39.6%, though it rebounded to $886M in 2024. Margins remained favorable, with a gross margin of 40.1% and net margin improving to 10.5%. The latest year saw moderate revenue growth slow to 1.8%, but EBIT and net margin expanded notably.
Oklo Inc.
Oklo Inc. reported no revenue from 2021 through 2024, reflecting its development-stage status. Net losses widened dramatically, with net income falling to -$74M in 2024 from -$32M in 2023, and margins stayed at zero. Operating expenses increased consistently, driven by R&D and administrative costs. The recent year’s EPS declined by 59.4%, with worsening EBIT and net margin, signaling ongoing investment without current profitability.
Which one has the stronger fundamentals?
PPL Corporation shows stronger fundamentals, benefiting from positive revenue growth, improving margins, and a favorable income statement trend despite some net income volatility. In contrast, Oklo Inc. faces significant losses, zero revenue, and unfavorable margin metrics typical of a pre-revenue company. The contrast highlights PPL’s relative stability and Oklo’s developmental financial profile.
Financial Ratios Comparison
The table below presents a side-by-side comparison of key financial ratios for PPL Corporation and Oklo Inc. based on their most recent fiscal year data available for 2024.
| Ratios | PPL Corporation (2024) | Oklo Inc. (2024) |
|---|---|---|
| ROE | 6.31% | -29.35% |
| ROIC | 3.59% | -19.23% |
| P/E | 26.97 | -28.52 |
| P/B | 1.70 | 8.37 |
| Current Ratio | 0.86 | 43.47 |
| Quick Ratio | 0.71 | 43.47 |
| D/E (Debt-to-Equity) | 1.19 | 0.005 |
| Debt-to-Assets | 40.92% | 0.46% |
| Interest Coverage | 2.36 | 0 |
| Asset Turnover | 0.21 | 0 |
| Fixed Asset Turnover | 0.26 | 0 |
| Payout ratio | 84.12% | 0 |
| Dividend yield | 3.12% | 0 |
Interpretation of the Ratios
PPL Corporation
PPL presents a mixed ratio profile with a favorable net margin of 10.49% and a dividend yield of 3.12%, indicating steady profitability and shareholder returns. However, weak returns on equity (6.31%) and invested capital, along with low liquidity ratios and high debt levels, raise concerns about operational efficiency and financial flexibility. Dividends appear sustainable given stable payout trends and coverage by cash flow.
Oklo Inc.
Oklo shows predominantly unfavorable profitability ratios, including a negative 29.35% return on equity and zero net margin, reflecting losses typical of an early-stage or high-growth firm. The company does not pay dividends, focusing instead on reinvestment and development, supported by very low leverage and a strong quick ratio. However, the extremely high current ratio may indicate inefficient asset use or working capital management issues.
Which one has the best ratios?
Both companies show an unfavorable overall ratio profile, but PPL’s stronger profitability and dividend yield contrast with Oklo’s negative returns and lack of dividends. PPL’s elevated leverage and liquidity weaknesses counterbalance its income strengths, while Oklo’s financial conservatism is offset by operational losses and efficiency concerns. Neither stands out decisively as having superior financial ratios.
Strategic Positioning
This section compares the strategic positioning of PPL Corporation and Oklo Inc., focusing on market position, key segments, and exposure to technological disruption:
PPL Corporation
- Established utility with regulated electric market in US and UK, facing moderate competitive pressure
- Revenue driven by Kentucky, Pennsylvania, and Rhode Island regulated electric segments
- Exposure to traditional energy sources with some solar and hydro; moderate disruption risk
Oklo Inc.
- Emerging energy company focused on fission power plants in the US, operating in a niche market
- Business centered on designing fission power plants and nuclear fuel recycling, limited diversification
- High exposure to technological disruption through nuclear innovation and recycling technologies
PPL Corporation vs Oklo Inc. Positioning
PPL operates a diversified utility business across multiple US states and the UK, benefiting from regulated markets but facing traditional energy challenges. Oklo concentrates on innovative nuclear technology, with a narrow focus but higher disruption potential.
Which has the best competitive advantage?
PPL’s moat is slightly unfavorable, shedding value but with improving profitability, while Oklo’s moat is very unfavorable with declining returns. PPL shows a more stable competitive position despite challenges in value creation.
Stock Comparison
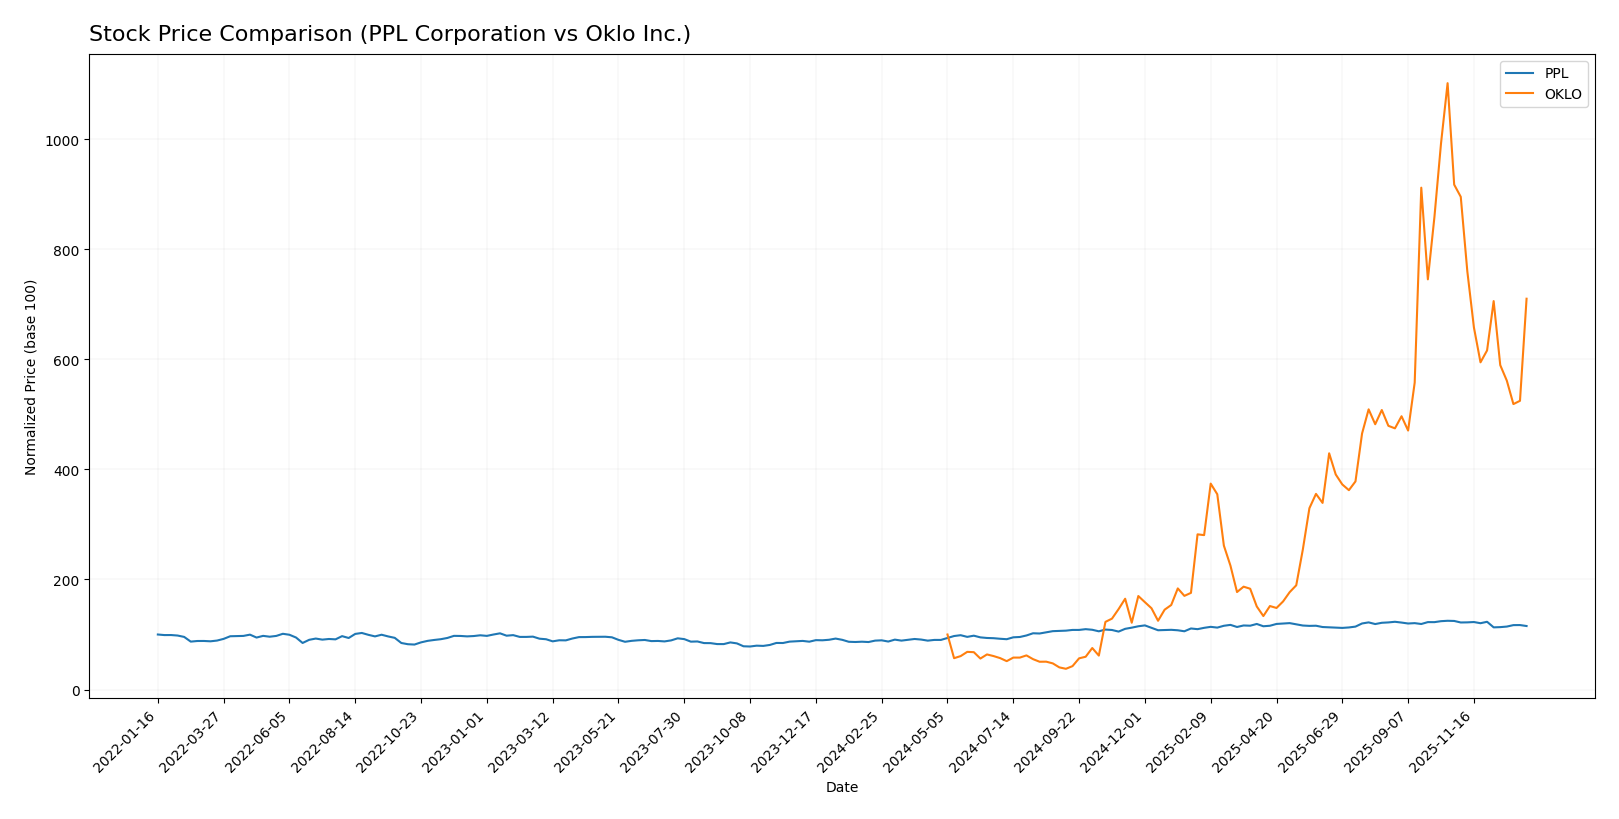
The stock price chart highlights significant bullish trends for both PPL Corporation and Oklo Inc. over the past 12 months, with notable price acceleration early in the period followed by recent deceleration and declining momentum.
Trend Analysis
PPL Corporation’s stock experienced a 29.84% increase over the past year, indicating a bullish trend with deceleration in price gains. The highest price reached 37.44, the lowest 26.14, and recent months showed a mild negative slope (-7.39%).
Oklo Inc. showed a strong bullish trend with a 610.11% rise over the last 12 months, also decelerating near the end. Its price ranged from 5.59 to 163.39, but the recent steep decline of 22.59% signals increased volatility and seller dominance.
Comparing the two, Oklo Inc. delivered substantially higher market performance with a 610.11% gain versus PPL’s 29.84%, despite both stocks showing deceleration and recent downward pressure.
Target Prices
Analysts present a clear consensus on target prices for PPL Corporation and Oklo Inc.
| Company | Target High | Target Low | Consensus |
|---|---|---|---|
| PPL Corporation | 45 | 36 | 41.29 |
| Oklo Inc. | 150 | 95 | 125.67 |
The consensus target prices indicate moderate upside potential for PPL, currently trading at $34.59, and strong growth expectations for Oklo, trading at $105.31, reflecting bullish analyst sentiment.
Analyst Opinions Comparison
This section compares analysts’ ratings and grades for PPL Corporation and Oklo Inc.:
Rating Comparison
PPL Rating
- Rating: C+ with a very favorable status
- Discounted Cash Flow Score: 1, very unfavorable
- ROE Score: 3, moderate
- ROA Score: 3, moderate
- Debt To Equity Score: 2, moderate
- Overall Score: 2, moderate
OKLO Rating
- Rating: C+ with a very favorable status
- Discounted Cash Flow Score: 3, moderate
- ROE Score: 1, very unfavorable
- ROA Score: 1, very unfavorable
- Debt To Equity Score: 5, very favorable
- Overall Score: 2, moderate
Which one is the best rated?
Both companies share the same overall rating of C+ and an overall score of 2, classified as moderate. PPL scores better on return metrics, while Oklo excels in debt-to-equity, showing strengths in different financial areas.
Scores Comparison
Here is a comparison of the Altman Z-Score and Piotroski Score for PPL Corporation and Oklo Inc.:
PPL Scores
- Altman Z-Score: 0.97, indicating financial distress zone with high bankruptcy risk.
- Piotroski Score: 6, reflecting average financial strength and investment potential.
OKLO Scores
- Altman Z-Score: 339.43, indicating a safe zone with very low bankruptcy risk.
- Piotroski Score: 2, reflecting very weak financial strength and poor investment potential.
Which company has the best scores?
Based on the provided data, Oklo has a much stronger Altman Z-Score placing it in the safe zone, while PPL is in the distress zone. Conversely, PPL’s Piotroski Score is average, outperforming Oklo’s very weak score.
Grades Comparison
Here is a comparison of recent grades assigned to PPL Corporation and Oklo Inc. by reputable grading companies:
PPL Corporation Grades
The following table summarizes PPL Corporation’s recent grades from top financial institutions:
| Grading Company | Action | New Grade | Date |
|---|---|---|---|
| UBS | maintain | Neutral | 2025-12-17 |
| Wells Fargo | maintain | Overweight | 2025-12-12 |
| JP Morgan | maintain | Overweight | 2025-12-11 |
| BMO Capital | maintain | Outperform | 2025-10-21 |
| B of A Securities | maintain | Buy | 2025-10-16 |
| Barclays | maintain | Equal Weight | 2025-10-14 |
| UBS | maintain | Neutral | 2025-10-10 |
| Morgan Stanley | maintain | Overweight | 2025-09-25 |
| Barclays | maintain | Equal Weight | 2025-07-01 |
| Morgan Stanley | maintain | Overweight | 2025-06-18 |
PPL Corporation consistently received positive ratings, mostly “Overweight,” “Outperform,” and “Buy,” indicating a generally favorable outlook.
Oklo Inc. Grades
Below is a summary of recent grades for Oklo Inc. from well-known grading firms:
| Grading Company | Action | New Grade | Date |
|---|---|---|---|
| Seaport Global | upgrade | Buy | 2025-12-08 |
| UBS | maintain | Neutral | 2025-12-03 |
| B of A Securities | maintain | Neutral | 2025-11-12 |
| B. Riley Securities | maintain | Buy | 2025-11-12 |
| Wedbush | maintain | Outperform | 2025-11-12 |
| B of A Securities | downgrade | Neutral | 2025-09-30 |
| Seaport Global | downgrade | Neutral | 2025-09-23 |
| Wedbush | maintain | Outperform | 2025-09-22 |
| Wedbush | maintain | Outperform | 2025-08-14 |
| Wedbush | maintain | Outperform | 2025-08-12 |
Oklo Inc.’s grades show some upgrades and downgrades but generally hold a “Neutral” to “Outperform” stance with fewer “Buy” ratings compared to PPL.
Which company has the best grades?
PPL Corporation holds a stronger consensus with 19 Buy ratings and multiple Overweight and Outperform grades, compared to Oklo’s 5 Buy ratings and more Neutral grades. This suggests PPL may currently enjoy a more consistent positive outlook, potentially implying steadier investor confidence.
Strengths and Weaknesses
Below is a comparative summary of the strengths and weaknesses of PPL Corporation and Oklo Inc. based on their latest financial and operational data.
| Criterion | PPL Corporation | Oklo Inc. |
|---|---|---|
| Diversification | Moderate; revenue mainly from regulated utilities in Kentucky, Pennsylvania, Rhode Island with some international exposure until 2020 | Limited; primarily focused on nuclear innovation, no reported revenue segmentation |
| Profitability | Moderate net margin at 10.49%, but ROIC (3.59%) below WACC (5.5%), indicating value destruction despite improving ROIC trend | Negative profitability; ROIC and net margin deeply negative, showing value destruction and declining profitability |
| Innovation | Traditional utility company with limited innovation indicators | High innovation potential in nuclear technology but currently unprofitable and financially risky |
| Global presence | Regional US focus with prior UK operations now exited | No significant global presence reported |
| Market Share | Strong regional presence in key US regulated markets | Emerging player, no significant market share yet |
PPL Corporation shows a stable but somewhat limited diversification with improving profitability trends, though it still destroys value overall. Oklo Inc. is highly innovative but faces significant financial challenges and negative profitability, making it a higher-risk investment at this stage.
Risk Analysis
Below is a comparison table highlighting key risks for PPL Corporation and Oklo Inc. based on the most recent data from 2024 and 2026 market context.
| Metric | PPL Corporation | Oklo Inc. |
|---|---|---|
| Market Risk | Moderate (Beta 0.716) | Moderate (Beta 0.773) |
| Debt Level | High (D/E 1.19) | Very Low (D/E 0.01) |
| Regulatory Risk | High (Utility sector, US & UK regulations) | High (Nuclear energy licensing and compliance) |
| Operational Risk | Moderate (Aging infrastructure, energy mix) | High (New nuclear tech development & scaling) |
| Environmental Risk | Moderate (Coal & gas generation impacts) | Moderate (Nuclear waste management) |
| Geopolitical Risk | Moderate (US/UK energy policies) | Moderate (US energy policy and public perception) |
The most impactful and likely risks are regulatory and operational. PPL faces challenges from aging assets and stringent regulations in two countries, while Oklo carries higher operational risk due to pioneering nuclear technology and associated regulatory hurdles. Both firms must navigate evolving energy policies and environmental considerations carefully.
Which Stock to Choose?
PPL Corporation shows a generally favorable income statement with a 10.49% net margin, though revenue growth is modest at 1.8% in the last year. Financial ratios reveal mixed signals: while dividend yield and tax burden are favorable, profitability ratios like ROE (6.31%) and ROIC (3.59%) are unfavorable, and leverage ratios indicate moderate debt levels. Its rating is very favorable (C+), but the Altman Z-Score of 0.97 signals financial distress risk.
Oklo Inc. presents an unfavorable income profile with zero gross and net margins and significant negative growth in earnings and net income over the period. Financial ratios largely show unfavorable profitability and efficiency metrics, despite very favorable debt ratios and a high current ratio. The company holds a very favorable rating (C+) overall, with a strong Altman Z-Score in the safe zone but a very weak Piotroski score of 2, indicating financial weakness.
Considering the ratings and financial evaluations, PPL could appear more stable with a favorable income statement and moderate profitability despite some financial distress signals, suggesting it might appeal to investors seeking quality and income. Conversely, Oklo’s volatile income and weak profitability, though backed by low debt, might be interpreted as more speculative and thus potentially suitable for risk-tolerant investors focused on growth opportunities.
Disclaimer: Investment carries a risk of loss of initial capital. The past performance is not a reliable indicator of future results. Be sure to understand risks before making an investment decision.
Go Further
I encourage you to read the complete analyses of PPL Corporation and Oklo Inc. to enhance your investment decisions: