In the evolving energy sector, Pacific Gas & Electric Co. (PCG) and Oklo Inc. (OKLO) stand out as key players in regulated electric utilities with distinct approaches. PCG, a century-old giant, combines traditional energy sources with innovative smart grid technology. In contrast, Oklo leverages cutting-edge nuclear fission to offer scalable clean energy solutions. This article explores their strategies and market positions to help you decide which company offers the best investment potential.

Table of contents
Companies Overview
I will begin the comparison between Pacific Gas & Electric Co. and Oklo Inc. by providing an overview of these two companies and their main differences.
Pacific Gas & Electric Co. Overview
Pacific Gas & Electric Co. operates as a regulated electric utility serving northern and central California. Its mission focuses on generating, transmitting, distributing, and selling electricity and natural gas through diverse energy sources, including nuclear, hydroelectric, fossil fuel, and photovoltaic. With a long history since 1905, it serves a broad customer base across residential, commercial, industrial, and agricultural sectors.
Oklo Inc. Overview
Oklo Inc. designs and develops fission power plants aimed at delivering reliable, commercial-scale energy in the United States. Founded in 2013, Oklo also provides used nuclear fuel recycling services. The company is comparatively smaller, with a focus on advanced nuclear technology innovation, and is headquartered in Santa Clara, California.
Key similarities and differences
Both companies operate within the regulated electric utilities sector in the U.S., providing energy solutions to customers. Pacific Gas & Electric has a diversified energy generation portfolio and a large, established customer base, while Oklo specializes in nuclear fission technology and fuel recycling with a smaller workforce. Their business models differ mainly in scale and technology focus, with PG&E emphasizing broad utility services and Oklo on nuclear innovation.
Income Statement Comparison
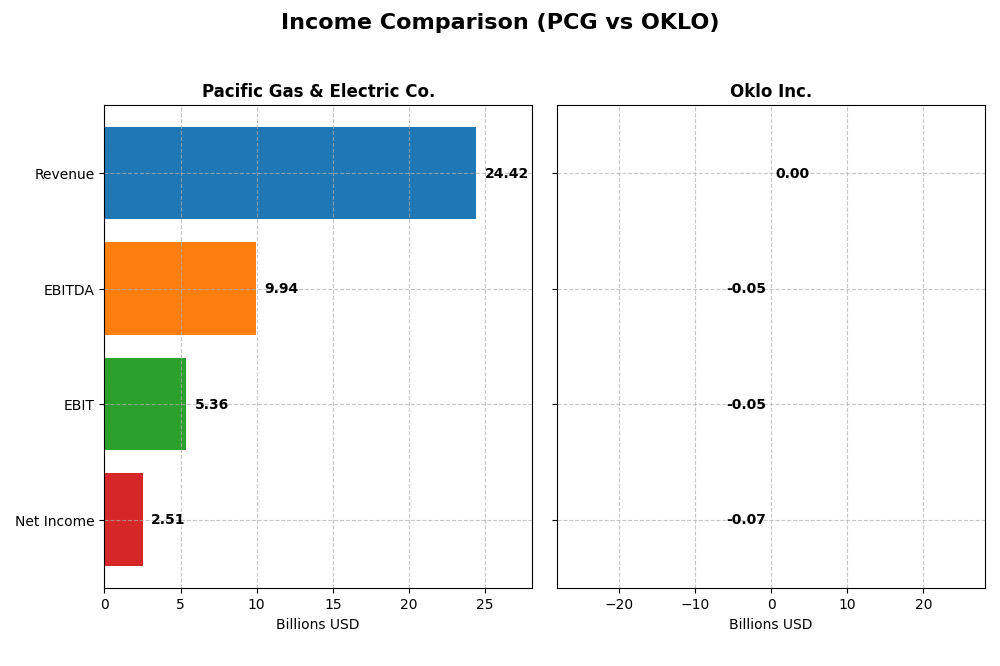
Below is a side-by-side comparison of the most recent fiscal year income statement metrics for Pacific Gas & Electric Co. and Oklo Inc.
| Metric | Pacific Gas & Electric Co. | Oklo Inc. |
|---|---|---|
| Market Cap | 34.8B | 16.5B |
| Revenue | 24.4B | 0 |
| EBITDA | 9.9B | -52.5M |
| EBIT | 5.4B | -52.8M |
| Net Income | 2.5B | -73.6M |
| EPS | 1.16 | -0.74 |
| Fiscal Year | 2024 | 2024 |
Income Statement Interpretations
Pacific Gas & Electric Co.
Pacific Gas & Electric Co. (PCG) showed steady revenue growth from 2020 to 2024, rising by 32.2%. Net income surged by 292.6%, reflecting improved profitability. Margins improved significantly, with a gross margin of 37.5% and net margin of 10.3% in 2024. The latest year saw a slight revenue decline (-0.04%) but strong gross profit and EBIT growth, indicating operational efficiency gains.
Oklo Inc.
Oklo Inc. (OKLO) reported zero revenue throughout 2021-2024, consistent with its development-stage status. The company posted continuous net losses, deepening in 2024 to -$73.6M. Margins remain unfavorable, with no gross or EBIT margins recorded. The most recent year showed a significant deterioration in EBIT and EPS growth, highlighting ongoing investment and limited commercial output.
Which one has the stronger fundamentals?
Pacific Gas & Electric demonstrates stronger fundamentals with consistent revenue and net income growth, favorable margins, and improving profitability metrics. In contrast, Oklo’s financials reflect its early-stage investment phase, with no revenue and persistent losses. PCG’s stable, favorable income statement contrasts with OKLO’s unfavorable trends, indicating more robust income fundamentals in PCG.
Financial Ratios Comparison
The following table presents a side-by-side comparison of key financial ratios for Pacific Gas & Electric Co. (PCG) and Oklo Inc. (OKLO) based on their most recent fiscal year data (2024).
| Ratios | Pacific Gas & Electric Co. (PCG) | Oklo Inc. (OKLO) |
|---|---|---|
| ROE | 8.33% | -29.35% |
| ROIC | 3.98% | -19.23% |
| P/E | 17.20 | -28.52 |
| P/B | 1.43 | 8.37 |
| Current Ratio | 1.05 | 43.47 |
| Quick Ratio | 1.00 | 43.47 |
| D/E (Debt-to-Equity) | 1.94 | 0.005 |
| Debt-to-Assets | 43.65% | 0.46% |
| Interest Coverage | 1.46 | 0 |
| Asset Turnover | 0.18 | 0 |
| Fixed Asset Turnover | 0.28 | 0 |
| Payout Ratio | 3.42% | 0 |
| Dividend Yield | 0.20% | 0 |
Interpretation of the Ratios
Pacific Gas & Electric Co.
Pacific Gas & Electric Co. shows mixed financial health with a favorable net margin of 10.29% and a reasonable PE ratio of 17.2, but concerns arise from weak returns on equity (8.33%) and invested capital (3.98%), along with a high debt-to-equity ratio of 1.94. The dividend yield is low at 0.2%, suggesting modest shareholder returns with some caution on sustainability given the company’s leverage.
Oklo Inc.
Oklo Inc. displays largely unfavorable ratios, including a negative return on equity at -29.35% and zero net margin, reflecting challenges in profitability and operational efficiency. Despite a very high current ratio of 43.47 indicating liquidity, this is flagged as unfavorable due to possible inefficiency. Oklo pays no dividends, consistent with its high growth and reinvestment focus in developing nuclear technology.
Which one has the best ratios?
Pacific Gas & Electric Co. holds a slightly unfavorable global rating but outperforms Oklo Inc., which faces more pronounced unfavorable indicators and negative returns. While both have weaknesses, Pacific Gas & Electric’s profitability and dividend payments offer more stability compared to Oklo’s developmental stage and lack of earnings.
Strategic Positioning
This section compares the strategic positioning of Pacific Gas & Electric Co. and Oklo Inc., focusing on Market position, Key segments, and Exposure to technological disruption:
Pacific Gas & Electric Co.
- Large market cap of 34.8B in regulated electric industry, facing typical utility sector pressures.
- Key revenue segments include electricity (18.6B) and natural gas (6.6B), serving diverse customer types.
- Exposure includes integration of microgrid backup devices, leveraging existing SmartMeter systems.
Oklo Inc.
- Smaller market cap of 16.5B, operating in regulated electric sector with emerging market presence.
- Focused on designing fission power plants and nuclear fuel recycling with a niche market focus.
- Exposure to technological disruption through innovative fission power plant design and nuclear fuel recycling.
Pacific Gas & Electric Co. vs Oklo Inc. Positioning
Pacific Gas & Electric Co. presents a diversified utility portfolio with large-scale electricity and gas operations, while Oklo Inc. concentrates on advanced nuclear technology. PG&E’s scale offers breadth, whereas Oklo’s innovation targets a specialized segment with higher technological risk.
Which has the best competitive advantage?
Based on MOAT evaluation, Pacific Gas & Electric Co. shows slightly unfavorable but improving value creation, while Oklo suffers very unfavorable trends with declining profitability, indicating PG&E holds a relatively stronger competitive advantage.
Stock Comparison
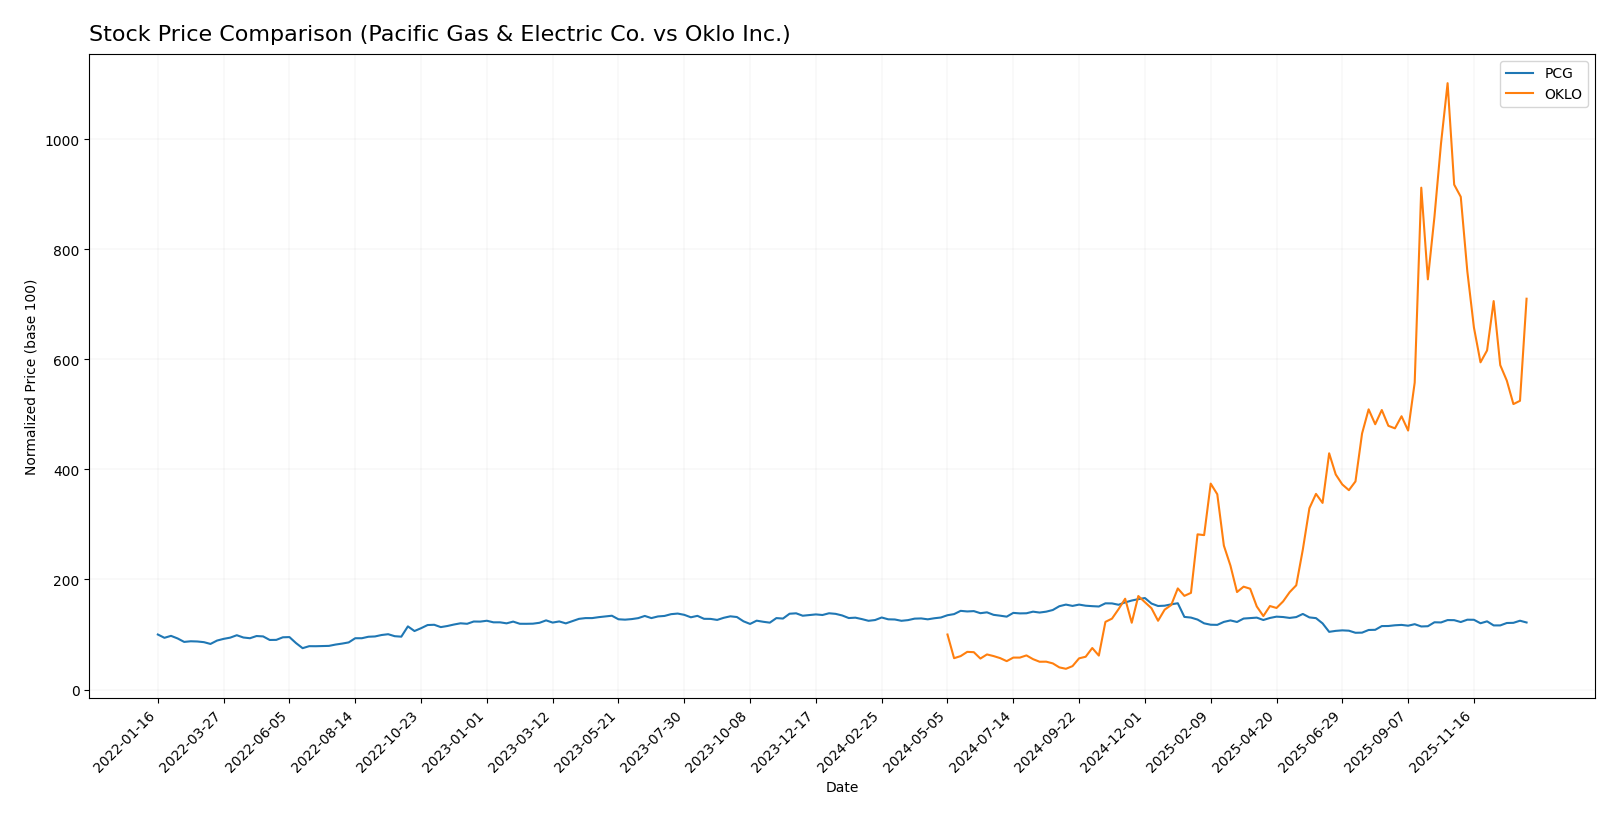
The stock price movements of Pacific Gas & Electric Co. (PCG) and Oklo Inc. (OKLO) over the past 12 months reveal contrasting trends, with PCG experiencing a moderate decline and OKLO showing substantial long-term gains despite recent setbacks.
Trend Analysis
Pacific Gas & Electric Co. (PCG) shows a bearish trend over the past year with a price decline of -3.53%, accompanied by deceleration and moderate volatility at 1.93 std deviation. The stock ranged from a high of 21.63 to a low of 13.42.
Oklo Inc. (OKLO) exhibits a strong bullish trend over the same period with a remarkable 610.11% increase, though with deceleration and high volatility at 39.02 std deviation. Prices fluctuated between 5.59 and 163.39.
Comparing both, Oklo Inc. delivered the highest market performance with a significant positive price change, while Pacific Gas & Electric Co. recorded a modest decline over the past 12 months.
Target Prices
Analysts provide a clear target price consensus for Pacific Gas & Electric Co. and Oklo Inc., indicating potential upside from current stock prices.
| Company | Target High | Target Low | Consensus |
|---|---|---|---|
| Pacific Gas & Electric Co. | 25 | 18 | 21.5 |
| Oklo Inc. | 150 | 95 | 125.67 |
The consensus target prices suggest that Pacific Gas & Electric Co.’s shares could rise from $15.85 to about $21.5, while Oklo Inc. shows even stronger growth potential from $105.31 up to $125.67 on average. These targets reflect optimistic analyst expectations relative to current market prices.
Analyst Opinions Comparison
This section compares analysts’ ratings and key financial scores for Pacific Gas & Electric Co. (PCG) and Oklo Inc. (OKLO):
Rating Comparison
PCG Rating
- Rating: B-, considered Very Favorable by analysts.
- Discounted Cash Flow Score: 1, rated Very Unfavorable, showing weak future cash flow projections.
- ROE Score: 3, Moderate efficiency in generating profit from shareholders’ equity.
- ROA Score: 3, Moderate asset utilization effectiveness.
- Debt To Equity Score: 1, Very Unfavorable, indicating high financial risk with heavy debt.
- Overall Score: 3, Moderate overall financial standing.
OKLO Rating
- Rating: C+, also considered Very Favorable.
- Discounted Cash Flow Score: 3, rated Moderate, indicating fair valuation based on cash flow.
- ROE Score: 1, Very Unfavorable, indicating poor profit generation efficiency.
- ROA Score: 1, Very Unfavorable, showing inefficiency in asset use.
- Debt To Equity Score: 5, Very Favorable, reflecting low reliance on debt and strong balance sheet.
- Overall Score: 2, Moderate but lower overall financial standing than PCG.
Which one is the best rated?
Based strictly on the data, PCG holds a higher overall rating (B- vs. C+) and better scores in ROE and ROA, despite weaker debt and cash flow scores. OKLO excels in debt management but trails PCG on profitability and overall financial health.
Scores Comparison
The following table compares the Altman Z-Score and Piotroski Score of Pacific Gas & Electric Co. (PCG) and Oklo Inc. (OKLO):
PCG Scores
- Altman Z-Score: 0.48, indicating financial distress and high bankruptcy risk.
- Piotroski Score: 5, reflecting average financial strength.
OKLO Scores
- Altman Z-Score: 339.43, indicating a very safe financial position.
- Piotroski Score: 2, indicating very weak financial health.
Which company has the best scores?
OKLO has a significantly higher Altman Z-Score, placing it in the safe zone, while PCG is in distress. However, PCG’s Piotroski Score is average, stronger than OKLO’s very weak score.
Grades Comparison
Here is a comparison of recent grades and ratings for Pacific Gas & Electric Co. and Oklo Inc.:
Pacific Gas & Electric Co. Grades
The following table summarizes recent analyst grades for Pacific Gas & Electric Co.:
| Grading Company | Action | New Grade | Date |
|---|---|---|---|
| JP Morgan | Maintain | Overweight | 2025-12-12 |
| UBS | Maintain | Neutral | 2025-10-24 |
| Jefferies | Maintain | Buy | 2025-10-22 |
| BMO Capital | Maintain | Outperform | 2025-10-14 |
| Jefferies | Maintain | Buy | 2025-10-03 |
| Barclays | Maintain | Overweight | 2025-10-01 |
| Morgan Stanley | Maintain | Equal Weight | 2025-09-25 |
| Morgan Stanley | Upgrade | Equal Weight | 2025-09-18 |
| UBS | Maintain | Neutral | 2025-09-18 |
| Barclays | Maintain | Overweight | 2025-07-22 |
Pacific Gas & Electric Co. generally maintains a positive outlook with multiple “Buy,” “Overweight,” and “Outperform” ratings and few downgrades.
Oklo Inc. Grades
The following table summarizes recent analyst grades for Oklo Inc.:
| Grading Company | Action | New Grade | Date |
|---|---|---|---|
| Seaport Global | Upgrade | Buy | 2025-12-08 |
| UBS | Maintain | Neutral | 2025-12-03 |
| B of A Securities | Maintain | Neutral | 2025-11-12 |
| B. Riley Securities | Maintain | Buy | 2025-11-12 |
| Wedbush | Maintain | Outperform | 2025-11-12 |
| B of A Securities | Downgrade | Neutral | 2025-09-30 |
| Seaport Global | Downgrade | Neutral | 2025-09-23 |
| Wedbush | Maintain | Outperform | 2025-09-22 |
| Wedbush | Maintain | Outperform | 2025-08-14 |
| Wedbush | Maintain | Outperform | 2025-08-12 |
Oklo Inc.’s grades show some recent upgrades but also downgrades from “Buy” to “Neutral,” indicating mixed analyst sentiment.
Which company has the best grades?
Pacific Gas & Electric Co. has received more consistent positive grades, including multiple “Buy” and “Overweight” ratings, while Oklo Inc. exhibits some volatility with recent downgrades. This consistency may reflect differing analyst confidence levels and could influence investor perception of risk and stability.
Strengths and Weaknesses
Below is a comparative overview of the strengths and weaknesses of Pacific Gas & Electric Co. (PCG) and Oklo Inc. (OKLO) based on recent financial performance, market position, and strategic capabilities.
| Criterion | Pacific Gas & Electric Co. (PCG) | Oklo Inc. (OKLO) |
|---|---|---|
| Diversification | Moderate: revenue from Electricity (18.6B) and Natural Gas (6.6B) in 2024 | Low: focused primarily on nuclear innovation, limited revenue diversification |
| Profitability | Moderate: positive net margin (10.29%), but ROIC below WACC | Low: negative net margin (0%), negative ROIC far below WACC |
| Innovation | Moderate: steady ROIC growth, but overall value destruction | Low: declining ROIC and value destruction, early-stage technology |
| Global presence | Regional: primarily US-regulated utility | Limited: emerging player with niche market focus |
| Market Share | Established leader in US energy markets | Niche player with very small market share |
Key takeaways: PCG shows moderate diversification and improving profitability despite value destruction, making it a cautious choice for investors favoring stability. OKLO, while innovative, currently suffers from significant value loss and declining returns, indicating higher risk and the need for close monitoring before investment.
Risk Analysis
Below is a comparative overview of key risks affecting Pacific Gas & Electric Co. (PCG) and Oklo Inc. (OKLO) based on their most recent financial and operational data from 2024.
| Metric | Pacific Gas & Electric Co. (PCG) | Oklo Inc. (OKLO) |
|---|---|---|
| Market Risk | Low beta (0.38) indicates lower volatility | Moderate beta (0.77) suggests higher volatility |
| Debt level | High debt-to-equity (1.94), interest coverage weak (1.76) | Very low debt-to-equity (0.01), strong balance sheet |
| Regulatory Risk | High, due to California utility regulations and past wildfire liabilities | Significant, given nuclear regulatory environment and licensing complexities |
| Operational Risk | Moderate, legacy infrastructure challenges and safety concerns | High, as a developing company with new nuclear technology |
| Environmental Risk | Elevated, due to fossil fuel use and wildfire risks | Moderate, nuclear waste and recycling pose specific risks |
| Geopolitical Risk | Low, primarily US domestic operations | Low, focused on US market |
The most impactful risks are PCG’s high debt burden combined with regulatory scrutiny related to wildfire liabilities, increasing financial strain and litigation risk. For OKLO, operational and regulatory risks dominate, given its novel nuclear power development and the complexities of licensing and waste management. Investors should weigh these carefully against growth prospects.
Which Stock to Choose?
Pacific Gas & Electric Co. (PCG) shows favorable income growth over 2020–2024 with a 32.22% revenue increase and strong profitability metrics, despite a slight recent revenue decline. Financial ratios reveal mixed signals, with 28.57% favorable and 50% unfavorable ratios, indicating moderate debt and some operational inefficiencies. Its rating is very favorable (B-), though the Altman Z-Score suggests financial distress, and the company is shedding value but improving profitability.
Oklo Inc. (OKLO) exhibits an unfavorable income statement performance with no revenue growth and significant net income decline over 2021–2024. Financial ratios are mostly unfavorable (64.29%), despite low debt levels and a very favorable rating (C+). Scores indicate a safe financial zone by Altman Z-Score but very weak Piotroski Score. The company is shedding value with declining profitability and faces operational challenges.
Considering ratings and overall financial evaluations, PCG might appear more suitable for investors seeking companies with improving profitability and established income growth, albeit with some financial risks. OKLO could be interpreted as appealing to risk-tolerant investors focused on potential turnaround opportunities, given its strong market cap growth but weak financial fundamentals and value destruction.
Disclaimer: Investment carries a risk of loss of initial capital. The past performance is not a reliable indicator of future results. Be sure to understand risks before making an investment decision.
Go Further
I encourage you to read the complete analyses of Pacific Gas & Electric Co. and Oklo Inc. to enhance your investment decisions: