In the fast-evolving technology sector, Zscaler, Inc. and Oddity Tech Ltd. stand out with distinct approaches yet overlapping ambitions in software infrastructure. Zscaler leads in cloud security solutions, while Oddity Tech innovates in consumer-facing beauty and wellness technology. Comparing these companies reveals unique innovation strategies and market positions. Join me as we explore which company presents the most compelling investment opportunity today.
Table of contents
Companies Overview
I will begin the comparison between Zscaler and Oddity Tech by providing an overview of these two companies and their main differences.
Zscaler Overview
Zscaler, Inc. is a cloud security company headquartered in San Jose, California. It offers solutions such as Zscaler Internet Access and Zscaler Private Access that secure user and device access to SaaS applications and internal managed applications. The company also provides digital experience monitoring and workload segmentation to reduce risk and enhance compliance across various industries. Zscaler operates globally with over 7,300 employees.
Oddity Tech Overview
Oddity Tech Ltd., based in Tel Aviv-Jaffa, Israel, operates as a consumer-tech company specializing in beauty and wellness products. It leverages its PowerMatch technology to develop digital-first brands that disrupt traditional offline markets. The company offers products under brands like IL MAKIAGE and SpoiledChild, focusing on categories such as face, complexion, hair, and skin care. Oddity Tech employs nearly 500 people and has a strong digital and direct-to-consumer focus.
Key similarities and differences
Both Zscaler and Oddity Tech belong to the technology sector and trade on NASDAQ, but their business models differ significantly. Zscaler operates in software infrastructure, providing cloud security services across industries, while Oddity Tech focuses on consumer technology products in beauty and wellness. Zscaler’s market cap is substantially larger at $34B, compared to Oddity Tech’s $2B, reflecting their different scales and market focuses.
Income Statement Comparison
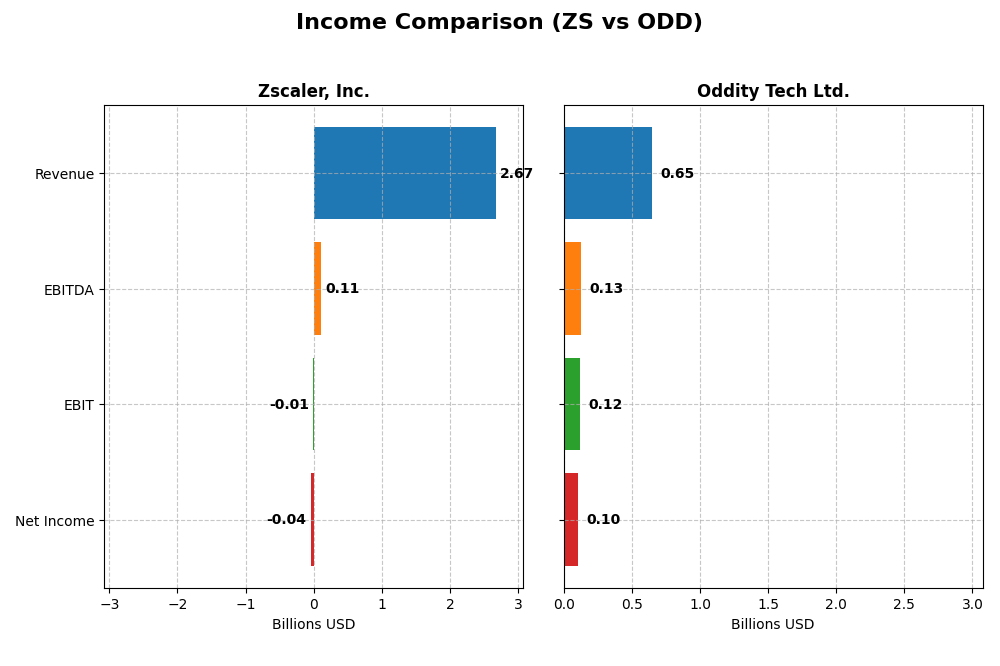
This table compares the key income statement metrics for Zscaler, Inc. and Oddity Tech Ltd. for their most recent fiscal years, providing a snapshot of their financial performance.
| Metric | Zscaler, Inc. (ZS) | Oddity Tech Ltd. (ODD) |
|---|---|---|
| Market Cap | 34.1B | 2.01B |
| Revenue | 2.67B | 647M |
| EBITDA | 112M | 125M |
| EBIT | -8.77M | 116M |
| Net Income | -41.5M | 101M |
| EPS | -0.27 | 1.78 |
| Fiscal Year | 2025 | 2024 |
Income Statement Interpretations
Zscaler, Inc.
Zscaler’s revenue grew significantly from 673M in 2021 to 2.67B in 2025, with net losses narrowing from -262M to -41M, reflecting improving profitability. Gross margins remained strong around 77%, while EBIT and net margins stayed negative but improved in 2025. The latest year showed favorable revenue growth of 23.3% and improved margins, indicating operational progress despite ongoing losses.
Oddity Tech Ltd.
Oddity Tech’s revenue expanded from 111M in 2020 to 647M in 2024, with net income rising markedly from 11.7M to 101.5M. Margins were healthy, with a gross margin of 72.4% and positive EBIT and net margins of 17.9% and 15.7%, respectively. The most recent year saw robust growth in revenue (27.2%) and net margin (36.3%), highlighting strong profitability gains and efficient cost management.
Which one has the stronger fundamentals?
Oddity Tech demonstrates stronger fundamentals with consistent profitability, positive EBIT, and net margins, alongside substantial net income growth over the period. Zscaler shows impressive revenue growth and improving margins but remains unprofitable at the net and EBIT levels. Both companies have favorable income statement trends, yet Oddity’s profitability and margin stability stand out as more favorable fundamentals.
Financial Ratios Comparison
The table below presents a side-by-side comparison of key financial ratios for Zscaler, Inc. (ZS) and Oddity Tech Ltd. (ODD) based on their most recent full fiscal year data.
| Ratios | Zscaler, Inc. (ZS) FY 2025 | Oddity Tech Ltd. (ODD) FY 2024 |
|---|---|---|
| ROE | -2.31% | 35.95% |
| ROIC | -3.18% | 28.56% |
| P/E | -1063 | 23.75 |
| P/B | 24.51 | 8.54 |
| Current Ratio | 2.01 | 1.79 |
| Quick Ratio | 2.01 | 0.99 |
| D/E | 1.00 | 0.08 |
| Debt-to-Assets | 28.0% | 5.17% |
| Interest Coverage | -13.49 | 1521 |
| Asset Turnover | 0.42 | 1.47 |
| Fixed Asset Turnover | 4.22 | 19.38 |
| Payout ratio | 0% | 0% |
| Dividend yield | 0% | 0% |
Interpretation of the Ratios
Zscaler, Inc.
Zscaler shows a mixed ratio profile with unfavorable profitability ratios including negative net margin (-1.55%) and ROE (-2.31%), alongside a high price-to-book ratio (24.51). Liquidity ratios are favorable, with a current ratio of 2.01. The company does not pay dividends, reflecting a reinvestment strategy likely aligned with its high R&D expenses and growth focus.
Oddity Tech Ltd.
Oddity Tech displays strong profitability ratios, including a net margin of 15.69% and ROE of 35.95%, with favorable liquidity and leverage metrics such as a current ratio of 1.79 and low debt-to-assets at 5.17%. It also does not pay dividends, which suggests prioritization of growth and reinvestment over shareholder payouts.
Which one has the best ratios?
Oddity Tech Ltd. exhibits a more favorable financial ratio profile overall, with a higher proportion of strong profitability and liquidity indicators. Zscaler, Inc. has several unfavorable profitability measures and a high valuation metric that may warrant caution. Oddity’s ratios suggest more robust financial health in comparison.
Strategic Positioning
This section compares the strategic positioning of Zscaler, Inc. and Oddity Tech Ltd., including market position, key segments, and exposure to technological disruption:
Zscaler, Inc.
- Positioned as a large cloud security provider with 34B market cap, facing competitive pressure in software infrastructure.
- Focuses on cloud security solutions including SaaS, private access, and digital experience across multiple industries.
- Exposed to cloud security advancements and risks of disruption in SaaS and infrastructure security technologies.
Oddity Tech Ltd.
- Smaller consumer-tech company with 2B market cap, operating in beauty and wellness industries.
- Builds digital-first beauty and wellness brands using proprietary PowerMatch technology.
- Faces disruption potential through digital transformation in offline-dominated beauty sectors.
Zscaler, Inc. vs Oddity Tech Ltd. Positioning
Zscaler pursues a diversified technology infrastructure focus across many industries, providing comprehensive cloud security solutions. Oddity Tech concentrates on consumer beauty and wellness with digital branding, offering a niche but innovative market approach.
Which has the best competitive advantage?
Oddity Tech shows a very favorable moat with positive ROIC exceeding WACC and growing profitability, indicating a durable competitive advantage. Zscaler’s moat is slightly unfavorable due to negative ROIC compared to WACC despite improving returns.
Stock Comparison
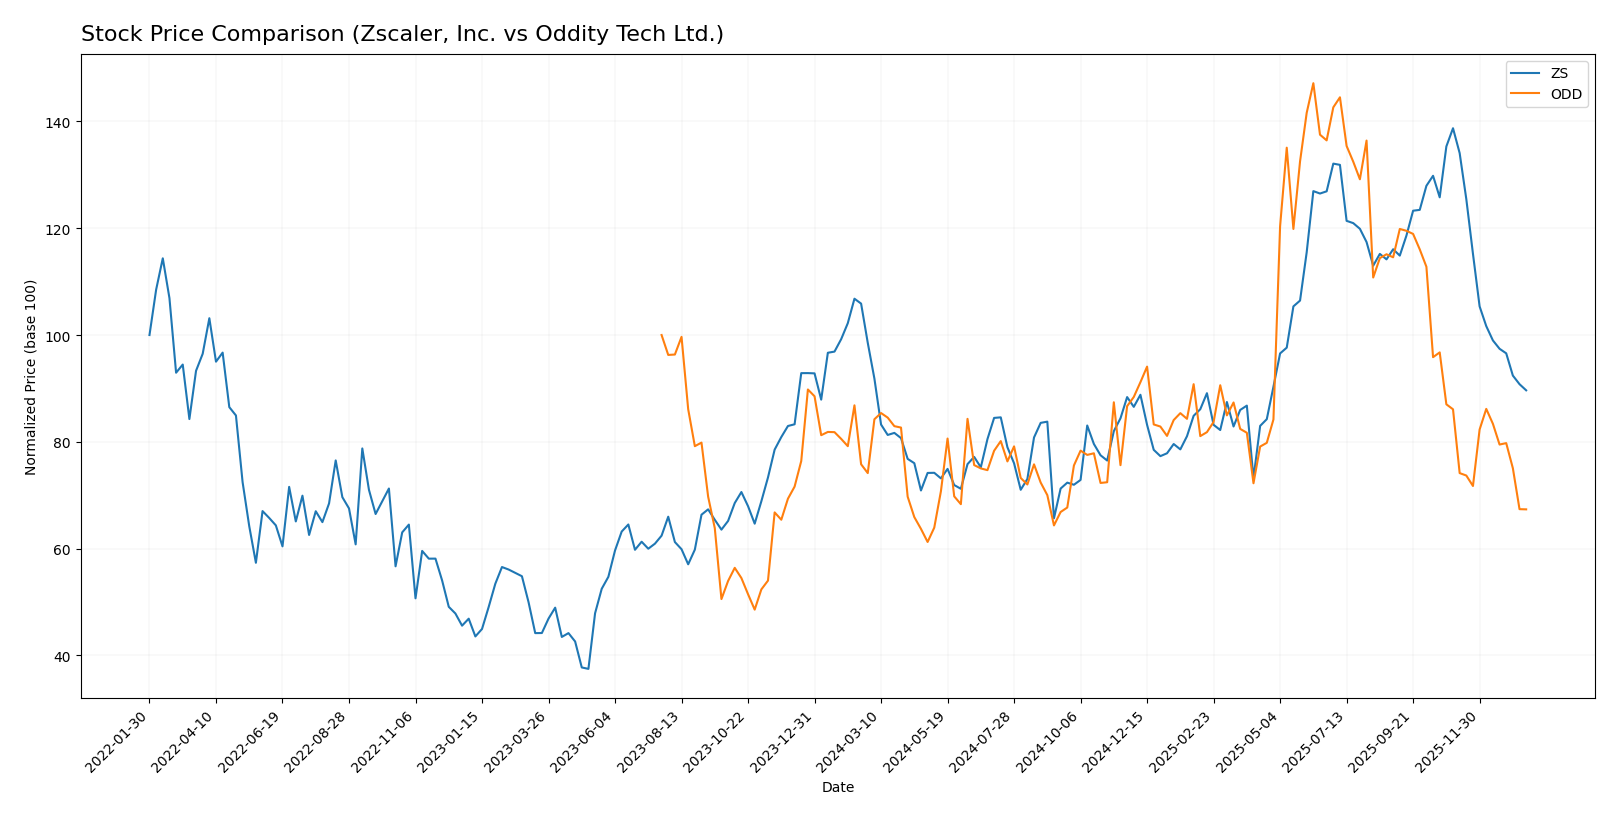
The stock price movements of Zscaler, Inc. and Oddity Tech Ltd. over the past year reveal clear bearish trends, marked by significant declines and decelerating momentum in both cases.
Trend Analysis
Zscaler, Inc. experienced a 9.03% price decline over the past 12 months, confirming a bearish trend with deceleration. The stock showed high volatility with a 47.11 standard deviation, peaking at 331.14 and bottoming at 156.78.
Oddity Tech Ltd. recorded a 9.16% decrease in price over the same period, also bearish with deceleration. Volatility was lower, with an 11.75 standard deviation, reaching a high of 77.35 and a low of 32.19.
Comparing both, Zscaler and Oddity Tech delivered similar negative returns, but Zscaler demonstrated higher volatility and a sharper recent decline, indicating a more pronounced bearish market performance.
Target Prices
The consensus target prices for Zscaler, Inc. and Oddity Tech Ltd. reflect analysts’ expectations for moderate to strong upside potential.
| Company | Target High | Target Low | Consensus |
|---|---|---|---|
| Zscaler, Inc. | 360 | 260 | 311.41 |
| Oddity Tech Ltd. | 80 | 40 | 66.33 |
Analysts expect Zscaler’s stock price to rise significantly from its current 213.98 USD to around 311 USD on average. Oddity Tech’s consensus target is almost double its current price of 35.4 USD, signaling a bullish outlook.
Analyst Opinions Comparison
This section compares analysts’ ratings and grades for Zscaler, Inc. and Oddity Tech Ltd.:
Rating Comparison
ZS Rating
- Rating: C- with a very favorable status.
- Discounted Cash Flow Score: 4, indicating favorable outlook.
- ROE Score: 1, marked as very unfavorable.
- ROA Score: 1, marked as very unfavorable.
- Debt To Equity Score: 1, marked as very unfavorable.
- Overall Score: 1, marked as very unfavorable.
ODD Rating
- Rating: B+ with a very favorable status.
- Discounted Cash Flow Score: 4, indicating favorable outlook.
- ROE Score: 5, marked as very favorable.
- ROA Score: 4, marked as favorable.
- Debt To Equity Score: 3, marked as moderate.
- Overall Score: 3, marked as moderate.
Which one is the best rated?
Oddity Tech Ltd. is better rated overall with a B+ rating and higher scores in ROE, ROA, debt-to-equity, and overall score compared to Zscaler, Inc., which holds a C- rating and mostly very unfavorable scores.
Scores Comparison
Here is a comparison of the Altman Z-Score and Piotroski Score for Zscaler, Inc. and Oddity Tech Ltd.:
ZS Scores
- Altman Z-Score: 4.89, indicating a safe zone, low bankruptcy risk.
- Piotroski Score: 3, classified as very weak financial strength.
ODD Scores
- Altman Z-Score: 3.78, indicating a safe zone, low bankruptcy risk.
- Piotroski Score: 6, classified as average financial strength.
Which company has the best scores?
ZS has a higher Altman Z-Score indicating stronger bankruptcy safety, but ODD has a better Piotroski Score suggesting stronger financial health. Each score favors a different company based on the data provided.
Grades Comparison
Here is the detailed grades comparison for Zscaler, Inc. and Oddity Tech Ltd.:
Zscaler, Inc. Grades
The following table summarizes recent grades assigned to Zscaler, Inc. by reputable grading companies.
| Grading Company | Action | New Grade | Date |
|---|---|---|---|
| Citigroup | Maintain | Buy | 2026-01-13 |
| Keybanc | Maintain | Overweight | 2026-01-12 |
| Piper Sandler | Maintain | Neutral | 2026-01-05 |
| RBC Capital | Maintain | Outperform | 2026-01-05 |
| Mizuho | Upgrade | Outperform | 2025-12-16 |
| Bernstein | Downgrade | Market Perform | 2025-12-01 |
| Citigroup | Maintain | Buy | 2025-12-01 |
| JP Morgan | Maintain | Overweight | 2025-11-26 |
| Baird | Maintain | Outperform | 2025-11-26 |
| BTIG | Maintain | Buy | 2025-11-26 |
Zscaler’s grades primarily indicate a bullish outlook, with multiple “Buy,” “Overweight,” and “Outperform” ratings, alongside a recent upgrade and a single downgrade to “Market Perform.”
Oddity Tech Ltd. Grades
Below is a summary of Oddity Tech Ltd.’s grades issued by established grading firms.
| Grading Company | Action | New Grade | Date |
|---|---|---|---|
| Keybanc | Maintain | Overweight | 2026-01-08 |
| JP Morgan | Maintain | Overweight | 2025-12-12 |
| JP Morgan | Maintain | Overweight | 2025-11-21 |
| Barclays | Maintain | Equal Weight | 2025-11-21 |
| Morgan Stanley | Maintain | Equal Weight | 2025-11-21 |
| Needham | Maintain | Buy | 2025-11-20 |
| Keybanc | Maintain | Overweight | 2025-10-08 |
| JMP Securities | Maintain | Market Outperform | 2025-09-23 |
| Morgan Stanley | Maintain | Equal Weight | 2025-08-06 |
| JMP Securities | Maintain | Market Outperform | 2025-08-05 |
Oddity Tech’s grades mostly reflect a stable positive sentiment with consistent “Overweight,” “Equal Weight,” and “Market Outperform” ratings, complemented by a “Buy” rating.
Which company has the best grades?
Both Zscaler, Inc. and Oddity Tech Ltd. hold predominantly positive grades, but Zscaler exhibits a stronger consensus with more frequent “Buy” and “Outperform” ratings. This may suggest a higher confidence level from analysts, potentially influencing investors seeking growth or momentum stocks.
Strengths and Weaknesses
Below is a comparative overview of the strengths and weaknesses of Zscaler, Inc. (ZS) and Oddity Tech Ltd. (ODD) based on recent financial performance and competitive positioning.
| Criterion | Zscaler, Inc. (ZS) | Oddity Tech Ltd. (ODD) |
|---|---|---|
| Diversification | Moderate, primarily focused on cloud security solutions | Limited public data, likely more focused due to smaller scale |
| Profitability | Negative net margin (-1.55%) and ROIC (-3.18%), value destroying | Strong profitability with net margin 15.69% and ROIC 28.56%, value creating |
| Innovation | Growing ROIC trend (+76%), showing improving operational efficiency | Also growing ROIC (+34%), indicating sustained innovation and competitive advantage |
| Global presence | Established global footprint in cloud security markets | Less documented, but showing rapid growth and solid financial health |
| Market Share | Significant presence in cloud security but challenged by profitability issues | Smaller but growing market share supported by strong financial metrics |
Key takeaways: Oddity Tech Ltd. demonstrates a robust financial profile with favorable profitability and a durable competitive advantage, making it an attractive investment. Zscaler shows improving operational efficiency but is currently value destructive with profitability challenges, warranting cautious consideration.
Risk Analysis
Below is a comparative risk overview of Zscaler, Inc. (ZS) and Oddity Tech Ltd. (ODD) for the most recent fiscal years.
| Metric | Zscaler, Inc. (ZS) | Oddity Tech Ltd. (ODD) |
|---|---|---|
| Market Risk | Moderate (Beta 1.02) | High (Beta 3.18) |
| Debt level | Moderate (Debt/Equity 1.0) | Low (Debt/Equity 0.08) |
| Regulatory Risk | Moderate (US tech sector) | Moderate (Israel-based, US-listed) |
| Operational Risk | Moderate (Cloud security ops) | Moderate (Consumer-tech products) |
| Environmental Risk | Low | Low |
| Geopolitical Risk | Low (US-based) | Moderate (Israel operations) |
Zscaler faces moderate market risk with stable leverage but shows financial strain with negative margins and weak profitability metrics. Oddity Tech has higher market volatility and some regulatory exposure but benefits from strong profitability and low debt, suggesting better financial resilience. The most impactful risks are Oddity’s market volatility and Zscaler’s operational profitability challenges.
Which Stock to Choose?
Zscaler, Inc. (ZS) shows strong revenue growth of 23.31% in 2025 with favorable gross margin but negative profitability ratios including a -2.31% ROE and -3.18% ROIC. Its debt profile is manageable with a current ratio of 2.01, yet the overall rating is very favorable despite mixed financial ratios and a slightly unfavorable moat due to value destruction but improving profitability.
Oddity Tech Ltd. (ODD) exhibits robust income growth of 27.2% in 2024, with consistently favorable profitability metrics such as a 35.95% ROE and 28.56% ROIC. The company maintains low debt levels and solid liquidity, reflected in a current ratio of 1.79 and a very favorable overall rating. Its moat evaluation is very favorable, indicating durable competitive advantage and value creation.
Considering the ratings and comprehensive income and ratio evaluations, ZS’s profile might appeal to investors willing to tolerate short-term profitability challenges for growth potential, while ODD’s stable profitability and strong moat could be more suitable for those seeking consistent value creation and financial health.
Disclaimer: Investment carries a risk of loss of initial capital. The past performance is not a reliable indicator of future results. Be sure to understand risks before making an investment decision.
Go Further
I encourage you to read the complete analyses of Zscaler, Inc. and Oddity Tech Ltd. to enhance your investment decisions: