In today’s fast-evolving tech landscape, Wix.com Ltd. and Oddity Tech Ltd. stand out as innovative players within the software infrastructure sector. While Wix specializes in empowering users to create and manage websites globally, Oddity Tech focuses on disrupting the beauty and wellness market through digital-first consumer brands. This article will explore their market positions and growth strategies to help you identify which company offers the most compelling investment opportunity.
Table of contents
Companies Overview
I will begin the comparison between Wix.com Ltd. and Oddity Tech Ltd. by providing an overview of these two companies and their main differences.
Wix.com Ltd. Overview
Wix.com Ltd. develops and markets a cloud-based platform that enables users worldwide to create websites and web applications. The company offers tools such as Wix Editor, Wix ADI, and Corvid by Wix, alongside services like Ascend, Wix Payments, and an App Market. Headquartered in Tel Aviv, it serves over 222M registered users and holds a strong position in the software infrastructure industry with a market cap of approximately 4.46B USD.
Oddity Tech Ltd. Overview
Oddity Tech Ltd. operates as a consumer-tech company specializing in beauty and wellness products powered by its proprietary PowerMatch technology. It builds digital-first brands like IL MAKIAGE and SpoiledChild to challenge traditional offline markets. Based in Tel Aviv-Jaffa, Oddity has a market cap near 2.01B USD and focuses on innovating within the software infrastructure sector with a leaner workforce of 489 employees.
Key similarities and differences
Both companies are Israeli-based technology firms listed on NASDAQ and operate within the software infrastructure industry. Wix.com focuses on website creation platforms and related digital services with a broad user base and diversified product suite. Oddity Tech is niche-oriented in consumer beauty and wellness products, leveraging technology to disrupt traditional markets. Their business models differ in target markets and product offerings, with Wix emphasizing software tools and Oddity emphasizing digital-first brand development.
Income Statement Comparison
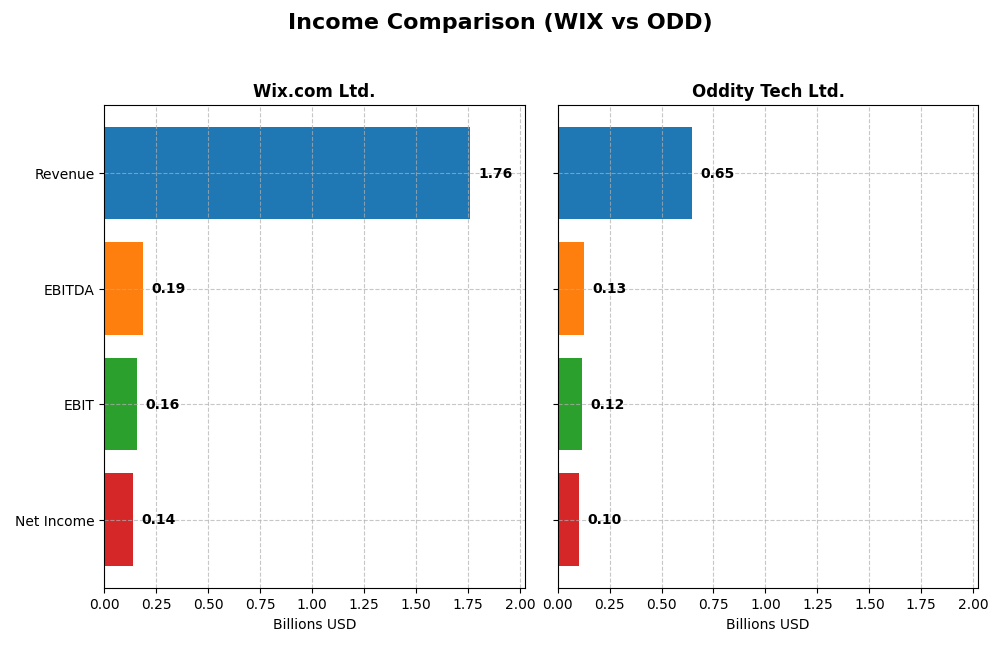
The table below presents a side-by-side comparison of key income statement metrics for Wix.com Ltd. and Oddity Tech Ltd. based on their most recent fiscal year results.
| Metric | Wix.com Ltd. | Oddity Tech Ltd. |
|---|---|---|
| Market Cap | 4.46B | 2.01B |
| Revenue | 1.76B | 647M |
| EBITDA | 186M | 125M |
| EBIT | 155M | 116M |
| Net Income | 138M | 101M |
| EPS | 2.49 | 1.78 |
| Fiscal Year | 2024 | 2024 |
Income Statement Interpretations
Wix.com Ltd.
Wix.com Ltd. showed consistent revenue growth from $984M in 2020 to $1.76B in 2024, with net income turning positive after losses in prior years, reaching $138M in 2024. Gross margin remained strong around 68%, while net margin improved markedly to 7.9%. The 2024 year reflected favorable growth in revenue (+12.7%) and substantial margin recovery, highlighting operational improvements.
Oddity Tech Ltd.
Oddity Tech Ltd. experienced rapid revenue expansion from $111M in 2020 to $647M in 2024, with net income rising sharply to $101M. Margins improved significantly, with a gross margin of 72% and net margin of 15.7% in 2024. The latest year saw robust revenue growth (+27.2%) alongside increased profitability and margin expansion, signaling strong operational leverage and market traction.
Which one has the stronger fundamentals?
Both companies demonstrate favorable income statement trends, but Oddity Tech Ltd. shows more pronounced revenue and net income growth, higher gross and net margins, and a consistently favorable margin trajectory. Wix.com Ltd. also improved considerably, recovering from earlier losses, yet Oddity’s more aggressive growth and superior margin metrics indicate a stronger fundamental income statement profile.
Financial Ratios Comparison
The table below presents the most recent financial ratios for Wix.com Ltd. (WIX) and Oddity Tech Ltd. (ODD) based on their 2024 fiscal year data.
| Ratios | Wix.com Ltd. (WIX) | Oddity Tech Ltd. (ODD) |
|---|---|---|
| ROE | -1.76 | 0.36 |
| ROIC | 9.13% | 28.56% |
| P/E | 86.2 | 23.7 |
| P/B | -151.4 | 8.54 |
| Current Ratio | 0.84 | 1.79 |
| Quick Ratio | 0.84 | 0.99 |
| D/E (Debt-to-Equity) | -12.3 | 0.08 |
| Debt-to-Assets | 50.7% | 5.17% |
| Interest Coverage | 25.9 | 1521 |
| Asset Turnover | 0.92 | 1.47 |
| Fixed Asset Turnover | 3.33 | 19.38 |
| Payout ratio | 0 | 0 |
| Dividend yield | 0 | 0 |
Interpretation of the Ratios
Wix.com Ltd.
Wix.com Ltd. shows a mixed ratio profile with a slightly unfavorable overall evaluation. The company has a neutral net margin of 7.86% but an unfavorable return on equity of -175.57%, indicating poor profitability for shareholders. Its debt-to-equity ratio is favorable at -12.31, yet the current ratio of 0.84 signals potential liquidity concerns. Wix does not pay dividends, likely due to reinvestment priorities or growth strategies.
Oddity Tech Ltd.
Oddity Tech Ltd. exhibits a favorable ratio profile, with strong profitability metrics including a 15.69% net margin and 35.95% return on equity. Liquidity is solid, as reflected in a current ratio of 1.79, and the company maintains a low debt-to-assets ratio of 5.17%. Oddity does not pay dividends, which may be consistent with a focus on reinvestment or expansion phases typical in tech startups.
Which one has the best ratios?
Oddity Tech Ltd. clearly holds the advantage with a higher proportion of favorable ratios (64.29%) compared to Wix.com Ltd.’s 28.57%. Oddity’s strengths in profitability, liquidity, and low leverage contrast with Wix’s challenges in return on equity and liquidity, making Oddity’s financial ratios more robust overall.
Strategic Positioning
This section compares the strategic positioning of Wix.com Ltd. and Oddity Tech Ltd. including market position, key segments, and exposure to technological disruption:
Wix.com Ltd.
- Market leader in cloud-based website creation with global reach; faces competitive pressure from diverse SaaS providers.
- Focuses on Business Solutions and Creative Subscription segments with multi-product platform driving revenues.
- Exposure to technological disruption through AI-powered website tools and integrated business management services.
Oddity Tech Ltd.
- Smaller market cap consumer-tech player disrupting offline beauty and wellness industries with digital-first brands.
- Concentrates on beauty and wellness products using proprietary PowerMatch technology under two main brands.
- Uses technology to disrupt traditional beauty markets, leveraging digital platforms and proprietary tech innovations.
Wix.com Ltd. vs Oddity Tech Ltd. Positioning
Wix adopts a diversified approach with two major revenue segments and a broad product suite, enhancing resilience but facing intense competition. Oddity Tech is more concentrated, focusing on digital-first beauty and wellness brands with proprietary technology, creating niche disruption but limited diversification.
Which has the best competitive advantage?
Oddity Tech demonstrates a very favorable MOAT with ROIC significantly above WACC and growing profitability, indicating a durable competitive advantage. Wix shows slightly unfavorable MOAT with ROIC below WACC despite improving returns, suggesting weaker capital efficiency and value creation.
Stock Comparison
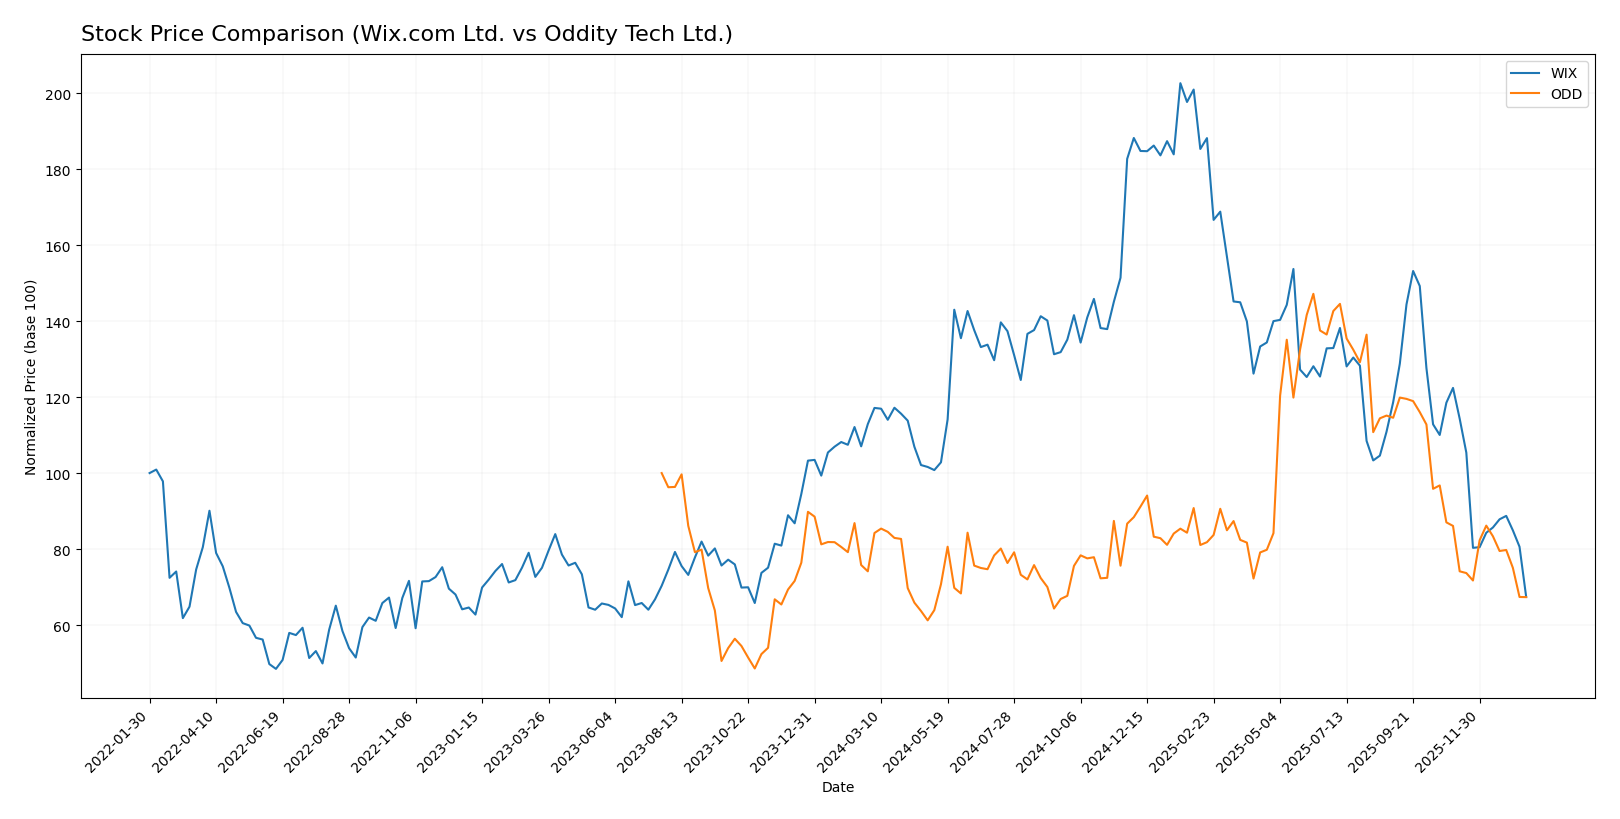
Over the past year, both Wix.com Ltd. (WIX) and Oddity Tech Ltd. (ODD) experienced notable bearish trends, with significant price declines and deceleration in their downward momentum, reflecting challenging trading dynamics.
Trend Analysis
Wix.com Ltd. showed a bearish trend with a -40.28% price change over the past 12 months, marked by deceleration and high volatility (std deviation 34.39). The stock’s recent slope steepened to -4.1, confirming accelerating losses.
Oddity Tech Ltd. also followed a bearish trend, declining -9.16% over the year, accompanied by deceleration and lower volatility (std deviation 11.75). The recent slope of -0.42 indicates a slower rate of decline.
Comparing the two, Wix.com Ltd. delivered the lowest market performance with a steeper and more volatile decline than Oddity Tech Ltd. over the same period.
Target Prices
The current analyst consensus shows promising upside potential for both Wix.com Ltd. and Oddity Tech Ltd.
| Company | Target High | Target Low | Consensus |
|---|---|---|---|
| Wix.com Ltd. | 210 | 70 | 160.27 |
| Oddity Tech Ltd. | 80 | 40 | 66.33 |
Analysts expect Wix.com Ltd.’s stock to nearly double from its current price of $80.16, signaling strong growth potential. Oddity Tech Ltd.’s consensus target of $66.33 is almost double its current price of $35.40, indicating robust investor optimism.
Analyst Opinions Comparison
This section compares analysts’ ratings and grades for Wix.com Ltd. and Oddity Tech Ltd.:
Rating Comparison
Wix.com Ltd. Rating
- Rating: C, classified as Very Favorable
- Discounted Cash Flow Score: 3 (Moderate)
- ROE Score: 1 (Very Unfavorable)
- ROA Score: 4 (Favorable)
- Debt To Equity Score: 1 (Very Unfavorable)
- Overall Score: 2 (Moderate)
Oddity Tech Ltd. Rating
- Rating: B+, classified as Very Favorable
- Discounted Cash Flow Score: 4 (Favorable)
- ROE Score: 5 (Very Favorable)
- ROA Score: 4 (Favorable)
- Debt To Equity Score: 3 (Moderate)
- Overall Score: 3 (Moderate)
Which one is the best rated?
Based strictly on the provided data, Oddity Tech Ltd. holds a higher rating (B+) and has stronger scores in discounted cash flow, ROE, and debt-to-equity compared to Wix.com Ltd., which shows weaker profitability and financial risk metrics.
Scores Comparison
Here is a comparison of the scores for Wix.com Ltd. and Oddity Tech Ltd.:
WIX Scores
- Altman Z-Score: 1.83, in the grey zone indicating moderate bankruptcy risk.
- Piotroski Score: 6, reflecting average financial strength.
ODD Scores
- Altman Z-Score: 3.78, in the safe zone indicating low bankruptcy risk.
- Piotroski Score: 6, reflecting average financial strength.
Which company has the best scores?
Oddity Tech Ltd. shows a stronger Altman Z-Score, placing it in the safe zone versus Wix.com’s grey zone. Both companies have the same Piotroski Score of 6, indicating similar average financial strength.
Grades Comparison
Below is the grades comparison for Wix.com Ltd. and Oddity Tech Ltd.:
Wix.com Ltd. Grades
This table summarizes recent grades given to Wix.com Ltd. by leading financial institutions.
| Grading Company | Action | New Grade | Date |
|---|---|---|---|
| Morgan Stanley | Maintain | Overweight | 2026-01-15 |
| Wells Fargo | Maintain | Overweight | 2025-12-19 |
| Cantor Fitzgerald | Maintain | Overweight | 2025-12-11 |
| Wells Fargo | Maintain | Overweight | 2025-11-20 |
| Barclays | Maintain | Overweight | 2025-11-20 |
| Citizens | Maintain | Market Outperform | 2025-11-20 |
| Citigroup | Maintain | Buy | 2025-11-20 |
| Scotiabank | Maintain | Sector Outperform | 2025-11-20 |
| Needham | Maintain | Buy | 2025-11-20 |
| Evercore ISI Group | Maintain | Outperform | 2025-11-20 |
Wix.com Ltd. consistently receives positive grades, mostly “Overweight” and variations of “Outperform,” indicating strong analyst confidence.
Oddity Tech Ltd. Grades
This table summarizes recent grades given to Oddity Tech Ltd. by leading financial institutions.
| Grading Company | Action | New Grade | Date |
|---|---|---|---|
| Keybanc | Maintain | Overweight | 2026-01-08 |
| JP Morgan | Maintain | Overweight | 2025-12-12 |
| JP Morgan | Maintain | Overweight | 2025-11-21 |
| Barclays | Maintain | Equal Weight | 2025-11-21 |
| Morgan Stanley | Maintain | Equal Weight | 2025-11-21 |
| Needham | Maintain | Buy | 2025-11-20 |
| Keybanc | Maintain | Overweight | 2025-10-08 |
| JMP Securities | Maintain | Market Outperform | 2025-09-23 |
| Morgan Stanley | Maintain | Equal Weight | 2025-08-06 |
| JMP Securities | Maintain | Market Outperform | 2025-08-05 |
Oddity Tech Ltd. shows a stable grade pattern centered around “Overweight” and “Equal Weight,” with some “Market Outperform” and “Buy” ratings.
Which company has the best grades?
Wix.com Ltd. holds a stronger consensus with more frequent “Overweight” and “Outperform” ratings compared to Oddity Tech Ltd.’s mix of “Overweight” and “Equal Weight.” This suggests higher analyst confidence in Wix.com Ltd., which may attract investors focused on growth potential.
Strengths and Weaknesses
The following table summarizes key strengths and weaknesses of Wix.com Ltd. (WIX) and Oddity Tech Ltd. (ODD) based on their financial performance, market position, and competitive advantages as of 2026.
| Criterion | Wix.com Ltd. (WIX) | Oddity Tech Ltd. (ODD) |
|---|---|---|
| Diversification | Moderate: Revenue mainly from Creative Subscription (1.26B USD) and Business Solutions (496M USD) | Limited data, but appears focused on core tech services |
| Profitability | Neutral net margin (7.86%), unfavorable ROE (-175.57%) | Strong profitability: net margin 15.69%, ROE 35.95% |
| Innovation | Growing ROIC trend but overall slightly unfavorable moat; innovation improving profitability | Very favorable moat with durable competitive advantage and increasing profitability |
| Global presence | Established global player with steady revenue growth | Smaller scale but rapidly growing and improving financial metrics |
| Market Share | Significant in website-building market, but facing competitive pressure | Emerging player with strong financial ratios, potential to increase share |
Key takeaway: Oddity Tech shows stronger overall financial health and a durable competitive advantage, making it more favorable for investors. Wix.com, while improving profitability, still faces challenges with value creation and market diversification.
Risk Analysis
Below is a comparative risk overview for Wix.com Ltd. (WIX) and Oddity Tech Ltd. (ODD) based on the latest 2024 data:
| Metric | Wix.com Ltd. (WIX) | Oddity Tech Ltd. (ODD) |
|---|---|---|
| Market Risk | Beta 1.42, price volatility high (range 80.06-247.11) | Beta 3.18, higher volatility (range 33.06-79.18) |
| Debt level | Debt to assets 50.7% (unfavorable), D/E negative (-12.31, favorable due to asset structure) | Debt to assets 5.17% (favorable), D/E 0.08 (favorable) |
| Regulatory Risk | Moderate, operates globally in tech with some regulatory scrutiny | Moderate, consumer-tech in beauty/wellness with evolving regulations |
| Operational Risk | Medium, 4,399 employees, established cloud platform | Smaller scale, 489 employees, new digital-first brand model |
| Environmental Risk | Low to moderate, tech sector with limited direct impact | Low, consumer products but digital focus reduces footprint |
| Geopolitical Risk | Based in Israel, exposed to regional tensions | Also Israel-based, similar geopolitical exposure |
WIX carries moderate market and debt risks with a slightly unfavorable debt to assets ratio and moderate operational scale. ODD shows higher market volatility but far lower leverage and a safer financial profile. Market and debt risks are most impactful for Wix, while Oddity’s elevated beta signals higher price fluctuation risk despite stronger fundamentals.
Which Stock to Choose?
Wix.com Ltd. has shown a favorable income evolution with 78.86% revenue growth over five years, supported by a strong gross margin of 67.93% and improving profitability. However, its financial ratios present a slightly unfavorable picture, marked by a negative ROE of -175.57%, high debt at 50.7% of assets, and a low current ratio of 0.84, despite a very favorable credit rating.
Oddity Tech Ltd. exhibits robust income growth with 484.83% revenue increase and consistently favorable profitability metrics, including a 15.69% net margin and a positive ROE of 35.95%. Its financial ratios are largely favorable, showing low debt levels at 5.17%, a strong current ratio of 1.79, and a very favorable overall rating reflecting sound financial health and efficient capital use.
Considering the ratings and global financial evaluations, Oddity Tech Ltd. might appear more favorable for risk-averse investors seeking stability and value creation, given its strong profitability and balance sheet. Conversely, Wix.com Ltd. could be more appealing to growth-oriented investors who might tolerate higher risk for potential future gains amid improving profitability.
Disclaimer: Investment carries a risk of loss of initial capital. The past performance is not a reliable indicator of future results. Be sure to understand risks before making an investment decision.
Go Further
I encourage you to read the complete analyses of Wix.com Ltd. and Oddity Tech Ltd. to enhance your investment decisions: