In the rapidly evolving software infrastructure sector, Oddity Tech Ltd. (ODD) and Veritone, Inc. (VERI) stand out for their innovative approaches and market presence. Oddity Tech disrupts traditional beauty and wellness with digital-first brands, while Veritone leads in AI computing solutions across diverse industries. This comparison will explore their strategies, growth potential, and risks to help you decide which company deserves a place in your investment portfolio.

Table of contents
Companies Overview
I will begin the comparison between Oddity Tech Ltd. and Veritone, Inc. by providing an overview of these two companies and their main differences.
Oddity Tech Ltd. Overview
Oddity Tech Ltd. is a consumer-tech company headquartered in Tel Aviv-Jaffa, Israel. It focuses on beauty and wellness products powered by its proprietary PowerMatch technology. The company operates digital-first brands to challenge traditional offline markets, offering a diverse product range under IL MAKIAGE and SpoiledChild brands. Oddity Tech’s market cap stands around 2B USD, reflecting its position in the software-infrastructure sector.
Veritone, Inc. Overview
Veritone, Inc., based in Denver, Colorado, specializes in artificial intelligence computing solutions through its aiWARE platform. It provides AI-driven insights and services across multiple industries including media, government, and legal. With a market cap near 225M USD, Veritone integrates machine learning and cognitive processing technologies to support data analytics and media advertising services within the software-infrastructure industry.
Key similarities and differences
Both Oddity Tech and Veritone operate in the technology sector under the software-infrastructure industry, focusing on innovative tech solutions. Oddity Tech emphasizes consumer-facing digital brands in beauty and wellness, while Veritone concentrates on AI platforms and data analytics for diverse business verticals. Their market capitalizations and geographical bases differ significantly, highlighting their varied scale and focus within technology-driven markets.
Income Statement Comparison
This table presents the latest fiscal year income statement figures for Oddity Tech Ltd. and Veritone, Inc., enabling a direct financial performance comparison.

| Metric | Oddity Tech Ltd. (ODD) | Veritone, Inc. (VERI) |
|---|---|---|
| Market Cap | 2B | 225M |
| Revenue | 647M | 93M |
| EBITDA | 125M | -59M |
| EBIT | 116M | -88M |
| Net Income | 101M | -37M |
| EPS | 1.78 | -0.98 |
| Fiscal Year | 2024 | 2024 |
Income Statement Interpretations
Oddity Tech Ltd.
Oddity Tech Ltd. shows strong growth in revenue and net income from 2020 to 2024, with revenue expanding from 110.6M to 647M and net income rising from 11.7M to 101.5M. Margins have improved notably, with a gross margin of 72.4% and a net margin of 15.7% in 2024. The latest year reflects significant margin expansion and a 27.2% revenue growth, underscoring robust operational efficiency.
Veritone, Inc.
Veritone, Inc. experienced fluctuating revenue, peaking at 150M in 2022 before declining to 92.6M in 2024. Net income remained negative throughout the period, with a slight improvement to -37.4M in 2024 from -64.7M in 2021. Margins are pressured, with a negative EBIT margin of -95.1% in 2024, despite a favorable gross margin near 70.6%. The latest year saw a 7.4% revenue decline but modest net margin and EPS improvements.
Which one has the stronger fundamentals?
Oddity Tech Ltd. presents stronger fundamentals, evidenced by consistent and substantial revenue and net income growth alongside improving margins. Its operating efficiency and profitability metrics are favorable across the period. Veritone, while showing some improvement in net margin and EPS recently, continues to struggle with negative earnings and high interest expenses, reflecting weaker overall income statement health.
Financial Ratios Comparison
Below is a comparison of the most recent key financial ratios for Oddity Tech Ltd. (ODD) and Veritone, Inc. (VERI) for the fiscal year 2024.
| Ratios | Oddity Tech Ltd. (ODD) | Veritone, Inc. (VERI) |
|---|---|---|
| ROE | 35.95% | -277.91% |
| ROIC | 28.56% | -58.27% |
| P/E | 23.75 | -3.34 |
| P/B | 8.54 | 9.27 |
| Current Ratio | 1.79 | 0.97 |
| Quick Ratio | 0.99 | 0.97 |
| D/E (Debt-to-Equity) | 0.08 | 8.91 |
| Debt-to-Assets | 5.17% | 60.54% |
| Interest Coverage | 1521.05 | -7.31 |
| Asset Turnover | 1.47 | 0.47 |
| Fixed Asset Turnover | 19.38 | 8.51 |
| Payout Ratio | 0% | 0% |
| Dividend Yield | 0% | 0% |
Interpretation of the Ratios
Oddity Tech Ltd.
Oddity Tech Ltd. displays strong financial ratios with favorable net margin at 15.69%, ROE at 35.95%, and ROIC at 28.56%, indicating efficient profitability and capital use. However, a high WACC at 18.68% and a steep PB ratio of 8.54 are cautionary. The company does not pay dividends, likely due to reinvestment priorities or growth, with no payout risks.
Veritone, Inc.
Veritone, Inc. shows predominantly weak ratios, including a negative net margin of -40.36%, ROE at -277.91%, and ROIC at -58.27%, reflecting poor profitability and capital efficiency. The firm has a low current ratio of 0.97 and high leverage ratios, indicating financial stress. It also does not pay dividends, consistent with its negative income and possible reinvestment strategy.
Which one has the best ratios?
Oddity Tech Ltd. clearly outperforms Veritone, Inc. with mostly favorable profitability, leverage, and liquidity ratios, signaling stronger financial health. Veritone’s ratios are largely unfavorable, reflecting operational and financial challenges. Consequently, Oddity Tech’s ratio profile is considerably more robust compared to Veritone’s very unfavorable metrics.
Strategic Positioning
This section compares the strategic positioning of Oddity Tech Ltd. and Veritone, Inc., including market position, key segments, and exposure to technological disruption:
Oddity Tech Ltd.
- Market position and competitive pressure
- Key segments and business drivers
- Exposure to technological disruption
Veritone, Inc.
- Operates globally in consumer-tech with a $2.0B market cap; faces high beta indicating volatile competition.
- Focuses on beauty and wellness products using proprietary PowerMatch technology and digital-first brands.
- Disrupts offline-dominated beauty and wellness industries through digital innovation and tech integration.
Oddity Tech Ltd. vs Veritone, Inc. Positioning
Oddity Tech Ltd. concentrates on digital transformation within beauty and wellness, leveraging its technology for brand disruption. Veritone maintains a diversified AI platform across several industries, balancing software and advertising services, which creates varied business drivers and market exposure.
Which has the best competitive advantage?
Oddity Tech Ltd. demonstrates a very favorable moat with growing ROIC above WACC, indicating durable competitive advantage and increasing profitability. Veritone, Inc. shows a very unfavorable moat with declining ROIC below WACC, signaling value destruction and weaker competitive positioning.
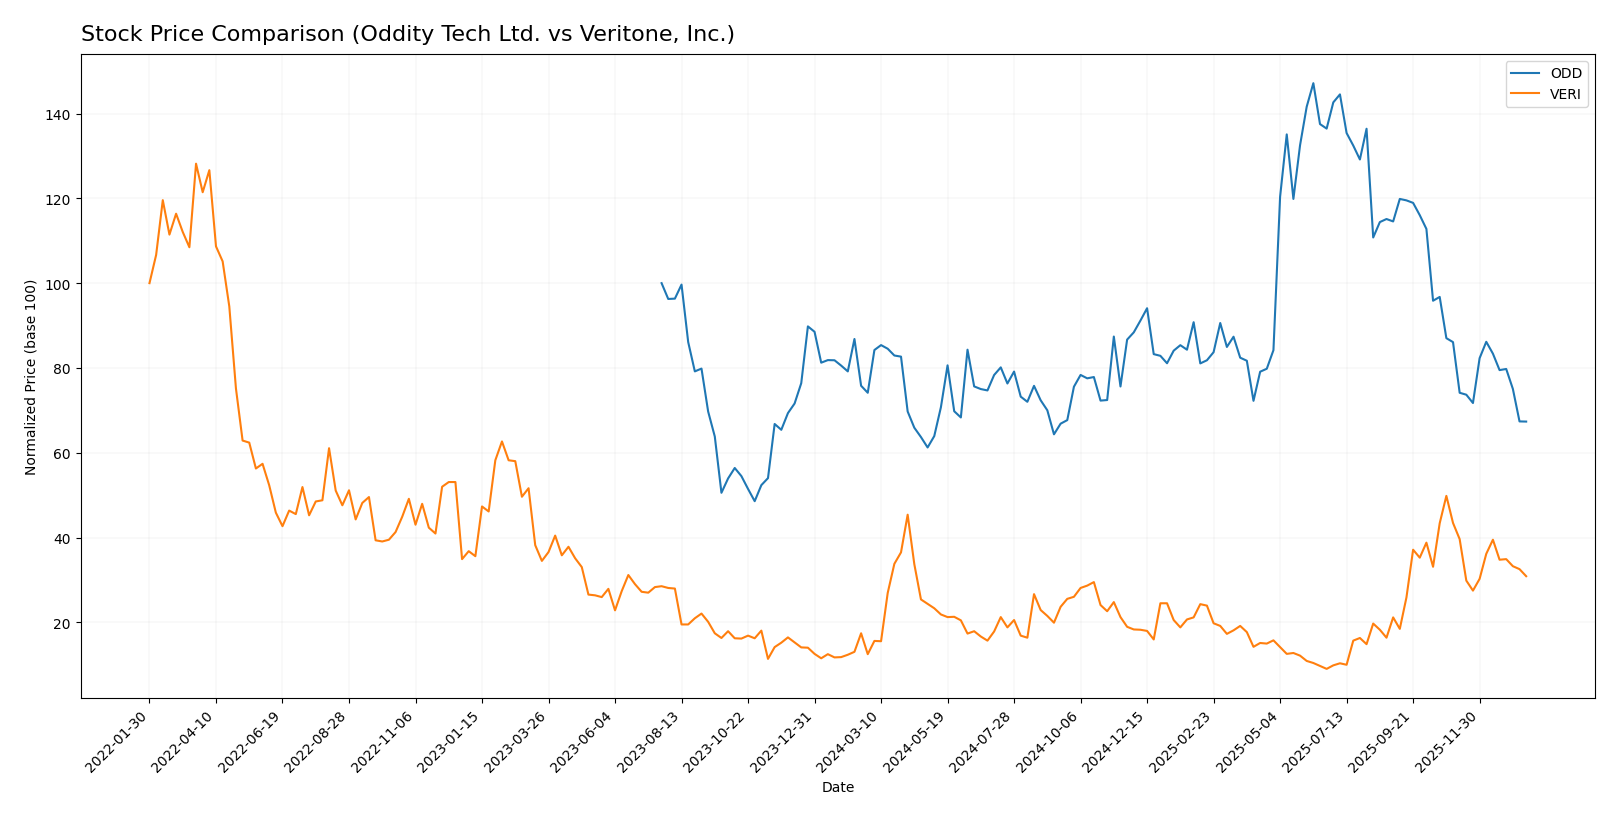
Stock Comparison
The stock price movements of Oddity Tech Ltd. and Veritone, Inc. over the past 12 months reveal contrasting trajectories, with Oddity Tech showing a bearish trend accompanied by decelerating decline, while Veritone exhibits a strong bullish trend despite recent softening.
Trend Analysis
Oddity Tech Ltd. experienced a bearish trend over the past 12 months with a price decline of -9.16%, showing deceleration in its downward momentum. The stock fluctuated between a high of 77.35 and a low of 32.19, with notable volatility (std deviation 11.75).
Veritone, Inc. delivered a bullish trend over the same period, gaining 147.22%, though the rate of increase slowed down. Price ranged from 1.3 to 7.18 with low volatility (std deviation 1.26).
Comparing the two, Veritone outperformed Oddity Tech significantly over the last year, posting the highest market performance despite both facing recent selling pressure.
Target Prices
Analysts provide a positive target price consensus for both Oddity Tech Ltd. and Veritone, Inc.
| Company | Target High | Target Low | Consensus |
|---|---|---|---|
| Oddity Tech Ltd. | 80 | 40 | 66.33 |
| Veritone, Inc. | 10 | 9 | 9.5 |
The consensus target prices for Oddity Tech Ltd. and Veritone, Inc. significantly exceed their current stock prices of 35.4 and 4.45 respectively, indicating bullish analyst expectations.
Analyst Opinions Comparison
This section compares analysts’ ratings and grades for Oddity Tech Ltd. and Veritone, Inc.:
Rating Comparison
Oddity Tech Ltd. Rating
- Rating: B+, categorized as Very Favorable
- Discounted Cash Flow Score: 4, indicating Favorable valuation
- ROE Score: 5, Very Favorable efficiency in generating profit
- ROA Score: 4, Favorable asset utilization
- Debt To Equity Score: 3, Moderate financial risk
- Overall Score: 3, Moderate overall financial standing
Veritone, Inc. Rating
- Rating: C, categorized as Very Favorable
- Discounted Cash Flow Score: 5, indicating Very Favorable valuation
- ROE Score: 1, Very Unfavorable efficiency
- ROA Score: 1, Very Unfavorable asset utilization
- Debt To Equity Score: 1, Very Unfavorable financial risk
- Overall Score: 2, Moderate overall financial standing
Which one is the best rated?
Oddity Tech Ltd. holds a higher rating of B+ with better scores in ROE, ROA, and debt-to-equity, suggesting stronger profitability and moderate risk. Veritone, Inc. has a lower rating C, despite a very favorable discounted cash flow score.
Scores Comparison
The scores comparison between Oddity Tech Ltd. and Veritone, Inc. is as follows:
Oddity Tech Ltd. Scores
- Altman Z-Score: 3.78, indicating a safe zone with low bankruptcy risk.
- Piotroski Score: 6, classified as average financial strength.
Veritone, Inc. Scores
- Altman Z-Score: -0.07, indicating distress zone and high bankruptcy risk.
- Piotroski Score: 3, classified as very weak financial strength.
Which company has the best scores?
Oddity Tech Ltd. shows stronger financial stability with a safe zone Altman Z-Score and average Piotroski Score. Veritone, Inc. is in distress zone with a very weak Piotroski Score, indicating higher financial risk.
Grades Comparison
Here is a comparison of the latest available grades from reputable grading companies for Oddity Tech Ltd. and Veritone, Inc.:
Oddity Tech Ltd. Grades
This table summarizes recent grades awarded to Oddity Tech Ltd. by well-known financial institutions.
| Grading Company | Action | New Grade | Date |
|---|---|---|---|
| Keybanc | Maintain | Overweight | 2026-01-08 |
| JP Morgan | Maintain | Overweight | 2025-12-12 |
| JP Morgan | Maintain | Overweight | 2025-11-21 |
| Barclays | Maintain | Equal Weight | 2025-11-21 |
| Morgan Stanley | Maintain | Equal Weight | 2025-11-21 |
| Needham | Maintain | Buy | 2025-11-20 |
| Keybanc | Maintain | Overweight | 2025-10-08 |
| JMP Securities | Maintain | Market Outperform | 2025-09-23 |
| Morgan Stanley | Maintain | Equal Weight | 2025-08-06 |
| JMP Securities | Maintain | Market Outperform | 2025-08-05 |
Oddity Tech Ltd. consistently receives mostly bullish grades, with several “Overweight” and “Buy” ratings, and no recent downgrades.
Veritone, Inc. Grades
Below is a summary of grades assigned to Veritone, Inc. by recognized grading firms.
| Grading Company | Action | New Grade | Date |
|---|---|---|---|
| D. Boral Capital | Maintain | Buy | 2025-12-09 |
| D. Boral Capital | Maintain | Buy | 2025-12-04 |
| Needham | Maintain | Buy | 2025-12-02 |
| D. Boral Capital | Maintain | Buy | 2025-12-02 |
| D. Boral Capital | Maintain | Buy | 2025-11-07 |
| D. Boral Capital | Maintain | Buy | 2025-10-28 |
| HC Wainwright & Co. | Maintain | Buy | 2025-10-20 |
| D. Boral Capital | Maintain | Buy | 2025-10-15 |
| D. Boral Capital | Maintain | Buy | 2025-09-24 |
| D. Boral Capital | Maintain | Buy | 2025-09-09 |
Veritone, Inc. has a steady pattern of “Buy” ratings from multiple firms, indicating a positive consensus without recent changes.
Which company has the best grades?
Oddity Tech Ltd. has a broader mix of positive grades, including several “Overweight” and “Market Outperform” ratings, while Veritone, Inc. shows a consistent “Buy” consensus. For investors, Oddity’s higher variation in bullish grades could suggest stronger endorsement by some analysts, whereas Veritone’s steadiness reflects consistent but potentially less aggressive optimism.
Strengths and Weaknesses
Below is a comparison table presenting the strengths and weaknesses of Oddity Tech Ltd. (ODD) and Veritone, Inc. (VERI) based on their recent financial performance, competitive advantages, and market positions.
| Criterion | Oddity Tech Ltd. (ODD) | Veritone, Inc. (VERI) |
|---|---|---|
| Diversification | Focused with strong profitability in core areas | More diversified revenue streams but less stable |
| Profitability | High net margin (15.69%), ROIC 28.56% (favorable) | Negative net margin (-40.36%), negative ROIC (-58.27%) |
| Innovation | Demonstrates durable competitive advantage with growing ROIC | Innovation present but profitability declining, losing value |
| Global presence | Solid and efficient capital use, growing global moat | Weaker global moat, value destruction evident |
| Market Share | Increasing profitability and efficient asset turnover | Market share challenged by poor financial health and high debt |
Key takeaways: Oddity Tech Ltd. shows strong financial health with favorable profitability and a durable competitive advantage, making it a value creator. Conversely, Veritone, Inc. struggles with declining profitability, high debt, and value destruction, posing a higher risk for investors.
Risk Analysis
Below is a comparison of key risks for Oddity Tech Ltd. (ODD) and Veritone, Inc. (VERI) based on the most recent financial and market data.
| Metric | Oddity Tech Ltd. (ODD) | Veritone, Inc. (VERI) |
|---|---|---|
| Market Risk | High beta (3.18) implies high volatility | Moderate beta (2.05) indicates notable volatility |
| Debt level | Low debt-to-equity (0.08), debt-to-assets 5.17% (favorable) | High debt-to-equity (8.91), debt-to-assets 60.54% (unfavorable) |
| Regulatory Risk | Moderate, operates globally but based in Israel | Moderate, operates in US & UK with AI compliance challenges |
| Operational Risk | Moderate, digital-first beauty tech with steady margins | High, negative net margin (-40.36%) and operational losses |
| Environmental Risk | Low, primarily software & beauty products | Low, software-oriented AI solutions with low environmental footprint |
| Geopolitical Risk | Moderate, based in Israel with regional tensions | Moderate, US-based but exposed to global client base |
In synthesis, Oddity Tech Ltd. presents lower financial risk with strong profitability and manageable debt, but carries high market volatility. Veritone faces significant financial and operational risks, including high leverage, negative profitability, and distress-level bankruptcy risk, demanding cautious consideration.
Which Stock to Choose?
Oddity Tech Ltd. (ODD) shows strong income growth with a 27.2% revenue increase in 2024 and a 15.69% net margin. Financial ratios are mostly favorable, including a 35.95% ROE and low debt levels, supported by a B+ rating and a very favorable moat indicating durable value creation.
Veritone, Inc. (VERI) experienced a 7.35% revenue decline in 2024 and a negative net margin of -40.36%. Most financial ratios are very unfavorable, including a -277.91% ROE and high debt, despite a C rating and a very unfavorable moat indicating declining profitability and value destruction.
Based on their ratings and financial evaluations, Oddity Tech Ltd. could appear more suitable for investors prioritizing quality and growth, while Veritone, Inc. might be considered by those with a higher risk tolerance seeking turnaround opportunities amid financial challenges.
Disclaimer: Investment carries a risk of loss of initial capital. The past performance is not a reliable indicator of future results. Be sure to understand risks before making an investment decision.
Go Further
I encourage you to read the complete analyses of Oddity Tech Ltd. and Veritone, Inc. to enhance your investment decisions: