VeriSign, Inc. and Oddity Tech Ltd. represent two dynamic players within the software infrastructure sector, yet they serve distinct markets—VeriSign anchors internet stability and domain services, while Oddity innovates in consumer tech with digital-first beauty and wellness brands. Their shared focus on technology and innovation invites a compelling comparison. In this article, I will help you determine which company offers the most promising opportunity for your investment portfolio.
Table of contents
Companies Overview
I will begin the comparison between VeriSign and Oddity Tech by providing an overview of these two companies and their main differences.
VeriSign Overview
VeriSign, Inc. is a key player in internet infrastructure, providing domain name registry services that enable global internet navigation. It manages critical components like the root zone and authoritative resolution for the .com and .net domains, supporting worldwide e-commerce. Headquartered in Reston, Virginia, VeriSign focuses on security, stability, and resiliency of internet infrastructure with a market cap of 23.1B USD.
Oddity Tech Overview
Oddity Tech Ltd. operates as a global consumer-tech company specializing in beauty and wellness products enabled by its PowerMatch technology. Based in Tel Aviv-Jaffa, Israel, Oddity builds digital-first brands to disrupt traditional offline beauty industries. The company offers diverse skincare and cosmetic products under brands like IL MAKIAGE and SpoiledChild, with a market cap of 2B USD.
Key similarities and differences
Both VeriSign and Oddity Tech belong to the technology sector but serve distinct markets: VeriSign focuses on internet infrastructure and domain services, while Oddity targets consumer beauty and wellness tech. VeriSign is a well-established company with a lower beta of 0.77, indicating more stable stock, whereas Oddity has a higher beta of 3.18, reflecting greater volatility and growth potential in a newer market segment.
Income Statement Comparison
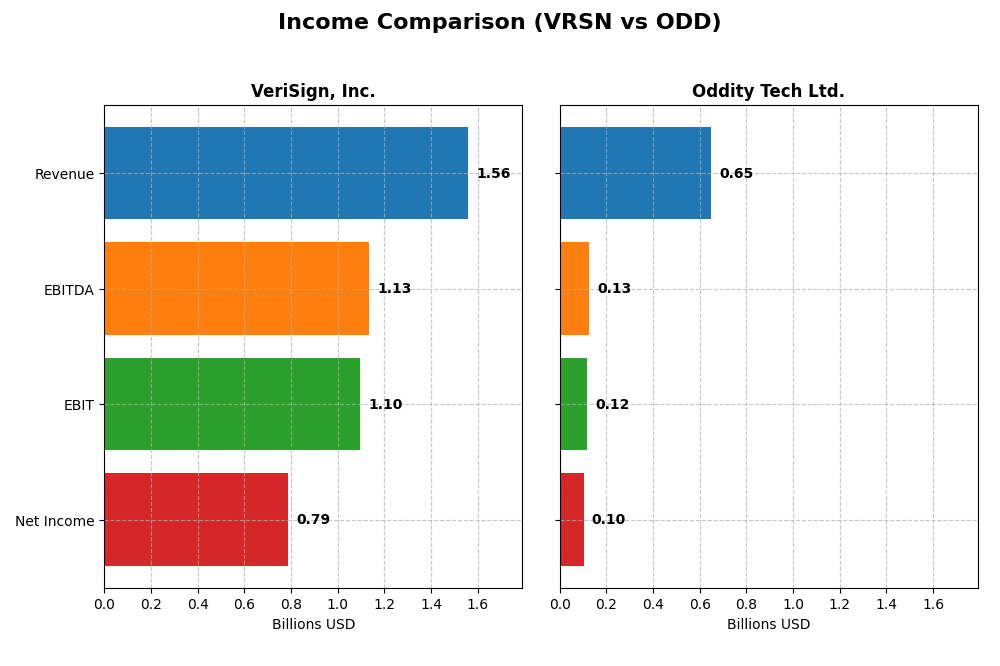
The table below provides a side-by-side comparison of key income statement metrics for VeriSign, Inc. and Oddity Tech Ltd. for the fiscal year 2024.
| Metric | VeriSign, Inc. (VRSN) | Oddity Tech Ltd. (ODD) |
|---|---|---|
| Market Cap | 23.1B | 2.01B |
| Revenue | 1.56B | 647M |
| EBITDA | 1.13B | 125M |
| EBIT | 1.10B | 116M |
| Net Income | 786M | 101M |
| EPS | 8.01 | 1.78 |
| Fiscal Year | 2024 | 2024 |
Income Statement Interpretations
VeriSign, Inc.
VeriSign’s revenue showed a steady increase from 1.27B in 2020 to 1.56B in 2024, reflecting a 23.11% growth over five years. Net income fluctuated, ending at 785.7M in 2024, down from 817.6M in 2023, with net margin declining by 21.68% over the period. The 2024 year saw moderate revenue growth but a slight contraction in net margin, indicating mixed profit dynamics.
Oddity Tech Ltd.
Oddity’s revenue surged from 110.6M in 2020 to 647M in 2024, marking a remarkable 484.83% growth. Net income expanded dramatically from 11.7M to 101.5M, with net margin improving substantially by 48.16%. The latest year showed strong acceleration in revenue, gross profit, and net margin growth, underscoring robust operational scaling and margin enhancement.
Which one has the stronger fundamentals?
Oddity Tech demonstrates stronger income statement fundamentals with consistent, substantial growth in revenue, net income, and margins, all rated favorable. VeriSign, while showing solid margins and steady revenue gains, experienced net income and margin declines, reflecting less dynamic income growth. Overall, Oddity’s income statement portrays more pronounced expansion and margin improvement.
Financial Ratios Comparison
The table below presents key financial ratios for VeriSign, Inc. (VRSN) and Oddity Tech Ltd. (ODD) based on their most recent fiscal year data ending 2024.
| Ratios | VeriSign, Inc. (VRSN) | Oddity Tech Ltd. (ODD) |
|---|---|---|
| ROE | -40.1% | 35.9% |
| ROIC | 4.51% | 28.6% |
| P/E | 25.8 | 23.7 |
| P/B | -10.4 | 8.54 |
| Current Ratio | 0.43 | 1.79 |
| Quick Ratio | 0.43 | 0.99 |
| D/E (Debt-to-Equity) | -0.92 | 0.08 |
| Debt-to-Assets | 128.1% | 5.17% |
| Interest Coverage | 14.1 | 1521.1 |
| Asset Turnover | 1.11 | 1.47 |
| Fixed Asset Turnover | 6.66 | 19.38 |
| Payout Ratio | 0 | 0 |
| Dividend Yield | 0 | 0 |
Interpretation of the Ratios
VeriSign, Inc.
VeriSign shows a mix of strong and weak ratios, with a favorable net margin of 50.45% and high return on invested capital at 451.0%, yet an unfavorable return on equity at -40.13% and a low current ratio of 0.43, indicating liquidity concerns. The company pays dividends, but the dividend yield is nil, suggesting limited shareholder returns from dividends currently.
Oddity Tech Ltd.
Oddity Tech’s ratios mostly appear favorable, with a 15.69% net margin and solid return on equity at 35.95%. The company has a strong current ratio of 1.79 and low debt-to-assets at 5.17%, reflecting good financial health. Oddity does not pay dividends, likely reinvesting profits to support growth and innovation in its consumer-tech segment.
Which one has the best ratios?
Oddity Tech displays a higher percentage of favorable ratios (64.29%) compared to VeriSign’s 57.14%, with stronger liquidity and equity returns. VeriSign’s higher leverage and weaker liquidity ratios contrast with Oddity’s more balanced profile. Both companies have favorable global opinions, but Oddity’s ratios suggest a more stable financial position overall.
Strategic Positioning
This section compares the strategic positioning of VeriSign and Oddity Tech, focusing on market position, key segments, and exposure to technological disruption:
VeriSign, Inc.
- Dominant domain registry with strong competitive moat, operating key internet infrastructure globally.
- Focused on internet infrastructure and domain name services, supporting global e-commerce and security.
- Operates critical internet root servers, less exposed to fast technological disruption in consumer trends.
Oddity Tech Ltd.
- Consumer-tech disruptor in beauty and wellness, facing intense competition and high beta volatility.
- Concentrated on digital-first beauty and wellness brands using proprietary PowerMatch technology.
- High exposure to disruption through digital innovation in offline-dominated beauty industry.
VeriSign, Inc. vs Oddity Tech Ltd. Positioning
VeriSign pursues a concentrated strategy centered on internet infrastructure and domain registry with a durable competitive advantage. Oddity Tech targets niche consumer markets with digital innovation but faces higher market volatility and competitive pressure.
Which has the best competitive advantage?
Both companies demonstrate a very favorable moat with growing ROIC, but VeriSign’s dominant infrastructure role and larger scale provide a stronger and more durable competitive advantage compared to Oddity Tech’s emerging consumer-tech position.
Stock Comparison
The past year’s stock price movements reveal contrasting trends between VeriSign, Inc. and Oddity Tech Ltd., with VeriSign showing sustained gains amid decelerating momentum, while Oddity Tech exhibits a declining trajectory with increased seller dominance.
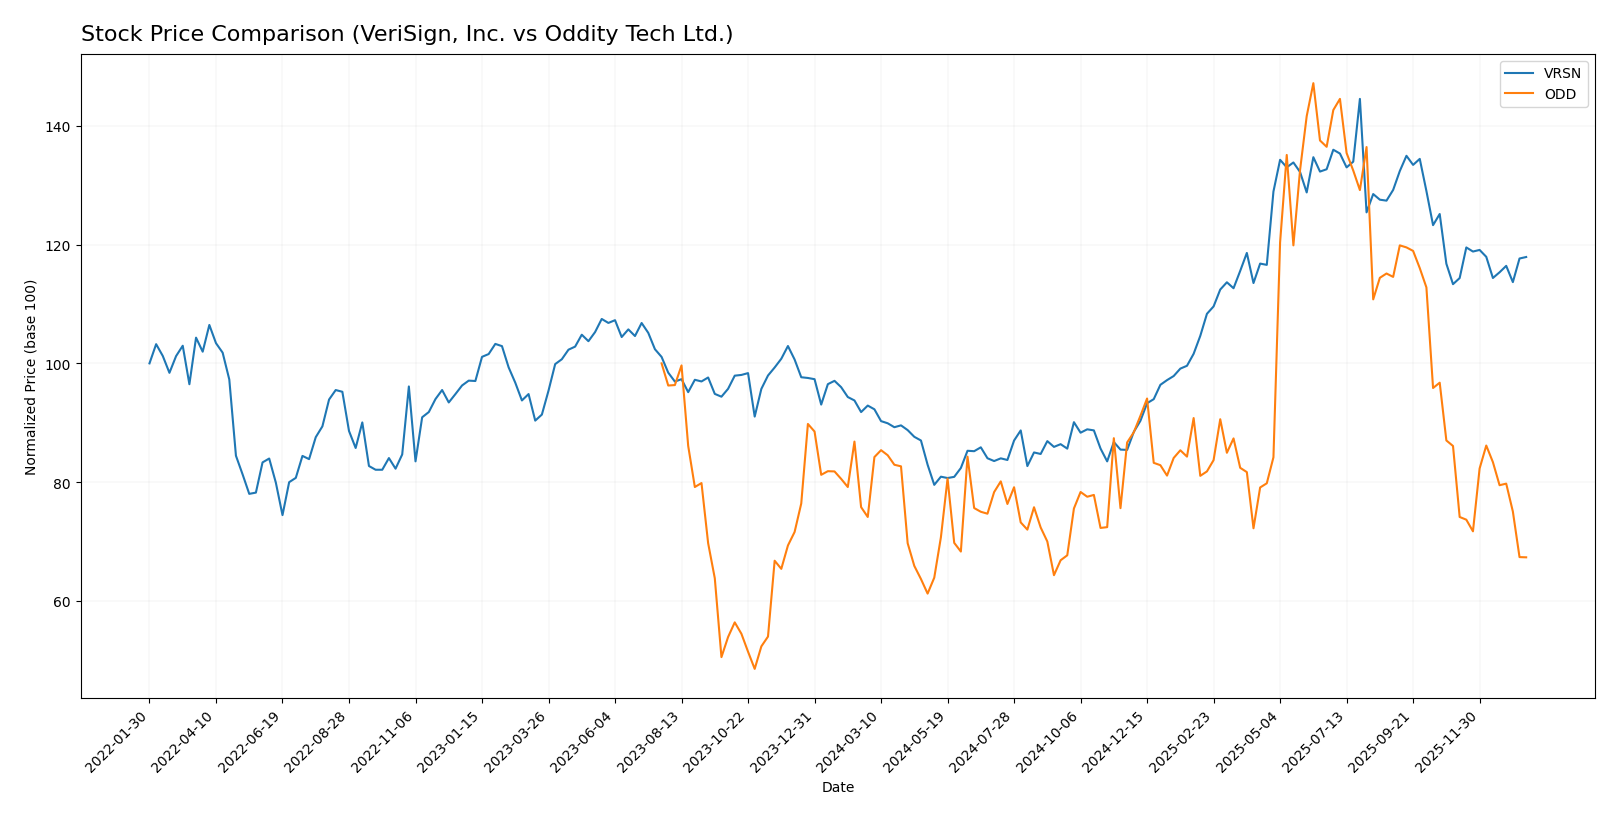
Trend Analysis
VeriSign, Inc. recorded a bullish trend with a 26.92% price increase over the past 12 months, peaking at 305.79 and bottoming at 168.32; however, the trend shows deceleration despite notable volatility (std dev 40.88).
Oddity Tech Ltd. experienced a bearish trend with a 9.16% decline over the same period, accompanied by decelerating downside and lower volatility (std dev 11.75), with a high of 77.35 and a low of 32.19.
Comparing both, VeriSign outperformed Oddity Tech in market performance over the past year, registering positive returns against Oddity Tech’s negative price change.
Target Prices
Analysts provide a clear consensus on target prices for VeriSign, Inc. and Oddity Tech Ltd.
| Company | Target High | Target Low | Consensus |
|---|---|---|---|
| VeriSign, Inc. | 325 | 325 | 325 |
| Oddity Tech Ltd. | 80 | 40 | 66.33 |
VeriSign’s target price of 325 is significantly above its current price of 249.47, indicating strong upside potential. Oddity Tech’s consensus target of 66.33 is nearly double its current 35.4 price, reflecting high growth expectations despite its greater volatility risk.
Analyst Opinions Comparison
This section compares analysts’ ratings and financial grades for VeriSign, Inc. and Oddity Tech Ltd.:
Rating Comparison
VeriSign, Inc. Rating
- Rating: B-, considered very favorable by analysts
- Discounted Cash Flow Score: 4, indicating favorable valuation
- ROE Score: 1, very unfavorable efficiency in generating shareholder profit
- ROA Score: 5, very favorable asset utilization
- Debt To Equity Score: 1, very unfavorable financial risk profile
- Overall Score: 2, moderate overall financial standing
Oddity Tech Ltd. Rating
- Rating: B+, considered very favorable by analysts
- Discounted Cash Flow Score: 4, indicating favorable valuation
- ROE Score: 5, very favorable efficiency in generating shareholder profit
- ROA Score: 4, favorable asset utilization
- Debt To Equity Score: 3, moderate financial risk profile
- Overall Score: 3, moderate overall financial standing
Which one is the best rated?
Oddity Tech Ltd. holds a higher overall rating (B+) and better scores in ROE, ROA, and debt management, indicating a stronger financial profile compared to VeriSign’s B- rating and weaker equity and debt scores.
Scores Comparison
Here is a comparison of the Altman Z-Score and Piotroski Score for VeriSign, Inc. and Oddity Tech Ltd.:
VRSN Scores
- Altman Z-Score: -4.67, indicating financial distress and high bankruptcy risk.
- Piotroski Score: 8, classified as very strong financial health.
ODD Scores
- Altman Z-Score: 3.78, indicating a safe zone and low bankruptcy risk.
- Piotroski Score: 6, classified as average financial health.
Which company has the best scores?
Based on the provided data, Oddity Tech Ltd. has a much stronger Altman Z-Score indicating financial safety, while VeriSign, Inc. has a significantly higher Piotroski Score reflecting stronger financial health. Each company leads in a different score category.
Grades Comparison
Here is a detailed comparison of the latest grades from reputable grading companies for VeriSign, Inc. and Oddity Tech Ltd.:
VeriSign, Inc. Grades
The table below summarizes recent grades assigned to VeriSign, Inc. by well-known financial institutions.
| Grading Company | Action | New Grade | Date |
|---|---|---|---|
| JP Morgan | Maintain | Neutral | 2026-01-06 |
| Baird | Maintain | Outperform | 2025-07-01 |
| Baird | Maintain | Outperform | 2025-04-25 |
| Baird | Maintain | Outperform | 2025-04-01 |
| Citigroup | Maintain | Buy | 2025-02-04 |
| Citigroup | Maintain | Buy | 2025-01-03 |
| Baird | Upgrade | Outperform | 2024-12-09 |
| Baird | Maintain | Neutral | 2024-06-27 |
| Baird | Maintain | Neutral | 2024-04-26 |
| Citigroup | Maintain | Buy | 2024-04-02 |
VeriSign’s grades generally trend from Neutral towards Outperform and Buy, reflecting a stable to improving outlook from major firms.
Oddity Tech Ltd. Grades
Below are recent grades for Oddity Tech Ltd. from recognized financial institutions.
| Grading Company | Action | New Grade | Date |
|---|---|---|---|
| Keybanc | Maintain | Overweight | 2026-01-08 |
| JP Morgan | Maintain | Overweight | 2025-12-12 |
| JP Morgan | Maintain | Overweight | 2025-11-21 |
| Barclays | Maintain | Equal Weight | 2025-11-21 |
| Morgan Stanley | Maintain | Equal Weight | 2025-11-21 |
| Needham | Maintain | Buy | 2025-11-20 |
| Keybanc | Maintain | Overweight | 2025-10-08 |
| JMP Securities | Maintain | Market Outperform | 2025-09-23 |
| Morgan Stanley | Maintain | Equal Weight | 2025-08-06 |
| JMP Securities | Maintain | Market Outperform | 2025-08-05 |
Oddity Tech maintains a consistent rating mostly in the Overweight to Market Outperform range, indicating positive but cautious sentiment.
Which company has the best grades?
Both companies hold a consensus “Buy” rating, but VeriSign shows several Outperform and Buy grades while Oddity Tech’s ratings cluster around Overweight and Market Outperform. VeriSign’s stronger grades could imply higher growth expectations, potentially attracting investors seeking more assertive performance forecasts.
Strengths and Weaknesses
Below is a comparative overview of key strengths and weaknesses for VeriSign, Inc. (VRSN) and Oddity Tech Ltd. (ODD) based on the most recent financial and strategic data.
| Criterion | VeriSign, Inc. (VRSN) | Oddity Tech Ltd. (ODD) |
|---|---|---|
| Diversification | Moderate – focused on domain name registry | Moderate – technology sector, less diversified |
| Profitability | High net margin (50.45%) but negative ROE | Moderate net margin (15.69%) with strong ROE |
| Innovation | Strong innovation indicated by very high ROIC growth (451%) | Good innovation with solid ROIC (28.56%) and growth |
| Global presence | Established global player in internet infrastructure | Growing global footprint, smaller scale |
| Market Share | Dominant in domain name registry market | Smaller market share but expanding |
Key takeaways: VeriSign demonstrates exceptional profitability and a durable competitive moat with very high returns on invested capital, albeit with some balance sheet concerns. Oddity Tech shows solid growth and profitability with better liquidity and lower leverage, positioning it well for future expansion but with less dominance. Both companies offer attractive investment qualities depending on risk tolerance and portfolio focus.
Risk Analysis
Below is a comparative table summarizing key risk metrics for VeriSign, Inc. (VRSN) and Oddity Tech Ltd. (ODD) based on the latest 2024 data:
| Metric | VeriSign, Inc. (VRSN) | Oddity Tech Ltd. (ODD) |
|---|---|---|
| Market Risk | Beta 0.77 (lower volatility) | Beta 3.18 (high volatility) |
| Debt level | Debt-to-Assets 128.08% (high leverage) | Debt-to-Assets 5.17% (low leverage) |
| Regulatory Risk | Moderate (US tech sector regulations) | Moderate (consumer-tech, Israel) |
| Operational Risk | Moderate (infrastructure dependency) | Moderate (brand scaling challenges) |
| Environmental Risk | Low (software infrastructure) | Low (consumer products) |
| Geopolitical Risk | Moderate (US-based, global internet services) | Higher (based in Israel, geopolitical tensions) |
VeriSign faces significant financial leverage risk with a debt-to-assets ratio above 128%, despite stable market volatility and strong operational metrics. Oddity Tech shows higher market risk due to its elevated beta but benefits from low debt and solid financial stability. Geopolitical tensions pose a notable risk for Oddity given its Israel base. Investors should weigh leverage concerns for VeriSign against market volatility and geopolitical exposure for Oddity.
Which Stock to Choose?
VeriSign, Inc. (VRSN) shows a generally favorable income evolution with 57% positive income statement metrics despite a slight net margin decline. Its financial ratios are 57% favorable, highlighting strong ROIC (451%) and asset turnover, but weak ROE (-40%) and liquidity. Debt levels are mixed, with high debt-to-assets but good interest coverage. Ratings are very favorable overall with a B- score.
Oddity Tech Ltd. (ODD) exhibits robust income growth, fully favorable in income metrics, with strong revenue and net income expansion over recent years. Its financial ratios are 64% favorable, supported by solid ROE (36%), liquidity, and low debt ratios, though WACC is relatively high. Ratings are also very favorable with a B+ score, reflecting solid profitability and financial stability.
For investors, VRSN could appear attractive for those valuing high capital efficiency and stable income quality despite some leverage concerns. ODD might appeal more to growth-oriented or risk-tolerant profiles, given its strong income growth, healthier liquidity, and improving returns. Both exhibit durable moats but differ in financial structure and market trends, which may influence investor preference depending on risk tolerance and investment strategy.
Disclaimer: Investment carries a risk of loss of initial capital. The past performance is not a reliable indicator of future results. Be sure to understand risks before making an investment decision.
Go Further
I encourage you to read the complete analyses of VeriSign, Inc. and Oddity Tech Ltd. to enhance your investment decisions: