In today’s dynamic technology sector, UiPath Inc. and Oddity Tech Ltd. stand out as innovative players with distinct approaches. UiPath leads in robotic process automation, streamlining enterprise workflows globally, while Oddity Tech disrupts the beauty and wellness market through digital-first consumer technology. Both companies share a software infrastructure focus but target different markets. This article will help you uncover which company offers the most promising investment potential.
Table of contents
Companies Overview
I will begin the comparison between UiPath Inc. and Oddity Tech Ltd. by providing an overview of these two companies and their main differences.
UiPath Inc. Overview
UiPath Inc. operates as a technology company focused on providing an end-to-end automation platform with robotic process automation (RPA) solutions. Its platform integrates artificial intelligence with low-code development environments to automate business processes across various sectors like banking and healthcare. Headquartered in New York, UiPath serves primarily the US, Romania, and Japan markets, emphasizing enterprise automation and compliance.
Oddity Tech Ltd. Overview
Oddity Tech Ltd. is a consumer-tech company specializing in beauty and wellness products, leveraging its PowerMatch technology to disrupt traditional offline industries. The company builds digital-first brands, offering skincare, hair care, and cosmetic products under names like IL MAKIAGE and SpoiledChild. Based in Tel Aviv-Jaffa, Israel, Oddity Tech operates globally and focuses on innovation within the beauty and wellness sector.
Key similarities and differences
Both UiPath and Oddity Tech operate within the technology sector but serve fundamentally different markets—enterprise automation versus consumer beauty products. UiPath’s business model centers on software infrastructure and automation platforms, while Oddity Tech focuses on digital brand building and product innovation in wellness. Their geographic focuses differ, with UiPath anchored in the US and Oddity Tech in Israel, reflecting diverse market strategies and customer bases.
Income Statement Comparison
This table presents a side-by-side comparison of key income statement metrics for UiPath Inc. and Oddity Tech Ltd. for their most recent fiscal years, highlighting differences in scale and profitability.

| Metric | UiPath Inc. (PATH) | Oddity Tech Ltd. (ODD) |
|---|---|---|
| Market Cap | 7.7B | 2.0B |
| Revenue | 1.43B | 647M |
| EBITDA | -145M | 125M |
| EBIT | -163M | 116M |
| Net Income | -74M | 101M |
| EPS | -0.13 | 1.78 |
| Fiscal Year | 2025 | 2024 |
Income Statement Interpretations
UiPath Inc.
Over the 2021-2025 period, UiPath Inc. showed consistent revenue growth, reaching $1.43B in 2025 with a 9.3% increase from 2024. Gross margins remained high at 82.7%, but EBIT and net margins stayed negative, though net margin improved by 25% in the latest year. The 2025 results reflect stabilized profitability pressures despite ongoing operating losses.
Oddity Tech Ltd.
From 2020 to 2024, Oddity Tech Ltd. experienced rapid revenue growth, hitting $647M in 2024 with a 27.2% year-over-year rise. Gross margin held favorably at 72.4%, while EBIT and net margins improved significantly to 17.9% and 15.7% respectively. The 2024 performance showed accelerated profitability gains alongside strong top-line expansion.
Which one has the stronger fundamentals?
Oddity Tech demonstrates stronger fundamentals with robust revenue and net income growth, consistently positive EBIT and net margins, and an entirely favorable income statement evaluation. UiPath, while growing revenue and improving net margin, continues to report operating losses and negative net income, reflecting less stable profitability fundamentals over the period.
Financial Ratios Comparison
The table below compares key financial ratios for UiPath Inc. (PATH) and Oddity Tech Ltd. (ODD) based on their most recent full fiscal year data.
| Ratios | UiPath Inc. (PATH) 2025 | Oddity Tech Ltd. (ODD) 2024 |
|---|---|---|
| ROE | -3.99% | 35.95% |
| ROIC | -7.41% | 28.56% |
| P/E | -108.0 | 23.75 |
| P/B | 4.31 | 8.54 |
| Current Ratio | 2.93 | 1.79 |
| Quick Ratio | 2.93 | 0.99 |
| D/E | 0.042 | 0.080 |
| Debt-to-Assets | 2.72% | 5.17% |
| Interest Coverage | 0 | 1521.1 |
| Asset Turnover | 0.50 | 1.47 |
| Fixed Asset Turnover | 14.41 | 19.38 |
| Payout ratio | 0 | 0 |
| Dividend yield | 0 | 0 |
Interpretation of the Ratios
UiPath Inc.
UiPath shows a mixed ratio profile with a slightly unfavorable global opinion. While liquidity ratios such as current and quick ratios at 2.93 are strong, profitability metrics like net margin (-5.15%) and return on equity (-3.99%) are weak. The company carries low debt levels and good fixed asset turnover, but poor interest coverage and asset turnover raise concerns. UiPath does not pay dividends, likely reflecting reinvestment priorities during ongoing growth.
Oddity Tech Ltd.
Oddity Tech presents a favorable ratio assessment, with strong profitability indicated by a 15.69% net margin and 35.95% return on equity. Liquidity is adequate, with a current ratio of 1.79, though the quick ratio is neutral at 0.99. Debt levels remain low and interest coverage is excellent at 1521.05. The absence of dividends suggests a focus on reinvestment and expansion rather than shareholder payouts.
Which one has the best ratios?
Oddity Tech holds the advantage with predominantly favorable ratios, including higher profitability and strong coverage metrics. UiPath’s financials show strengths in liquidity and asset efficiency but are offset by negative profitability and coverage ratios, leading to a slightly unfavorable overall evaluation compared to Oddity Tech’s favorable standing.
Strategic Positioning
This section compares the strategic positioning of UiPath Inc. and Oddity Tech Ltd. regarding market position, key segments, and exposure to technological disruption:
UiPath Inc.
- Leading software infrastructure provider with $7.7B market cap and moderate competitive pressure
- Focused on robotic process automation with licenses, subscriptions, and professional services
- Combines AI with automation software, leveraging low-code and centralized management tools
Oddity Tech Ltd.
- Smaller consumer-tech firm with $2B market cap, facing higher volatility and competition
- Concentrates on beauty and wellness products using proprietary PowerMatch technology
- Digital-first brand disrupting offline beauty and wellness markets through technology
UiPath Inc. vs Oddity Tech Ltd. Positioning
UiPath operates a diversified automation platform across industries, benefiting from scale and recurring revenue streams. Oddity Tech concentrates on niche consumer products, leveraging proprietary technology for market disruption but with less diversification.
Which has the best competitive advantage?
Oddity Tech shows a very favorable MOAT with growing ROIC above WACC, indicating durable competitive advantage. UiPath’s MOAT is slightly unfavorable despite improving ROIC, signaling ongoing value destruction but potential profitability growth.
Stock Comparison
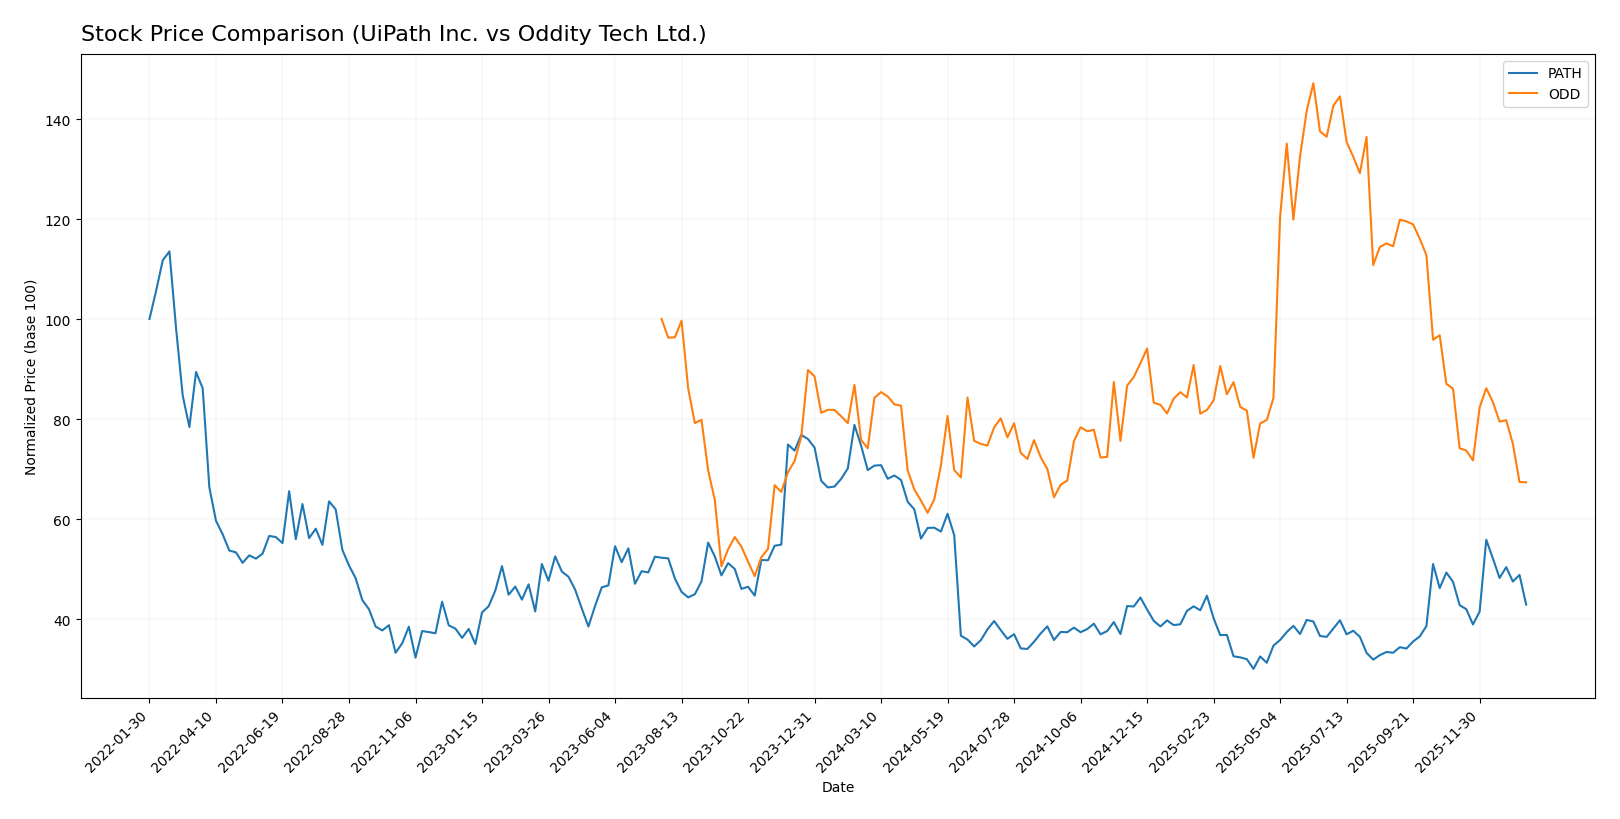
The past year has seen notable bearish trends for both UiPath Inc. and Oddity Tech Ltd., with significant price declines and shifting trading volumes shaping their market dynamics.
Trend Analysis
UiPath Inc. (PATH) experienced a 38.53% price decline over the past 12 months, indicating a bearish trend with accelerating downward momentum and a notable price range between 23.66 and 10.04.
Oddity Tech Ltd. (ODD) showed a 9.16% price decline over the past year, also bearish but with decelerating trend dynamics and higher volatility, fluctuating between 77.35 and 32.19.
Comparing both stocks, UiPath’s larger percentage drop of -38.53% means Oddity Tech delivered the relatively better market performance over the 12-month period.
Target Prices
The current analyst consensus for target prices reflects a cautiously optimistic view on both UiPath Inc. and Oddity Tech Ltd.
| Company | Target High | Target Low | Consensus |
|---|---|---|---|
| UiPath Inc. | 19 | 14 | 16.6 |
| Oddity Tech Ltd. | 80 | 40 | 66.33 |
Analysts expect UiPath’s price to rise moderately above the current 14.34 USD, while Oddity Tech shows a stronger upside potential compared to its current 35.4 USD. Both targets suggest room for growth but with varying risk profiles.
Analyst Opinions Comparison
This section compares analysts’ ratings and grades for UiPath Inc. and Oddity Tech Ltd.:
Rating Comparison
UiPath Inc. Rating
- Rating: B+, considered very favorable by analysts.
- Discounted Cash Flow Score: Moderate at 3.
- ROE Score: Favorable at 4, showing efficient profit use.
- ROA Score: Favorable at 4, effective asset utilization.
- Debt To Equity Score: Favorable at 4, indicating lower risk.
- Overall Score: Moderate at 3, reflecting balanced metrics.
Oddity Tech Ltd. Rating
- Rating: B+, also rated very favorable by analysts.
- Discounted Cash Flow Score: Favorable at 4.
- ROE Score: Very favorable at 5, indicating excellent efficiency.
- ROA Score: Favorable at 4, similarly effective use of assets.
- Debt To Equity Score: Moderate at 3, implying higher leverage.
- Overall Score: Moderate at 3, indicating comparable overall standing.
Which one is the best rated?
Both companies share the same overall rating of B+ and overall score of 3. Oddity Tech Ltd. scores higher in discounted cash flow and ROE, while UiPath Inc. has a better debt to equity score, making their ratings comparable with differing strengths.
Scores Comparison
Here is a comparison of the Altman Z-Score and Piotroski Score for UiPath Inc. and Oddity Tech Ltd.:
UiPath Inc. Scores
- Altman Z-Score: 5.27, indicating a safe zone
- Piotroski Score: 7, classified as strong
Oddity Tech Ltd. Scores
- Altman Z-Score: 3.78, indicating a safe zone
- Piotroski Score: 6, classified as average
Which company has the best scores?
UiPath Inc. shows a higher Altman Z-Score and a stronger Piotroski Score compared to Oddity Tech Ltd., indicating relatively better financial health based on these metrics.
Grades Comparison
The grades awarded by reputable financial institutions to UiPath Inc. and Oddity Tech Ltd. are summarized below:
UiPath Inc. Grades
The following table shows recent grades assigned to UiPath Inc. by well-known grading companies.
| Grading Company | Action | New Grade | Date |
|---|---|---|---|
| Barclays | Maintain | Equal Weight | 2026-01-12 |
| RBC Capital | Maintain | Sector Perform | 2026-01-05 |
| RBC Capital | Maintain | Sector Perform | 2025-12-10 |
| Morgan Stanley | Maintain | Equal Weight | 2025-12-09 |
| DA Davidson | Maintain | Neutral | 2025-12-05 |
| Canaccord Genuity | Maintain | Buy | 2025-12-04 |
| Mizuho | Maintain | Neutral | 2025-12-04 |
| RBC Capital | Maintain | Sector Perform | 2025-12-04 |
| Wells Fargo | Maintain | Equal Weight | 2025-12-04 |
| Evercore ISI Group | Maintain | In Line | 2025-12-04 |
Overall, UiPath’s grades show a consistent pattern of “Equal Weight” and “Sector Perform,” indicating moderate confidence without strong momentum.
Oddity Tech Ltd. Grades
Below is the table presenting Oddity Tech Ltd.’s recent grades from established grading companies.
| Grading Company | Action | New Grade | Date |
|---|---|---|---|
| Keybanc | Maintain | Overweight | 2026-01-08 |
| JP Morgan | Maintain | Overweight | 2025-12-12 |
| JP Morgan | Maintain | Overweight | 2025-11-21 |
| Barclays | Maintain | Equal Weight | 2025-11-21 |
| Morgan Stanley | Maintain | Equal Weight | 2025-11-21 |
| Needham | Maintain | Buy | 2025-11-20 |
| Keybanc | Maintain | Overweight | 2025-10-08 |
| JMP Securities | Maintain | Market Outperform | 2025-09-23 |
| Morgan Stanley | Maintain | Equal Weight | 2025-08-06 |
| JMP Securities | Maintain | Market Outperform | 2025-08-05 |
Oddity Tech’s grades predominantly fall in the “Overweight” and “Market Outperform” categories, reflecting a generally optimistic outlook by analysts.
Which company has the best grades?
Oddity Tech Ltd. has received more favorable grades, with multiple “Overweight” and “Market Outperform” ratings, compared to UiPath Inc.’s mainly neutral or “Hold” consensus. This suggests investors may perceive Oddity Tech as having stronger growth potential or risk-adjusted returns.
Strengths and Weaknesses
Below is a comparative summary of key strengths and weaknesses for UiPath Inc. (PATH) and Oddity Tech Ltd. (ODD) based on the latest financial and operational data.
| Criterion | UiPath Inc. (PATH) | Oddity Tech Ltd. (ODD) |
|---|---|---|
| Diversification | Moderate: Revenue from licenses, professional services, and subscription services with subscription growing fastest | Limited data on product segmentation, but focused operations indicated |
| Profitability | Weak: Negative net margin (-5.15%) and ROIC (-7.41%), value destroying but improving ROIC trend | Strong: Positive net margin (15.69%), high ROIC (28.56%), creating significant value |
| Innovation | Growing ROIC trend suggests improving operational efficiency and innovation potential | Very favorable moat with durable competitive advantage and growing profitability |
| Global presence | Established global footprint with diverse revenue streams | Likely smaller scale but financially robust and efficient |
| Market Share | Facing challenges with value destruction, but subscription growth may indicate expanding market share | Solid financial ratios and favorable profitability suggest strong market positioning |
Key takeaways: Oddity Tech Ltd. demonstrates a clear financial and competitive advantage with strong profitability and efficient capital use, making it a more attractive investment option. UiPath Inc. is currently shedding value despite improving profitability trends, signaling caution but potential for turnaround if growth sustains.
Risk Analysis
Below is a comparative table of key risk factors for UiPath Inc. (PATH) and Oddity Tech Ltd. (ODD) based on the most recent data available:
| Metric | UiPath Inc. (PATH) | Oddity Tech Ltd. (ODD) |
|---|---|---|
| Market Risk | Beta 1.08 indicates moderate market volatility exposure | Beta 3.18 signals high market volatility risk |
| Debt level | Very low debt-to-equity ratio (0.04), low leverage | Low debt-to-equity (0.08), but higher WACC 18.7% indicates costlier capital |
| Regulatory Risk | US-based, subject to US tech regulations and data privacy laws | Israel-based, exposed to diverse international regulations |
| Operational Risk | Slightly unfavorable net margin and ROIC; ongoing profitability challenges | Strong profitability but high valuation multiples may pressure margins |
| Environmental Risk | Limited direct environmental impact, typical for software industry | Similar low environmental risk profile |
| Geopolitical Risk | Moderate, US market exposure with some international operations | Higher, given Middle East base and global consumer focus |
The most impactful risks are market volatility for Oddity Tech, given its high beta, and profitability challenges for UiPath despite strong liquidity and low debt. Oddity’s higher cost of capital and geopolitical risks may affect future growth. Both companies show low debt risks but face sector-specific operational risks.
Which Stock to Choose?
UiPath Inc. (PATH) shows a favorable income statement with 78.57% positive metrics, including 9.3% revenue growth in 2025, yet it struggles with profitability and has unfavorable returns on equity (-3.99%) and invested capital (-7.41%). Its debt levels remain low, and the company’s rating is very favorable (B+), but financial ratios are slightly unfavorable overall.
Oddity Tech Ltd. (ODD) presents a robust financial profile with 100% favorable income metrics, including 27.2% revenue growth in 2024 and strong profitability (15.69% net margin). It maintains a low debt ratio, high returns on equity (35.95%), and a very favorable rating (B+), supported by mostly favorable financial ratios and a durable competitive advantage.
For investors, Oddity Tech may appear more favorable due to its consistent value creation and strong profitability, which could suit growth-oriented or risk-tolerant profiles. Conversely, UiPath’s improving but currently less favorable profitability and financial ratios might appeal more to investors focused on potential turnaround or longer-term quality investing.
Disclaimer: Investment carries a risk of loss of initial capital. The past performance is not a reliable indicator of future results. Be sure to understand risks before making an investment decision.
Go Further
I encourage you to read the complete analyses of UiPath Inc. and Oddity Tech Ltd. to enhance your investment decisions: