In today’s fast-evolving tech landscape, Teradata Corporation and Oddity Tech Ltd. represent two intriguing players within the software infrastructure sector. Teradata, a veteran in enterprise data analytics, contrasts with Oddity’s innovative consumer-tech approach disrupting beauty and wellness markets. Both companies leverage technology to reshape industries, making their strategies and growth potential worthy of comparison. Join me as we analyze which company stands out as a compelling investment opportunity in 2026.

Table of contents
Companies Overview
I will begin the comparison between Teradata Corporation and Oddity Tech Ltd. by providing an overview of these two companies and their main differences.
Teradata Corporation Overview
Teradata Corporation, founded in 1979 and headquartered in San Diego, CA, delivers a connected multi-cloud data platform for enterprise analytics. The company’s flagship product, Teradata Vantage, integrates various data sources to streamline ecosystems and support cloud migration. Serving diverse sectors such as financial services, healthcare, and telecommunications, Teradata emphasizes consulting and maintenance services to optimize analytical infrastructure.
Oddity Tech Ltd. Overview
Oddity Tech Ltd., established in 2013 and based in Tel Aviv-Jaffa, Israel, operates in the consumer-tech space focused on beauty and wellness products. Utilizing its proprietary PowerMatch technology, Oddity builds digital-first brands like IL MAKIAGE and SpoiledChild to disrupt offline-dominated markets. The company’s product portfolio covers skincare, haircare, and cosmetics, positioning itself as an innovator in the software-infrastructure industry on the NASDAQ.
Key similarities and differences
Both Teradata and Oddity operate in the software-infrastructure sector and trade publicly, yet their business models differ significantly. Teradata provides enterprise data analytics platforms and consulting services targeting large industries globally, while Oddity leverages technology to create and scale digital consumer brands in beauty and wellness. Market cap and employee count also differ, reflecting their distinct scale and operational focus.
Income Statement Comparison
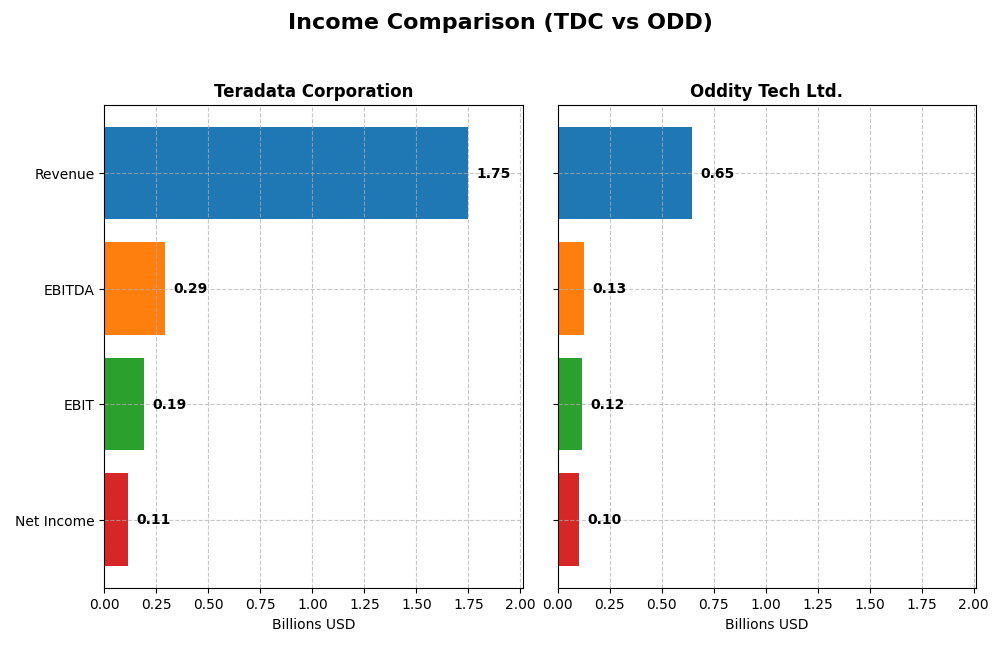
The table below presents a side-by-side comparison of the key income statement metrics for Teradata Corporation and Oddity Tech Ltd. for the fiscal year 2024.
| Metric | Teradata Corporation (TDC) | Oddity Tech Ltd. (ODD) |
|---|---|---|
| Market Cap | 2.8B | 2.0B |
| Revenue | 1.75B | 647M |
| EBITDA | 293M | 125M |
| EBIT | 193M | 116M |
| Net Income | 114M | 101M |
| EPS | 1.18 | 1.78 |
| Fiscal Year | 2024 | 2024 |
Income Statement Interpretations
Teradata Corporation
Teradata’s revenue showed a slight overall decline of about 4.7% from 2020 to 2024, with a notable dip in 2024 compared to 2023. Net income also fell by approximately 11.6% over this period, despite a strong rebound in the last year, nearly doubling net margin to 6.51%. Gross and EBIT margins remained favorable, reflecting stable cost management and improved profitability in 2024.
Oddity Tech Ltd.
Oddity Tech’s income statement reveals robust growth, with revenue increasing over 480% and net income surging more than 760% from 2020 to 2024. Margins are strong and improving, with a gross margin above 72% and net margin reaching nearly 16% in 2024. The company’s recent year marked a 27.2% revenue rise and a 66% EPS increase, highlighting accelerating momentum and operational efficiency.
Which one has the stronger fundamentals?
Oddity Tech demonstrates consistently favorable growth across all income metrics, with significant margin expansion and high revenue growth, signaling strong fundamentals. Teradata, while maintaining favorable margins and showing last-year net income improvement, experienced overall revenue and net income declines. Oddity Tech’s income statement thus reflects a more dynamic growth profile compared to Teradata’s stable but contracting trend.
Financial Ratios Comparison
The table below summarizes key financial ratios for Teradata Corporation (TDC) and Oddity Tech Ltd. (ODD) for the fiscal year 2024, providing a snapshot of their profitability, liquidity, leverage, efficiency, and dividend metrics.
| Ratios | Teradata Corporation (TDC) | Oddity Tech Ltd. (ODD) |
|---|---|---|
| ROE | 85.7% | 35.9% |
| ROIC | 16.9% | 28.6% |
| P/E | 26.3 | 23.7 |
| P/B | 22.6 | 8.54 |
| Current Ratio | 0.81 | 1.79 |
| Quick Ratio | 0.79 | 0.99 |
| D/E | 4.33 | 0.08 |
| Debt-to-Assets | 33.8% | 5.2% |
| Interest Coverage | 7.21 | 1521 |
| Asset Turnover | 1.03 | 1.47 |
| Fixed Asset Turnover | 9.07 | 19.4 |
| Payout ratio | 0 | 0 |
| Dividend yield | 0 | 0 |
Interpretation of the Ratios
Teradata Corporation
Teradata presents a mixed ratio profile with strong returns on equity (85.71%) and invested capital (16.89%), alongside favorable asset turnover metrics. However, liquidity ratios are weak, with a current ratio of 0.81 and a high debt-to-equity ratio of 4.33, flagging potential solvency concerns. The company does not pay dividends, likely prioritizing reinvestment or other financial strategies.
Oddity Tech Ltd.
Oddity Tech shows predominantly favorable ratios, including a robust net margin of 15.69% and solid returns on equity (35.95%) and invested capital (28.56%). Liquidity is healthy with a current ratio of 1.79 and low leverage (debt-to-equity 0.08), though its weighted average cost of capital is relatively high at 18.68%. Oddity does not pay dividends, possibly focusing on growth and capital allocation to expansion.
Which one has the best ratios?
Oddity Tech Ltd. has a more favorable overall ratio profile, with 64.29% favorable metrics compared to Teradata’s 42.86%. Teradata’s higher leverage and weaker liquidity contrast with Oddity’s stronger profitability and capital structure. Both companies do not pay dividends, reflecting differing corporate priorities.
Strategic Positioning
This section compares the strategic positioning of Teradata Corporation and Oddity Tech Ltd., covering market position, key segments, and exposure to technological disruption:
Teradata Corporation
- Established player in software infrastructure with moderate beta, facing typical industry competition.
- Focuses on multi-cloud data platforms, consulting, and recurring software services for enterprises.
- Operates in a technology-driven sector with established cloud analytics platforms, moderate disruption risk.
Oddity Tech Ltd.
- Consumer-tech disruptor in beauty and wellness with high beta, targeting offline industry.
- Builds and scales digital-first beauty and wellness brands using proprietary PowerMatch technology.
- Faces high disruption exposure by leveraging digital-first models in traditional beauty and wellness markets.
Teradata Corporation vs Oddity Tech Ltd. Positioning
Teradata displays a diversified approach with enterprise analytics, cloud platforms, and consulting across multiple industries, offering stability. Oddity Tech is concentrated on digital consumer brands disrupting offline beauty and wellness sectors, exposing it to higher market volatility and innovation demands.
Which has the best competitive advantage?
Both companies show a very favorable moat with growing ROIC above WACC, indicating durable competitive advantages; Teradata’s larger scale and diverse revenue streams contrast with Oddity Tech’s innovative niche focus and high growth potential.
Stock Comparison
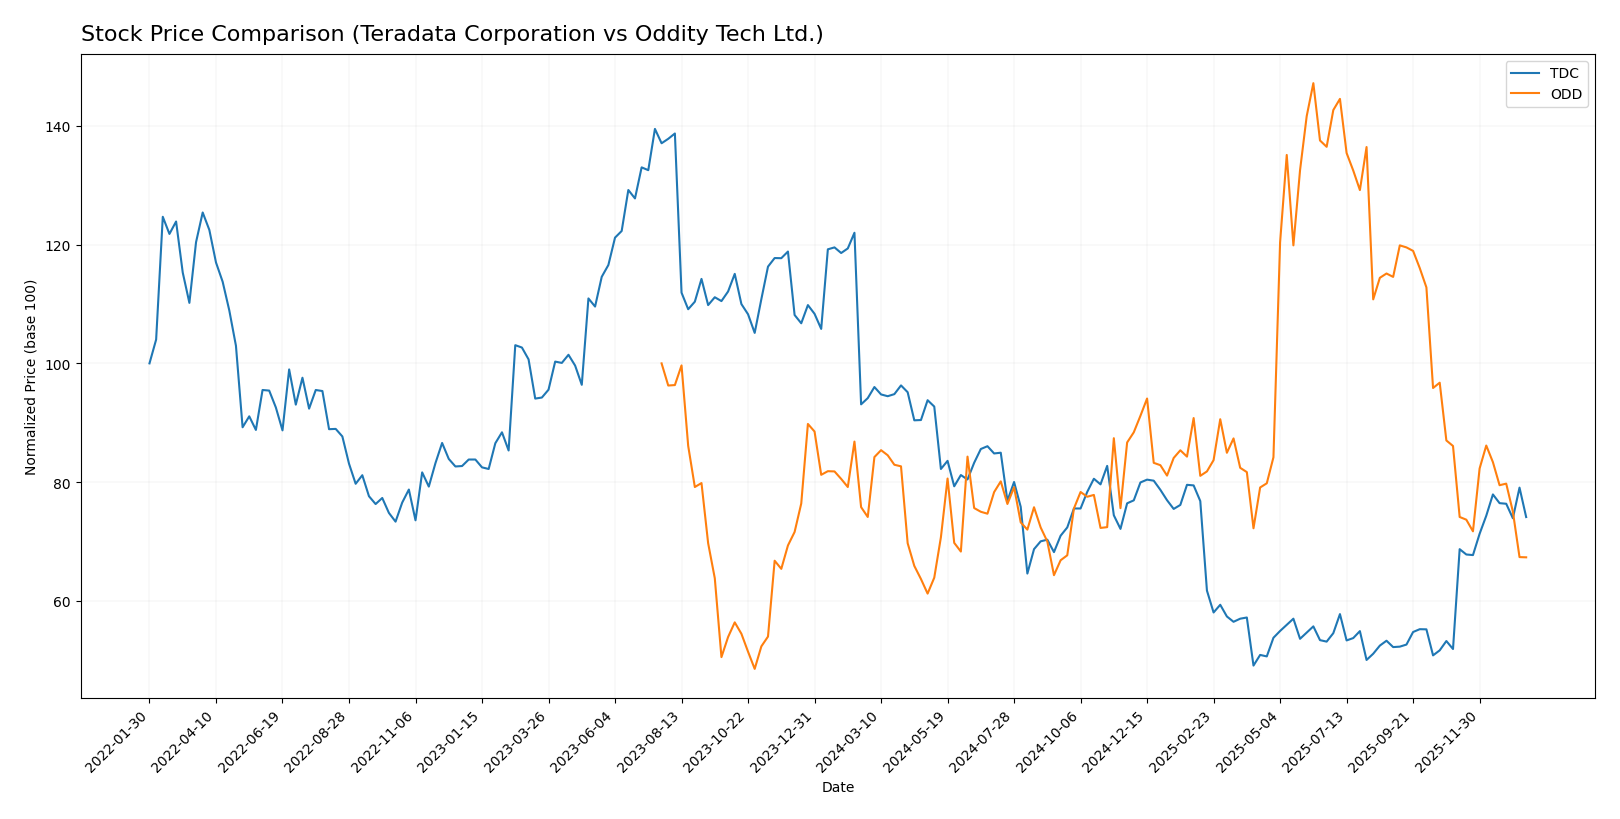
The stock prices of Teradata Corporation and Oddity Tech Ltd. over the past year reveal contrasting bearish trends, with Teradata showing recent strong recovery and Oddity Tech experiencing accelerating selling pressure.
Trend Analysis
Teradata Corporation’s stock declined by 21.26% over the past year, indicating a bearish trend with accelerating downward momentum. However, a recent 42.78% price surge suggests a short-term bullish reversal.
Oddity Tech Ltd. also experienced a bearish trend, with a 9.16% price drop over the past year and decelerating decline. Recent trading shows further weakening with a 21.77% fall, reinforcing bearish momentum.
Comparing both, Teradata exhibited the largest price drop yearly but the strongest recent rebound, while Oddity Tech’s performance remained more consistently negative, making Teradata the higher performer in the latest period.
Target Prices
Here is the consensus target price outlook from verified analysts for Teradata Corporation and Oddity Tech Ltd.
| Company | Target High | Target Low | Consensus |
|---|---|---|---|
| Teradata Corporation | 35 | 27 | 31 |
| Oddity Tech Ltd. | 80 | 40 | 66.33 |
Analysts expect Teradata’s stock to appreciate moderately above its current price of 29.77 USD, while Oddity Tech shows a wider range with a consensus target nearly double its current 35.4 USD price.
Analyst Opinions Comparison
This section compares analysts’ ratings and grades for Teradata Corporation and Oddity Tech Ltd.:
Rating Comparison
Teradata Corporation Rating
- Rating: B+, classified as Very Favorable by analysts.
- Discounted Cash Flow Score: 4, indicating a Favorable valuation.
- ROE Score: 5, rated Very Favorable for profitability efficiency.
- ROA Score: 4, Favorable asset utilization.
- Debt To Equity Score: 1, Very Unfavorable, indicating higher risk.
- Overall Score: 3, Moderate overall financial standing.
Oddity Tech Ltd. Rating
- Rating: B+, classified as Very Favorable by analysts.
- Discounted Cash Flow Score: 4, indicating a Favorable valuation.
- ROE Score: 5, rated Very Favorable for profitability efficiency.
- ROA Score: 4, Favorable asset utilization.
- Debt To Equity Score: 3, Moderate level of financial risk.
- Overall Score: 3, Moderate overall financial standing.
Which one is the best rated?
Both companies share the same B+ rating and identical scores for DCF, ROE, ROA, and overall metrics. Teradata has a significantly weaker Debt-to-Equity Score, implying higher financial risk compared to Oddity Tech.
Scores Comparison
Here is a comparison of Teradata Corporation and Oddity Tech Ltd. based on their financial scores:
TDC Scores
- Altman Z-Score: 0.81, in distress zone, high bankruptcy risk.
- Piotroski Score: 8, very strong financial health.
ODD Scores
- Altman Z-Score: 3.78, in safe zone, low bankruptcy risk.
- Piotroski Score: 6, average financial health.
Which company has the best scores?
Based on the provided data, Oddity Tech Ltd. has a better Altman Z-Score indicating lower bankruptcy risk, while Teradata Corporation has a stronger Piotroski Score suggesting better financial strength.
Grades Comparison
Here is a comparison of the latest reliable grades from recognized financial institutions for Teradata Corporation and Oddity Tech Ltd.:
Teradata Corporation Grades
The following table summarizes recent grades assigned by reputable grading companies for Teradata Corporation:
| Grading Company | Action | New Grade | Date |
|---|---|---|---|
| Barclays | Maintain | Underweight | 2026-01-12 |
| RBC Capital | Maintain | Sector Perform | 2026-01-05 |
| Morgan Stanley | Maintain | Overweight | 2025-12-17 |
| Citizens | Upgrade | Market Outperform | 2025-11-10 |
| Barclays | Maintain | Underweight | 2025-11-05 |
| TD Cowen | Maintain | Hold | 2025-11-05 |
| Evercore ISI Group | Maintain | Outperform | 2025-11-05 |
| UBS | Maintain | Neutral | 2025-08-06 |
| Guggenheim | Maintain | Buy | 2025-05-07 |
| Barclays | Maintain | Underweight | 2025-04-21 |
Teradata shows a mixed grading trend with several “Underweight” and “Hold” ratings, alongside some upgrades to “Outperform” and “Buy.”
Oddity Tech Ltd. Grades
Below is the table of recent grades from recognized grading firms for Oddity Tech Ltd.:
| Grading Company | Action | New Grade | Date |
|---|---|---|---|
| Keybanc | Maintain | Overweight | 2026-01-08 |
| JP Morgan | Maintain | Overweight | 2025-12-12 |
| JP Morgan | Maintain | Overweight | 2025-11-21 |
| Barclays | Maintain | Equal Weight | 2025-11-21 |
| Morgan Stanley | Maintain | Equal Weight | 2025-11-21 |
| Needham | Maintain | Buy | 2025-11-20 |
| Keybanc | Maintain | Overweight | 2025-10-08 |
| JMP Securities | Maintain | Market Outperform | 2025-09-23 |
| Morgan Stanley | Maintain | Equal Weight | 2025-08-06 |
| JMP Securities | Maintain | Market Outperform | 2025-08-05 |
Oddity Tech’s grades largely cluster around “Overweight,” “Buy,” and “Market Outperform,” showing consistent positive ratings.
Which company has the best grades?
Oddity Tech Ltd. has received generally more favorable grades, with multiple “Overweight” and “Buy” ratings, compared to Teradata Corporation’s mixed and more cautious outlook including “Underweight” and “Hold” grades. This difference reflects a stronger consensus on Oddity Tech’s growth prospects, potentially influencing investor sentiment toward higher confidence in Oddity Tech’s future performance.
Strengths and Weaknesses
Below is a comparative overview of key strengths and weaknesses for Teradata Corporation (TDC) and Oddity Tech Ltd. (ODD) based on the most recent financial and operational data.
| Criterion | Teradata Corporation (TDC) | Oddity Tech Ltd. (ODD) |
|---|---|---|
| Diversification | Moderate: Revenue mainly from recurring services (approx. 2.66B USD in 2024), with limited hardware and consulting | Limited data on product diversification; primarily software-focused |
| Profitability | Moderate net margin (6.51%, neutral), high ROE (85.7%, favorable), ROIC 16.9% (favorable) | Strong net margin (15.7%), solid ROE (35.95%), high ROIC (28.56%), overall favorable profitability |
| Innovation | Stable growth in subscription and recurring software licenses; moderate innovation implied | High asset turnover and interest coverage suggest efficient operations and innovation capacity |
| Global presence | Established international presence with over 1B USD revenue from international markets | Details limited; presumed smaller or emerging global footprint |
| Market Share | Established player with durable competitive advantage (very favorable moat) | Also demonstrates durable moat with growing ROIC, but smaller scale and less diversification |
Key takeaways: Teradata shows strength in stable recurring revenue and strong capital efficiency but faces some liquidity and valuation challenges. Oddity Tech excels in profitability and operational efficiency with a favorable growth trend, though with less diversification and a smaller global footprint. Both companies maintain durable competitive advantages, making them interesting but distinct investment options.
Risk Analysis
Below is a comparative risk table for Teradata Corporation (TDC) and Oddity Tech Ltd. (ODD) based on the latest available data from 2024 and 2026 indicators.
| Metric | Teradata Corporation (TDC) | Oddity Tech Ltd. (ODD) |
|---|---|---|
| Market Risk | Low beta (0.57) indicating lower volatility | High beta (3.18) indicating high volatility |
| Debt level | High debt-to-equity ratio (4.33), debt-to-assets 33.8% (neutral) | Low debt-to-equity (0.08), debt-to-assets 5.17% (favorable) |
| Regulatory Risk | Moderate, US-based tech sector compliance | Moderate, Israeli consumer-tech with global regulations |
| Operational Risk | Medium, established infrastructure with 5.7K employees | Medium, smaller scale with 489 employees but innovative product line |
| Environmental Risk | Low, mainly software infrastructure industry | Low, consumer-tech with limited direct environmental impact |
| Geopolitical Risk | Moderate, US market stability but global operations | Elevated, due to Israel location and geopolitical tensions |
Teradata faces the most impact from its high leverage and moderate operational risks, while Oddity Tech carries higher market volatility and geopolitical exposure. Both companies show no dividend yield, emphasizing growth over income. Investors should weigh Teradata’s financial distress signals against Oddity’s market risks.
Which Stock to Choose?
Teradata Corporation (TDC) shows a mixed income evolution with recent declines in revenue but strong growth in EBIT and net margin. Its financial ratios reveal favorable profitability and asset turnover, though debt levels and liquidity ratios are less favorable. The company holds a very favorable rating with a strong moat supported by growing ROIC above WACC.
Oddity Tech Ltd. (ODD) exhibits robust income growth across all key metrics, including a high net margin and EBIT margin. Its financial ratios are predominantly favorable, with low debt, strong liquidity, and efficient asset use. ODD also has a very favorable rating and a durable moat with ROIC well exceeding WACC, though WACC itself is higher than TDC’s.
For investors focused on growth and profitability, ODD’s consistent income expansion and favorable ratios might appear more attractive. Conversely, those prioritizing value creation and strong return on equity with some leverage might find TDC’s profile appealing. The choice could depend on whether an investor prefers rapid growth with moderate financial risk or a company with a strong capital efficiency and established competitive advantage.
Disclaimer: Investment carries a risk of loss of initial capital. The past performance is not a reliable indicator of future results. Be sure to understand risks before making an investment decision.
Go Further
I encourage you to read the complete analyses of Teradata Corporation and Oddity Tech Ltd. to enhance your investment decisions: