In today’s fast-evolving technology landscape, StoneCo Ltd. and Oddity Tech Ltd. stand out as innovative players in the software infrastructure sector. StoneCo focuses on fintech solutions for merchants in Brazil, while Oddity Tech revolutionizes the beauty and wellness industries with digital-first consumer products. Both companies leverage technology to disrupt traditional markets, making their comparison essential for investors seeking growth and innovation. Let’s explore which company holds the most promise for your portfolio.

Table of contents
Companies Overview
I will begin the comparison between StoneCo Ltd. and Oddity Tech Ltd. by providing an overview of these two companies and their main differences.
StoneCo Ltd. Overview
StoneCo Ltd. delivers financial technology solutions to merchants and integrated partners, enabling electronic commerce through in-store, online, and mobile channels mainly in Brazil. The company leverages proprietary Stone Hubs and a dedicated sales force to serve approximately 1.77M clients, primarily small and medium businesses. Founded in 2000 and headquartered in George Town, it operates as a subsidiary of HR Holdings, LLC.
Oddity Tech Ltd. Overview
Oddity Tech Ltd. is a global consumer-tech company focused on beauty and wellness products using its proprietary PowerMatch technology. It develops and scales digital-first brands that challenge traditional offline markets, offering skincare, cosmetics, and haircare products under brands like IL MAKIAGE and SpoiledChild. Incorporated in 2013, it is based in Tel Aviv-Jaffa, Israel, with a strong emphasis on digital innovation.
Key similarities and differences
Both companies operate in the technology sector within the software infrastructure industry, trading on NASDAQ, but serve distinct markets and customer bases. StoneCo targets financial services for merchants predominantly in Brazil, while Oddity Tech focuses on consumer beauty and wellness products worldwide. StoneCo has a larger workforce and market cap (3.9B vs. 2.0B), reflecting differing scales and business models centered on fintech versus consumer tech.
Income Statement Comparison
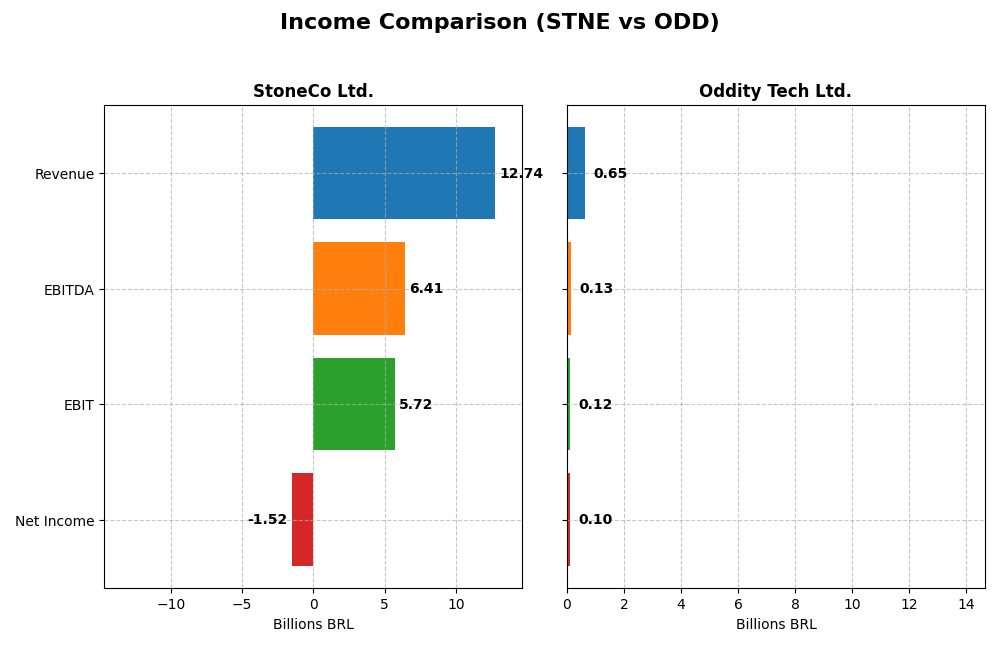
The table below compares the key income statement metrics for StoneCo Ltd. and Oddity Tech Ltd. for the fiscal year 2024.
| Metric | StoneCo Ltd. (STNE) | Oddity Tech Ltd. (ODD) |
|---|---|---|
| Market Cap | 3.9B BRL | 2.0B USD |
| Revenue | 12.7B BRL | 647M USD |
| EBITDA | 6.4B BRL | 125M USD |
| EBIT | 5.7B BRL | 116M USD |
| Net Income | -1.5B BRL | 101M USD |
| EPS | -5.02 BRL | 1.78 USD |
| Fiscal Year | 2024 | 2024 |
Income Statement Interpretations
StoneCo Ltd.
StoneCo Ltd. showed strong revenue growth from 3.2B BRL in 2020 to 12.7B BRL in 2024, but net income declined significantly, ending with a loss of 1.5B BRL in 2024. Gross and EBIT margins remained favorable around 73.4% and 44.9%, respectively, while net margin turned negative. The latest year saw revenue growth slow to 12.1%, but profitability deteriorated sharply.
Oddity Tech Ltd.
Oddity Tech Ltd. experienced consistent revenue and net income growth, with revenue rising from 110M USD in 2020 to 647M USD in 2024, and net income increasing to 101M USD. Margins improved, with a gross margin of 72.4% and net margin at 15.7% in 2024. The latest year showed accelerated revenue growth of 27.2% and strong margin expansion, reflecting solid operational performance.
Which one has the stronger fundamentals?
Oddity Tech displays stronger fundamentals, with consistent revenue and net income growth, improving margins, and favorable interest expense. StoneCo, despite robust revenue growth and solid gross and EBIT margins, faces net income losses and deteriorating net margins. Overall, Oddity Tech’s income statement indicators suggest a more stable and profitable growth trajectory.
Financial Ratios Comparison
The table below presents a side-by-side comparison of key financial ratios for StoneCo Ltd. (STNE) and Oddity Tech Ltd. (ODD) based on their most recent fiscal year data for 2024.
| Ratios | StoneCo Ltd. (STNE) | Oddity Tech Ltd. (ODD) |
|---|---|---|
| ROE | -12.87% | 35.95% |
| ROIC | 22.41% | 28.56% |
| P/E | -9.84 | 23.75 |
| P/B | 1.27 | 8.54 |
| Current Ratio | 1.37 | 1.79 |
| Quick Ratio | 1.37 | 0.99 |
| D/E (Debt-to-Equity) | 1.10 | 0.08 |
| Debt-to-Assets | 23.53% | 5.17% |
| Interest Coverage | 5.57 | 1521.05 |
| Asset Turnover | 0.23 | 1.47 |
| Fixed Asset Turnover | 6.95 | 19.38 |
| Payout ratio | 0 | 0 |
| Dividend yield | 0 | 0 |
Interpretation of the Ratios
StoneCo Ltd.
StoneCo’s ratios present a mixed picture with half rated favorable and a significant portion unfavorable. Key concerns include negative net margin (-11.89%) and return on equity (-12.87%), indicating profitability challenges. The company maintains a neutral current ratio (1.37) and favorable interest coverage (5.41). StoneCo does not pay dividends, likely reflecting reinvestment priorities amid volatility and a high debt-to-equity ratio (1.1).
Oddity Tech Ltd.
Oddity Tech shows predominantly favorable ratios, including a strong net margin of 15.69%, high return on equity (35.95%), and solid return on invested capital (28.56%). The company’s low debt levels and excellent interest coverage (1521.05) highlight financial strength. Oddity Tech does not pay dividends, consistent with a growth strategy focused on reinvestment and expansion in consumer-tech markets.
Which one has the best ratios?
Oddity Tech exhibits a stronger overall ratio profile with 64% favorable evaluations, driven by profitability and capital efficiency. StoneCo’s ratios are less consistent, with profitability weaknesses and leverage concerns despite some favorable metrics. Based on ratio assessments alone, Oddity Tech holds a more favorable financial stance compared to StoneCo.
Strategic Positioning
This section compares the strategic positioning of StoneCo Ltd. and Oddity Tech Ltd., including Market position, Key segments, and Exposure to technological disruption:
StoneCo Ltd.
- Leading fintech provider in Brazil facing competitive pressure in software infrastructure.
- Focused on financial technology solutions for merchants, mainly small and medium-sized businesses.
- Operates in a technology-driven sector with solutions distributed via proprietary hubs and partners.
Oddity Tech Ltd.
- Consumer-tech company disrupting offline beauty and wellness markets globally.
- Builds digital-first beauty and wellness brands using proprietary PowerMatch technology.
- Relies on digital innovation to transform traditional beauty and wellness industries.
StoneCo Ltd. vs Oddity Tech Ltd. Positioning
StoneCo has a concentrated focus on fintech in Brazil, leveraging proprietary distribution channels, while Oddity Tech pursues a diversified global approach in consumer tech and digital brand building. StoneCo targets merchant services; Oddity Tech targets beauty and wellness consumers.
Which has the best competitive advantage?
Both companies demonstrate very favorable moats with growing ROIC trends, indicating durable competitive advantages. StoneCo’s larger scale and hyper-local presence contrast with Oddity Tech’s innovative digital-first brand strategy, each reflecting distinct competitive strengths.
Stock Comparison
The stock prices of StoneCo Ltd. and Oddity Tech Ltd. have exhibited notable declines over the past year, with both experiencing bearish trends and decelerating momentum amid varying trading volumes and market pressures.

Trend Analysis
StoneCo Ltd. shows a bearish trend over the past 12 months with a -13.9% price change, decelerating momentum, and moderate volatility (std deviation 2.92). The stock ranged from 7.85 to 19.4 during this period.
Oddity Tech Ltd. also displays a bearish trend with a -9.16% price change and deceleration, but higher volatility (std deviation 11.75). Prices fluctuated between 32.19 and 77.35 over the same timeframe.
Comparing the two, StoneCo Ltd. experienced a larger negative return than Oddity Tech Ltd., indicating Oddity Tech Ltd. delivered relatively better market performance over the past year.
Target Prices
The consensus target prices for StoneCo Ltd. and Oddity Tech Ltd. reflect varied analyst expectations.
| Company | Target High | Target Low | Consensus |
|---|---|---|---|
| StoneCo Ltd. | 20 | 20 | 20 |
| Oddity Tech Ltd. | 80 | 40 | 66.33 |
Analysts expect StoneCo Ltd.’s price to reach 20, above its current 14.49 USD, indicating potential upside. Oddity Tech Ltd. shows a wider range with a consensus price (66.33 USD) nearly double its current 35.4 USD, suggesting strong growth expectations.
Analyst Opinions Comparison
This section compares analysts’ ratings and grades for StoneCo Ltd. and Oddity Tech Ltd.:
Rating Comparison
StoneCo Ltd. Rating
- Rating: C, assessed as very favorable overall.
- Discounted Cash Flow Score: Moderate at 3.
- ROE Score: Very unfavorable at 1, indicating low profit efficiency.
- ROA Score: Very unfavorable at 1, showing poor asset utilization.
- Debt To Equity Score: Very unfavorable at 1, high financial risk.
- Overall Score: Moderate at 2.
Oddity Tech Ltd. Rating
- Rating: B+, assessed as very favorable overall.
- Discounted Cash Flow Score: Favorable at 4.
- ROE Score: Very favorable at 5, indicating strong profit generation.
- ROA Score: Favorable at 4, reflecting efficient asset use.
- Debt To Equity Score: Moderate at 3, indicating balanced risk.
- Overall Score: Moderate at 3.
Which one is the best rated?
Based strictly on the provided data, Oddity Tech Ltd. has higher ratings across most financial metrics, including ROE, ROA, and discounted cash flow scores, making it better rated than StoneCo Ltd. in this comparison.
Scores Comparison
Here is the comparison of StoneCo Ltd. and Oddity Tech Ltd. scores:
StoneCo Ltd. Scores
- Altman Z-Score: 1.02, indicating financial distress.
- Piotroski Score: 5, representing average financial strength.
Oddity Tech Ltd. Scores
- Altman Z-Score: 3.78, indicating a safe financial zone.
- Piotroski Score: 6, representing average financial strength.
Which company has the best scores?
Oddity Tech Ltd. shows a significantly stronger Altman Z-Score, placing it in the safe zone, while StoneCo Ltd. is in financial distress. Both have average Piotroski Scores, with Oddity marginally higher.
Grades Comparison
The following presents the recent grades assigned to StoneCo Ltd. and Oddity Tech Ltd. by respected financial institutions:
StoneCo Ltd. Grades
Here is a summary of the latest grades from major financial firms for StoneCo Ltd.:
| Grading Company | Action | New Grade | Date |
|---|---|---|---|
| Goldman Sachs | Maintain | Buy | 2025-10-14 |
| B of A Securities | Maintain | Buy | 2025-09-09 |
| UBS | Maintain | Buy | 2025-08-29 |
| JP Morgan | Maintain | Overweight | 2025-07-16 |
| Barclays | Maintain | Equal Weight | 2025-05-12 |
| Barclays | Maintain | Equal Weight | 2025-04-23 |
| Citigroup | Upgrade | Buy | 2025-04-22 |
| Barclays | Maintain | Equal Weight | 2025-03-21 |
| Morgan Stanley | Maintain | Underweight | 2025-03-21 |
| Goldman Sachs | Maintain | Buy | 2025-02-06 |
StoneCo Ltd.’s grades display a generally positive trend, with multiple buy ratings and few downgrades, indicating moderate confidence among analysts.
Oddity Tech Ltd. Grades
Below is the recent grading overview for Oddity Tech Ltd. from established financial analysts:
| Grading Company | Action | New Grade | Date |
|---|---|---|---|
| Keybanc | Maintain | Overweight | 2026-01-08 |
| JP Morgan | Maintain | Overweight | 2025-12-12 |
| JP Morgan | Maintain | Overweight | 2025-11-21 |
| Barclays | Maintain | Equal Weight | 2025-11-21 |
| Morgan Stanley | Maintain | Equal Weight | 2025-11-21 |
| Needham | Maintain | Buy | 2025-11-20 |
| Keybanc | Maintain | Overweight | 2025-10-08 |
| JMP Securities | Maintain | Market Outperform | 2025-09-23 |
| Morgan Stanley | Maintain | Equal Weight | 2025-08-06 |
| JMP Securities | Maintain | Market Outperform | 2025-08-05 |
Oddity Tech Ltd. consistently holds overweight and market outperform ratings, suggesting a solid positive outlook from analysts.
Which company has the best grades?
Both companies hold a consensus “Buy” rating; however, Oddity Tech Ltd. has a stronger pattern of overweight and market outperform grades compared to StoneCo Ltd.’s mix of buy, equal weight, and some underweight ratings. This difference may influence investors’ perception of growth potential and risk.
Strengths and Weaknesses
Below is a comparison of key strengths and weaknesses for StoneCo Ltd. (STNE) and Oddity Tech Ltd. (ODD) based on the most recent financial and strategic data.
| Criterion | StoneCo Ltd. (STNE) | Oddity Tech Ltd. (ODD) |
|---|---|---|
| Diversification | Moderate; mainly fintech-focused | Limited data; likely technology-centric |
| Profitability | Negative net margin (-11.9%), negative ROE (-12.9%) | Strong net margin (15.7%) and ROE (36.0%) |
| Innovation | Favorable ROIC with a strong upward trend (22.4%) | Very strong ROIC (28.6%) and innovation-driven growth |
| Global presence | Emerging; mainly Latin America | Growing; technology reach expanding globally |
| Market Share | Solid position in fintech payments in Brazil | Growing presence in tech industry segments |
Key takeaways: Oddity Tech demonstrates stronger profitability and efficiency metrics, with a favorable innovation profile and lower leverage. StoneCo shows robust capital returns but struggles with profitability and leverage, indicating a riskier profile despite growth. Investors should weigh Oddity Tech’s stable financials against StoneCo’s high growth potential with caution.
Risk Analysis
The table below summarizes key risk factors for StoneCo Ltd. (STNE) and Oddity Tech Ltd. (ODD) based on their latest financial and market data for 2024.
| Metric | StoneCo Ltd. (STNE) | Oddity Tech Ltd. (ODD) |
|---|---|---|
| Market Risk | High beta (1.835), volatile price range (8.38-19.95 USD) | Very high beta (3.184), wide price range (33.06-79.18 USD) |
| Debt level | Moderate debt-to-equity (1.1, unfavorable), debt-to-assets 23.53% (favorable) | Low debt-to-equity (0.08, favorable), debt-to-assets 5.17% (favorable) |
| Regulatory Risk | Operates in Brazil with potential fintech regulations | Based in Israel; consumer-tech sector can face compliance challenges |
| Operational Risk | Large employee base (7,239), complex fintech infrastructure | Smaller team (489), reliant on digital brand scaling |
| Environmental Risk | Limited exposure, fintech sector less impacted | Minimal direct environmental risk, consumer products focus |
| Geopolitical Risk | Medium, Cayman Islands HQ but Brazil-focused operations | Medium-high, geopolitical tensions in Middle East region |
StoneCo faces significant market volatility and moderate leverage risk, coupled with operational complexity and regulatory uncertainties in Brazil’s fintech space. Oddity Tech enjoys strong financial health with low debt and high profitability but carries elevated market risk due to its high beta and geopolitical exposure in Israel. The most impactful risks for STNE are financial distress signals and market fluctuations, while for ODD, market volatility and geopolitical tensions are critical.
Which Stock to Choose?
StoneCo Ltd. (STNE) shows a favorable income evolution with 12.1% revenue growth in 2024 and a strong gross margin of 73.4%. Its financial ratios are slightly favorable overall, with a 22.4% ROIC above WACC, but profitability remains challenged with negative net margin (-11.9%) and ROE (-12.9%). Debt metrics are mixed, and the rating is very favorable (C).
Oddity Tech Ltd. (ODD) demonstrates robust income growth, including 27.2% revenue increase and a positive net margin of 15.7%. Financial ratios are favorable, with 64.3% favorable metrics, strong profitability (ROE 36.0%, ROIC 28.6%), low debt, and a very favorable rating (B+). Its Altman Z-Score indicates financial safety.
For investors prioritizing growth and profitability, Oddity Tech’s strong income and financial ratios may appear more attractive. Conversely, those focused on value creation and competitive durability might find StoneCo’s very favorable moat and improving ROIC suggestive of long-term potential despite current profitability challenges. Thus, the preferable stock could depend on the investor’s risk tolerance and strategy.
Disclaimer: Investment carries a risk of loss of initial capital. The past performance is not a reliable indicator of future results. Be sure to understand risks before making an investment decision.
Go Further
I encourage you to read the complete analyses of StoneCo Ltd. and Oddity Tech Ltd. to enhance your investment decisions: