In today’s fast-evolving tech landscape, Rubrik, Inc. and Oddity Tech Ltd. stand out as innovative players within the software infrastructure sector. Rubrik focuses on comprehensive data security solutions, while Oddity leverages technology to disrupt the beauty and wellness markets with digital-first strategies. Comparing these distinct yet overlapping approaches offers valuable insights. Join me as we explore which company presents the most compelling opportunity for your investment portfolio.

Table of contents
Companies Overview
I will begin the comparison between Rubrik, Inc. and Oddity Tech Ltd. by providing an overview of these two companies and their main differences.
Rubrik, Inc. Overview
Rubrik, Inc. is a US-based technology company specializing in data security solutions for businesses and individuals globally. Its offerings include enterprise data protection, cloud and SaaS data protection, threat analytics, and cyber recovery. Founded in 2013 and headquartered in Palo Alto, California, Rubrik serves multiple sectors such as financial, retail, healthcare, and public sectors, positioning itself as a key player in infrastructure software.
Oddity Tech Ltd. Overview
Oddity Tech Ltd. is an Israeli consumer-tech company focusing on beauty and wellness products powered by its proprietary PowerMatch technology. The company develops digital-first brands to disrupt traditional beauty markets, offering a variety of skincare, haircare, and makeup products under brands like IL MAKIAGE and SpoiledChild. Established in 2013 and based in Tel Aviv-Jaffa, Oddity operates within the software infrastructure sector with a niche in consumer products.
Key similarities and differences
Both Rubrik and Oddity operate in the technology sector and are listed on major US exchanges, with Rubrik on NYSE and Oddity on NASDAQ. While Rubrik emphasizes enterprise and cloud data security solutions targeting diverse industries, Oddity focuses on digitally driven consumer beauty and wellness brands. Their business models differ significantly: Rubrik serves B2B markets with software infrastructure solutions, whereas Oddity targets B2C markets with digitally enhanced consumer products.
Income Statement Comparison
The table below compares the most recent fiscal year income statement metrics for Rubrik, Inc. and Oddity Tech Ltd., highlighting key financial performance indicators.

| Metric | Rubrik, Inc. (RBRK) | Oddity Tech Ltd. (ODD) |
|---|---|---|
| Market Cap | 13.4B | 2.01B |
| Revenue | 887M | 647M |
| EBITDA | -1.08B | 125M |
| EBIT | -1.11B | 116M |
| Net Income | -1.15B | 101M |
| EPS | -7.48 | 1.78 |
| Fiscal Year | 2025 | 2024 |
Income Statement Interpretations
Rubrik, Inc.
Rubrik’s revenue grew significantly from $388M in 2021 to $887M in 2025, showing strong top-line expansion. However, net income remained deeply negative, worsening from -$213M to -$1.15B, reflecting high operating expenses. Gross margins were favorable at 70%, but net and EBIT margins deteriorated sharply, with the latest year revealing a steep decline in profitability despite revenue growth.
Oddity Tech Ltd.
Oddity Tech showed robust revenue growth from $111M in 2020 to $647M in 2024, with net income rising from $11.7M to $101.5M. Margins improved markedly, with a strong gross margin near 72% and positive EBIT and net margins above 15% in 2024. The company demonstrated consistent growth in earnings and margins, supported by controlled operating expenses and expanding profitability.
Which one has the stronger fundamentals?
Oddity Tech exhibits stronger fundamentals, characterized by consistent revenue and net income growth with improving margins and positive profitability ratios. In contrast, Rubrik, despite revenue gains, faces substantial net losses and declining margins, indicating operational challenges. Favorable margin stability and earnings growth favor Oddity Tech’s financial health over Rubrik’s current performance.
Financial Ratios Comparison
The table below presents the most recent financial ratios for Rubrik, Inc. and Oddity Tech Ltd. as of fiscal year 2025 and 2024 respectively, offering a side-by-side view of key performance and financial health indicators.
| Ratios | Rubrik, Inc. (2025) | Oddity Tech Ltd. (2024) |
|---|---|---|
| ROE | 2.09% | 35.95% |
| ROIC | -2.35% | 28.56% |
| P/E | -9.79 | 23.75 |
| P/B | -20.42 | 8.54 |
| Current Ratio | 1.13 | 1.79 |
| Quick Ratio | 1.13 | 0.99 |
| D/E (Debt-to-Equity) | -0.63 | 0.08 |
| Debt-to-Assets | 24.65% | 5.17% |
| Interest Coverage | -27.49 | 1521.05 |
| Asset Turnover | 0.62 | 1.47 |
| Fixed Asset Turnover | 16.67 | 19.38 |
| Payout ratio | 0 | 0 |
| Dividend yield | 0% | 0% |
Interpretation of the Ratios
Rubrik, Inc.
Rubrik shows a mixed profile with favorable return on equity (208.55%) and strong leverage ratios, including a low debt-to-equity of -0.63 and a favorable debt-to-assets at 24.65%. However, the company faces concerns with negative net margin (-130.26%), poor return on invested capital (-234.85%), and weak interest coverage (-26.84). Its current ratio is neutral at 1.13. Rubrik does not pay dividends, likely due to ongoing reinvestments and negative profitability metrics.
Oddity Tech Ltd.
Oddity Tech displays generally strong ratios with a positive net margin (15.69%), solid return on equity (35.95%), and favorable return on invested capital (28.56%). The company’s current ratio is healthy at 1.79, with very low debt-to-equity (0.08) and excellent interest coverage (1521.05). Oddity does not pay dividends, possibly prioritizing growth, innovation, or acquisitions, as indicated by its non-dividend policy despite positive earnings.
Which one has the best ratios?
Oddity Tech Ltd. presents a more consistently favorable ratio profile, excelling in profitability, liquidity, and leverage metrics compared to Rubrik, Inc., which suffers from significant negative margins and returns despite some strong capital structure indicators. Both companies lack dividends, but Oddity’s overall financial health appears stronger based on the provided ratio evaluations.
Strategic Positioning
This section compares the strategic positioning of Rubrik, Inc. and Oddity Tech Ltd., including market position, key segments, and exposure to disruption:
Rubrik, Inc.
- Large market cap of 13.4B with low beta, facing competitive pressure in software infrastructure
- Focused on enterprise data security, cloud, SaaS, and diverse industry verticals
- Positioned in established software infrastructure with data security solutions, limited tech disruption
Oddity Tech Ltd.
- Smaller 2.0B market cap with high beta, competing in consumer-tech beauty and wellness sectors
- Concentrated on digital-first beauty and wellness brands using proprietary PowerMatch technology
- Disrupts offline beauty and wellness markets via digital technology and brand innovation
Rubrik, Inc. vs Oddity Tech Ltd. Positioning
Rubrik pursues a diversified approach targeting multiple industries with data security products, offering stability but facing established competition. Oddity Tech concentrates on niche consumer tech in beauty, leveraging innovation but with higher market risk and volatility.
Which has the best competitive advantage?
Oddity Tech exhibits a very favorable moat with growing ROIC and value creation, indicating a durable competitive advantage. Rubrik shows a very unfavorable moat with declining ROIC, reflecting value destruction and weaker competitive positioning.
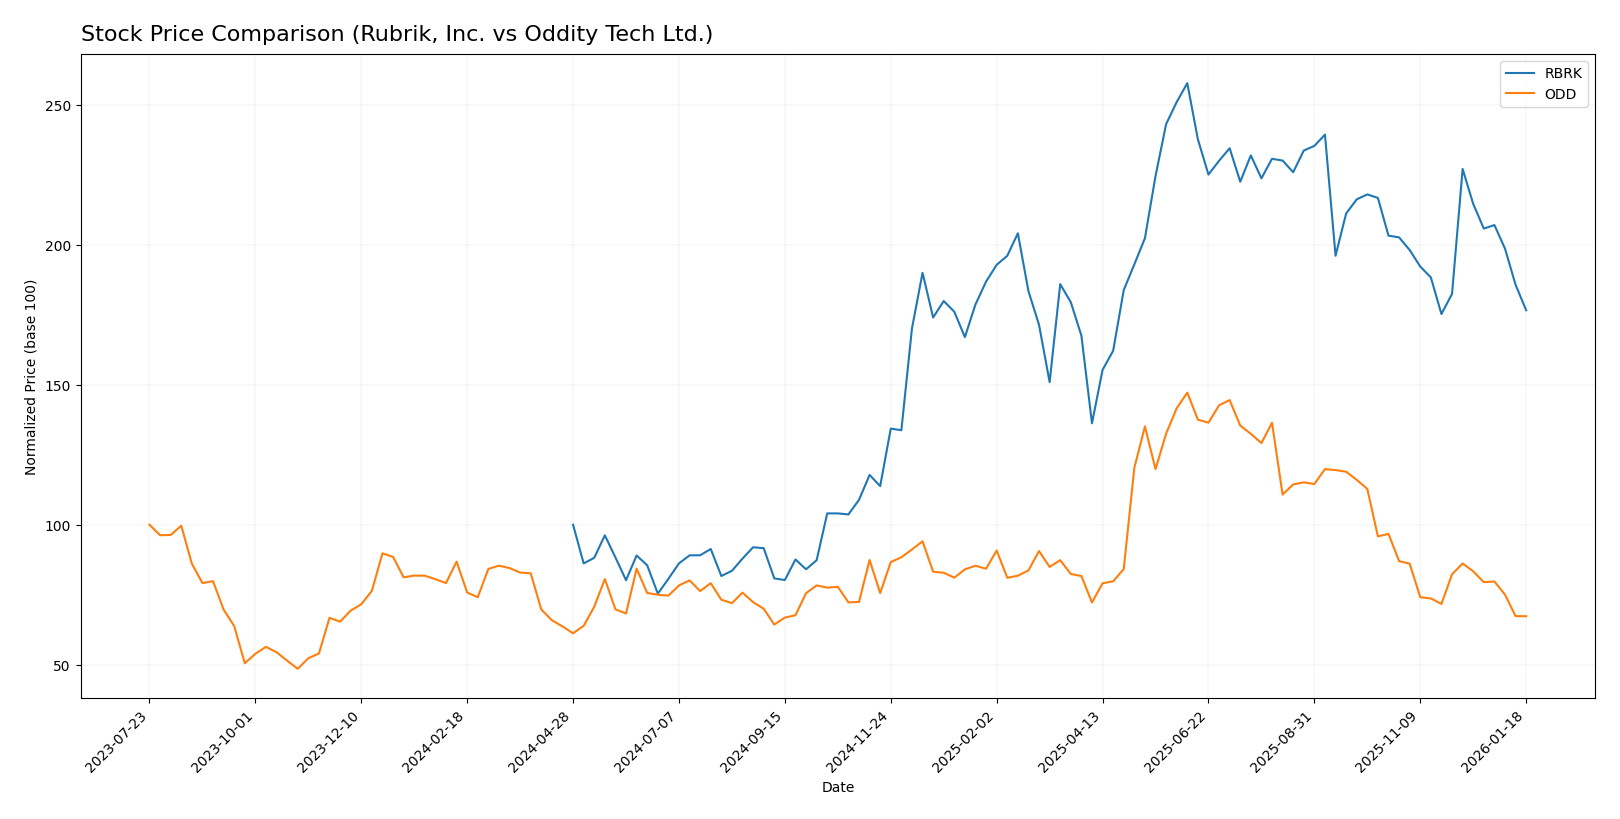
Stock Comparison
The stock price movements of Rubrik, Inc. (RBRK) and Oddity Tech Ltd. (ODD) over the past year reveal contrasting trends, with RBRK showing strong gains and ODD experiencing declines, both displaying deceleration in momentum.
Trend Analysis
Rubrik, Inc. (RBRK) exhibited a bullish trend over the past 12 months with a 76.58% price increase, though recent months show a 10.85% decline and deceleration in momentum. Volatility remains elevated with a 21.4 std deviation.
Oddity Tech Ltd. (ODD) demonstrated a bearish trend with a 9.16% price drop over the last year, accelerating recently with a 21.77% decrease. Volatility is moderate, with an 11.75 std deviation and seller dominance.
Comparing the two, Rubrik, Inc. delivered the highest market performance over the past year, contrasting with Oddity Tech Ltd.’s consistent downward trajectory.
Target Prices
Analysts present a bullish consensus for both Rubrik, Inc. and Oddity Tech Ltd., indicating potential upside from current levels.
| Company | Target High | Target Low | Consensus |
|---|---|---|---|
| Rubrik, Inc. | 113 | 105 | 109.33 |
| Oddity Tech Ltd. | 80 | 40 | 66.33 |
For Rubrik, the target consensus at 109.33 suggests significant upside compared to the current price of 67.1 USD. Oddity Tech’s target consensus of 66.33 also indicates strong growth potential versus its current price of 35.4 USD.
Analyst Opinions Comparison
This section compares analysts’ ratings and grades for Rubrik, Inc. and Oddity Tech Ltd.:
Rating Comparison
Rubrik, Inc. Rating
- Rating: C, considered very favorable
- Discounted Cash Flow Score: 1, very unfavorable
- ROE Score: 5, very favorable
- ROA Score: 1, very unfavorable
- Debt To Equity Score: 1, very unfavorable
- Overall Score: 2, moderate
Oddity Tech Ltd. Rating
- Rating: B+, considered very favorable
- Discounted Cash Flow Score: 4, favorable
- ROE Score: 5, very favorable
- ROA Score: 4, favorable
- Debt To Equity Score: 3, moderate
- Overall Score: 3, moderate
Which one is the best rated?
Based strictly on the provided data, Oddity Tech Ltd. holds a better rating (B+) and higher scores in discounted cash flow, ROA, debt to equity, and overall score. Rubrik, Inc. matches in ROE but scores lower in other metrics.
Scores Comparison
Here is a comparison of the Altman Z-Score and Piotroski Score for Rubrik, Inc. and Oddity Tech Ltd.:
Rubrik, Inc. Scores
- Altman Z-Score: 1.41, indicating financial distress and high risk.
- Piotroski Score: 4, classified as average financial strength.
Oddity Tech Ltd. Scores
- Altman Z-Score: 3.78, indicating a safe zone and low risk.
- Piotroski Score: 6, classified as average financial strength.
Which company has the best scores?
Based on the provided data, Oddity Tech Ltd. has a significantly better Altman Z-Score, placing it in the safe zone compared to Rubrik’s distress zone. Both companies have average Piotroski Scores, but Oddity’s score is moderately higher.
Grades Comparison
Here is the grades comparison of Rubrik, Inc. and Oddity Tech Ltd. from established grading companies:
Rubrik, Inc. Grades
The following table summarizes recent grades assigned to Rubrik, Inc. by reputable grading firms:
| Grading Company | Action | New Grade | Date |
|---|---|---|---|
| Keybanc | Maintain | Overweight | 2026-01-12 |
| Piper Sandler | Maintain | Overweight | 2026-01-05 |
| Citigroup | Maintain | Buy | 2025-12-08 |
| Piper Sandler | Maintain | Overweight | 2025-12-05 |
| Baird | Maintain | Outperform | 2025-12-05 |
| William Blair | Upgrade | Outperform | 2025-12-05 |
| Keybanc | Maintain | Overweight | 2025-12-05 |
| Wedbush | Maintain | Outperform | 2025-12-05 |
| BMO Capital | Maintain | Outperform | 2025-12-05 |
| Rosenblatt | Maintain | Buy | 2025-12-05 |
Rubrik, Inc. consistently receives positive grades, predominantly “Overweight,” “Buy,” and “Outperform,” with a recent upgrade indicating improving sentiment.
Oddity Tech Ltd. Grades
Below is the summary of Oddity Tech Ltd.’s latest grades from well-known grading firms:
| Grading Company | Action | New Grade | Date |
|---|---|---|---|
| Keybanc | Maintain | Overweight | 2026-01-08 |
| JP Morgan | Maintain | Overweight | 2025-12-12 |
| JP Morgan | Maintain | Overweight | 2025-11-21 |
| Barclays | Maintain | Equal Weight | 2025-11-21 |
| Morgan Stanley | Maintain | Equal Weight | 2025-11-21 |
| Needham | Maintain | Buy | 2025-11-20 |
| Keybanc | Maintain | Overweight | 2025-10-08 |
| JMP Securities | Maintain | Market Outperform | 2025-09-23 |
| Morgan Stanley | Maintain | Equal Weight | 2025-08-06 |
| JMP Securities | Maintain | Market Outperform | 2025-08-05 |
Oddity Tech Ltd. shows mixed but generally positive grades, including several “Overweight,” “Buy,” and “Market Outperform,” balanced with some “Equal Weight” ratings.
Which company has the best grades?
Rubrik, Inc. has received a stronger and more consistent set of positive grades compared to Oddity Tech Ltd., which has a mix of moderately positive and neutral ratings. This suggests Rubrik’s outlook is viewed more favorably by analysts, potentially affecting investor confidence and perceived upside.
Strengths and Weaknesses
Below is a comparison table highlighting the key strengths and weaknesses of Rubrik, Inc. and Oddity Tech Ltd. based on their latest financial and strategic metrics.
| Criterion | Rubrik, Inc. (RBRK) | Oddity Tech Ltd. (ODD) |
|---|---|---|
| Diversification | Moderate revenue mix: 828.7M subscription, 44.6M product/service, 18.4M maintenance | Information not available; presumed narrower focus |
| Profitability | Negative net margin (-130.26%), ROIC -234.85%, value destroying | Positive net margin (15.69%), ROIC 28.56%, value creating |
| Innovation | Declining ROIC trend, indicating weakening competitive advantages | Growing ROIC trend, signaling durable innovation and advantage |
| Global presence | Not explicitly detailed, stable asset turnover (0.62) | Likely stronger presence indicated by higher asset turnover (1.47) |
| Market Share | Challenged due to value destruction and unfavorable profitability | Favorable with strong profitability and efficient capital use |
Key takeaways: Oddity Tech Ltd. demonstrates a robust and growing economic moat with strong profitability and efficient capital allocation. In contrast, Rubrik, Inc. is currently shedding value with declining returns and profitability, indicating higher risk for investors.
Risk Analysis
Below is a comparative overview of key risks for Rubrik, Inc. (RBRK) and Oddity Tech Ltd. (ODD) based on the latest data.
| Metric | Rubrik, Inc. (RBRK) | Oddity Tech Ltd. (ODD) |
|---|---|---|
| Market Risk | Low beta (0.28) suggests lower volatility, but negative net margins signal earnings risk | High beta (3.18) indicates high volatility and sensitivity to market fluctuations |
| Debt level | Moderate debt-to-assets (24.65%), favorable debt/equity (-0.63) but poor interest coverage (-26.84) | Low debt-to-assets (5.17%), low debt/equity (0.08), excellent interest coverage (1521.05) |
| Regulatory Risk | Moderate US tech sector regulations, compliance critical | Exposure to Israeli regulations and global consumer product standards |
| Operational Risk | Scaling challenges post-IPO, negative ROIC (-234.85%) signals inefficiencies | Smaller workforce, but strong operational metrics and asset turnover (1.47) |
| Environmental Risk | Typical for software infrastructure, limited direct impact | Consumer products face supply chain and sustainability scrutiny |
| Geopolitical Risk | US-based with global clients; stable but exposed to US-China tech tensions | Based in Israel, exposure to regional geopolitical tensions |
Rubrik’s most impactful risks are its poor profitability and financial distress signals (Altman Z-score in distress zone), despite moderate leverage. Oddity Tech shows stronger financial stability and operational efficiency but faces higher market volatility and geopolitical exposure. Investors should weigh Rubrik’s turnaround potential against Oddity’s growth volatility.
Which Stock to Choose?
Rubrik, Inc. (RBRK) shows strong revenue growth of 41% in the last year and 129% over five years, yet its profitability remains negative with a net margin of -130%. Financial ratios are mixed but lean favorable overall (57% favorable), with a strong return on equity of 208% and low debt levels. However, the company is destroying value as its ROIC is well below WACC, and profitability is declining. The rating stands at a very favorable level overall despite some weak scores, while financial stability indicators like the Altman Z-Score place it in the distress zone.
Oddity Tech Ltd. (ODD) demonstrates consistent profitability with a 15.7% net margin and positive growth across income metrics, including a 27% revenue increase in the last year and a 485% rise over five years. Its financial ratios are largely favorable (64%), featuring solid returns on equity and assets, low leverage, and excellent interest coverage. The company is creating value with ROIC exceeding WACC and an improving trend. Ratings are very favorable, and its Altman Z-Score signals a safe financial position.
Investors seeking growth potential might find Rubrik’s strong equity returns and revenue expansion appealing despite its challenges in profitability and value creation. Conversely, those prioritizing stable profitability and financial strength could consider Oddity Tech’s consistent earnings, value creation, and better solvency metrics as positive signals. The choice could depend on the investor’s risk tolerance and focus on either growth or quality fundamentals.
Disclaimer: Investment carries a risk of loss of initial capital. The past performance is not a reliable indicator of future results. Be sure to understand risks before making an investment decision.
Go Further
I encourage you to read the complete analyses of Rubrik, Inc. and Oddity Tech Ltd. to enhance your investment decisions: