In today’s dynamic technology landscape, choosing the right company to invest in requires careful analysis of market position and innovation strategies. Palo Alto Networks, Inc. (PANW) and Oddity Tech Ltd. (ODD) both operate within the software infrastructure sector but serve vastly different niches—cybersecurity and consumer tech, respectively. This comparison explores their unique strengths and growth potential to help you decide which company deserves a spot in your investment portfolio.

Table of contents
Companies Overview
I will begin the comparison between Palo Alto Networks and Oddity Tech by providing an overview of these two companies and their main differences.
Palo Alto Networks Overview
Palo Alto Networks, Inc. specializes in cybersecurity solutions, offering firewall appliances, security management software, and subscription services focused on threat prevention and cloud security. Founded in 2005 and headquartered in Santa Clara, California, it serves medium to large enterprises, service providers, and government entities across various industries. The company operates on a global scale with over 15.7K full-time employees and a market cap of approximately 128B USD.
Oddity Tech Overview
Oddity Tech Ltd. is a consumer-tech company based in Tel Aviv-Jaffa, Israel, founded in 2013. It focuses on beauty and wellness products powered by its proprietary PowerMatch technology, aiming to disrupt traditional offline markets with digital-first brands like IL MAKIAGE and SpoiledChild. The company employs around 489 people and has a market cap near 2B USD, serving a global consumer base through the NASDAQ Global Market.
Key similarities and differences
Both Palo Alto Networks and Oddity Tech operate in the technology sector with a focus on software infrastructure, yet their markets differ widely—cybersecurity versus consumer tech in beauty and wellness. Palo Alto Networks targets enterprise and government clients with security solutions, while Oddity Tech serves consumers with digitally driven personal care products. Market capitalization and employee size also reflect these differences, with Palo Alto Networks being significantly larger and more established.
Income Statement Comparison
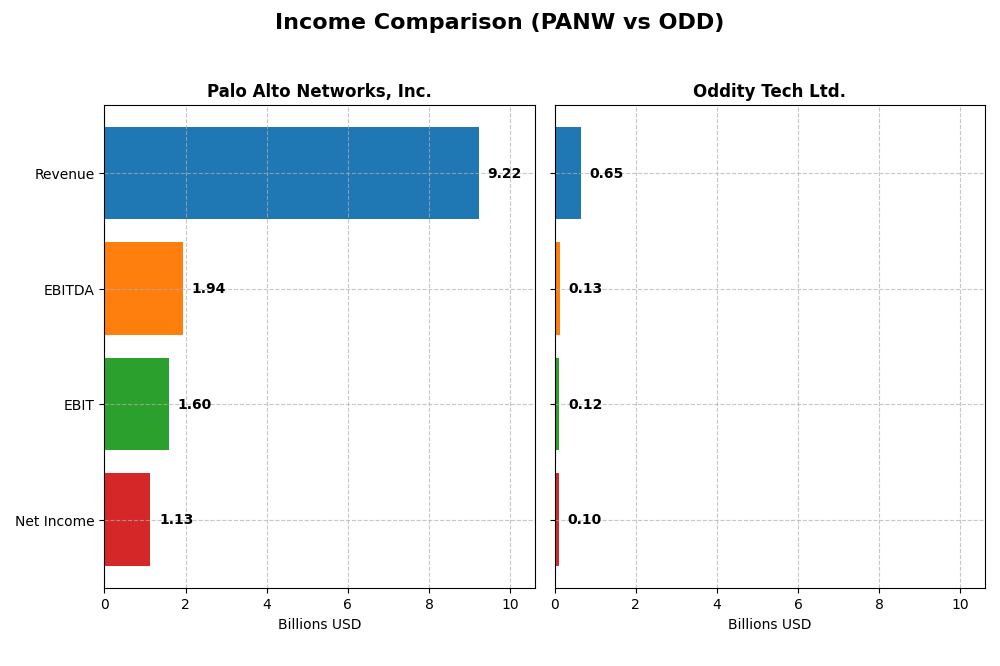
The table below presents a side-by-side comparison of key income statement metrics for Palo Alto Networks, Inc. and Oddity Tech Ltd. for their most recent fiscal years.
| Metric | Palo Alto Networks, Inc. | Oddity Tech Ltd. |
|---|---|---|
| Market Cap | 128.4B | 2.0B |
| Revenue | 9.22B | 647.0M |
| EBITDA | 1.94B | 125.4M |
| EBIT | 1.60B | 115.6M |
| Net Income | 1.13B | 101.5M |
| EPS | 1.71 | 1.78 |
| Fiscal Year | 2025 | 2024 |
Income Statement Interpretations
Palo Alto Networks, Inc.
Palo Alto Networks exhibited consistent growth in revenue, rising from $4.26B in 2021 to $9.22B in 2025, with net income rebounding from a loss of $498.9M in 2021 to $1.13B in 2025. Margins improved notably, with a gross margin of 73.41% and an EBIT margin of 17.32% in 2025. The latest year showed strong revenue and EBIT growth, though net margin and EPS declined, reflecting margin pressures.
Oddity Tech Ltd.
Oddity Tech showed rapid expansion, with revenue increasing from $111M in 2020 to $647M in 2024 and net income growing from $11.7M to $101.5M. Margins remained stable and favorable, featuring a 72.38% gross margin and a 17.87% EBIT margin in 2024. The most recent year delivered robust revenue and profit growth, alongside improved net margin and EPS, highlighting excellent operational leverage.
Which one has the stronger fundamentals?
Both companies demonstrate favorable income statements and growth trends. Palo Alto Networks benefits from scale and strong margin improvements, despite recent net margin softness. Oddity Tech, while smaller, achieves higher growth rates and margin expansion consistently. Oddity’s fully favorable income statement evaluation contrasts with Palo Alto’s slight net margin decline, suggesting differing risk and growth profiles.
Financial Ratios Comparison
The table below presents a factual comparison of key financial ratios for Palo Alto Networks, Inc. (PANW) and Oddity Tech Ltd. (ODD) based on their most recent fiscal year data.
| Ratios | Palo Alto Networks, Inc. (2025) | Oddity Tech Ltd. (2024) |
|---|---|---|
| ROE | 14.5% | 36.0% |
| ROIC | 5.7% | 28.6% |
| P/E | 101.4 | 23.7 |
| P/B | 14.7 | 8.5 |
| Current Ratio | 0.89 | 1.79 |
| Quick Ratio | 0.89 | 0.99 |
| D/E (Debt to Equity) | 0.04 | 0.08 |
| Debt-to-Assets | 1.43% | 5.17% |
| Interest Coverage | 414.3 | 1521.1 |
| Asset Turnover | 0.39 | 1.47 |
| Fixed Asset Turnover | 12.6 | 19.4 |
| Payout ratio | 0% | 0% |
| Dividend yield | 0% | 0% |
Interpretation of the Ratios
Palo Alto Networks, Inc.
Palo Alto Networks shows a slightly favorable ratio profile with strong interest coverage and low debt levels, but faces concerns with a high PE ratio of 101.43 and a weak current ratio at 0.89. Asset turnover is also low, indicating less efficient use of assets. The company does not pay dividends, likely prioritizing reinvestment and growth over shareholder payouts.
Oddity Tech Ltd.
Oddity Tech has a favorable ratio set, highlighted by strong net margin at 15.69%, high return on equity of 35.95%, and robust asset turnover of 1.47. The high WACC at 18.68% and unfavorable price-to-book at 8.54 raise some concerns. Oddity Tech does not pay dividends, suggesting a focus on reinvestment or growth initiatives rather than direct shareholder returns.
Which one has the best ratios?
Oddity Tech exhibits a more favorable overall ratio profile, with higher profitability and efficiency metrics and stronger liquidity than Palo Alto Networks. However, Palo Alto Networks benefits from lower leverage and better interest coverage. Both companies have no dividend payouts, reflecting possible growth or reinvestment strategies.
Strategic Positioning
This section compares the strategic positioning of Palo Alto Networks and Oddity Tech Ltd., focusing on market position, key segments, and exposure to technological disruption:
Palo Alto Networks, Inc.
- Leading cybersecurity provider with strong market cap and NASDAQ listing; faces moderate competition.
- Generates revenue mainly from subscriptions, products, and support in cybersecurity for enterprises and government.
- Positioned in cybersecurity infrastructure with ongoing innovation; must adapt to rapid tech changes in cloud security.
Oddity Tech Ltd.
- Smaller consumer-tech company focused on beauty and wellness; operates in a niche market with high beta.
- Digital-first brands in beauty and wellness using proprietary PowerMatch technology to disrupt traditional markets.
- Relies on technology to disrupt offline beauty industry; exposure to technological shifts in consumer preferences.
Palo Alto Networks vs Oddity Tech Ltd. Positioning
Palo Alto Networks has a diversified cybersecurity portfolio with broad enterprise and government clients, while Oddity Tech is concentrated in digital beauty and wellness. Palo Alto’s scale offers stability; Oddity’s niche focus drives innovation but with higher volatility.
Which has the best competitive advantage?
Oddity Tech shows a very favorable moat with ROIC exceeding WACC and growing profitability, indicating a durable competitive advantage. Palo Alto Networks has a slightly unfavorable moat, shedding value despite improving ROIC trends.
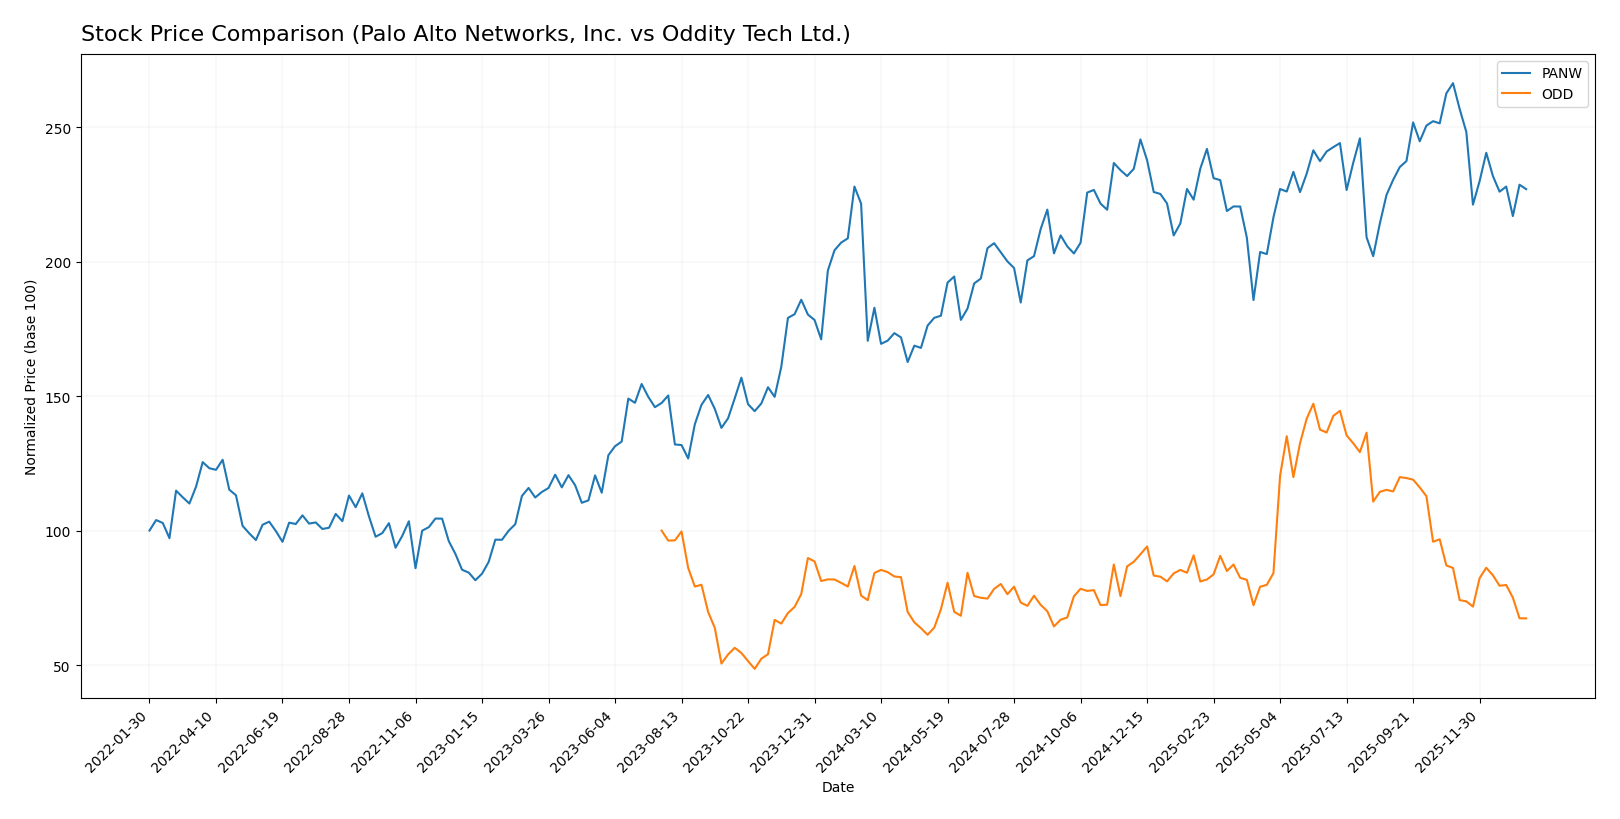
Stock Comparison
The last 12 months revealed contrasting stock performances: Palo Alto Networks, Inc. demonstrated a strong 33.05% gain with decelerating bullish momentum, while Oddity Tech Ltd. faced a 9.16% decline amid slowing bearish trends.
Trend Analysis
Palo Alto Networks, Inc. showed a bullish trend over the past year with a 33.05% price increase and decelerating momentum, despite high volatility (std deviation 19.95) and a recent short-term decline of 14.79%. Oddity Tech Ltd. experienced a bearish trend with a 9.16% decrease over the same period, also decelerating, marked by moderate volatility (std deviation 11.75) and a sharper recent drop of 21.77%. Comparing both, Palo Alto Networks delivered the highest market performance, outperforming Oddity Tech by over 42 percentage points in annual price change.
Target Prices
The consensus target prices for Palo Alto Networks, Inc. and Oddity Tech Ltd. reflect varying analyst expectations for these technology companies.
| Company | Target High | Target Low | Consensus |
|---|---|---|---|
| Palo Alto Networks, Inc. | 265 | 157 | 231.07 |
| Oddity Tech Ltd. | 80 | 40 | 66.33 |
Analysts expect Palo Alto Networks’ stock to trade significantly above its current price of $187.66, while Oddity Tech presents a consensus target nearly double its current $35.40 price, indicating bullish sentiment for both stocks.
Analyst Opinions Comparison
This section compares analysts’ ratings and grades for Palo Alto Networks, Inc. and Oddity Tech Ltd.:
Rating Comparison
Palo Alto Networks Rating
- Rating: B, categorized as Very Favorable
- Discounted Cash Flow Score: 4, indicating a Favorable view
- ROE Score: 4, considered Favorable
- ROA Score: 3, Moderate level
- Debt To Equity Score: 4, Favorable financial risk profile
- Overall Score: 3, Moderate assessment
Oddity Tech Rating
- Rating: B+, categorized as Very Favorable
- Discounted Cash Flow Score: 4, indicating a Favorable view
- ROE Score: 5, rated Very Favorable
- ROA Score: 4, Favorable level
- Debt To Equity Score: 3, Moderate financial risk profile
- Overall Score: 3, Moderate assessment
Which one is the best rated?
Based strictly on the provided data, Oddity Tech holds a slightly better rating (B+) than Palo Alto Networks (B) due to higher ROE and ROA scores, despite both having the same overall and DCF scores.
Scores Comparison
The following table presents a comparison of the Altman Z-Score and Piotroski Score for Palo Alto Networks and Oddity Tech:
Palo Alto Networks Scores
- Altman Z-Score: 5.95, indicating a safe zone with low bankruptcy risk.
- Piotroski Score: 6, reflecting average financial strength.
Oddity Tech Scores
- Altman Z-Score: 3.78, also in the safe zone with moderate safety.
- Piotroski Score: 6, reflecting average financial strength.
Which company has the best scores?
Based on the provided data, Palo Alto Networks shows a higher Altman Z-Score than Oddity Tech, indicating stronger financial stability. Both companies share an identical Piotroski Score of 6, reflecting similar average financial strength.
Grades Comparison
The following presents the latest reliable grades for Palo Alto Networks, Inc. and Oddity Tech Ltd.:
Palo Alto Networks, Inc. Grades
This table summarizes recent grades and rating actions from established grading companies for Palo Alto Networks, Inc.:
| Grading Company | Action | New Grade | Date |
|---|---|---|---|
| UBS | Maintain | Neutral | 2026-01-13 |
| Piper Sandler | Maintain | Overweight | 2026-01-05 |
| Guggenheim | Upgrade | Neutral | 2026-01-05 |
| Morgan Stanley | Maintain | Overweight | 2025-12-18 |
| Goldman Sachs | Maintain | Buy | 2025-11-21 |
| HSBC | Downgrade | Reduce | 2025-11-21 |
| Needham | Maintain | Buy | 2025-11-20 |
| WestPark Capital | Maintain | Hold | 2025-11-20 |
| Bernstein | Maintain | Outperform | 2025-11-20 |
| DA Davidson | Maintain | Buy | 2025-11-20 |
Grades for Palo Alto Networks, Inc. show a general consensus of buy and overweight ratings, with a single downgrade to reduce and some neutral holds, indicating mixed but overall positive sentiment.
Oddity Tech Ltd. Grades
This table details the latest reliable grades and rating actions from recognized grading firms for Oddity Tech Ltd.:
| Grading Company | Action | New Grade | Date |
|---|---|---|---|
| Keybanc | Maintain | Overweight | 2026-01-08 |
| JP Morgan | Maintain | Overweight | 2025-12-12 |
| JP Morgan | Maintain | Overweight | 2025-11-21 |
| Barclays | Maintain | Equal Weight | 2025-11-21 |
| Morgan Stanley | Maintain | Equal Weight | 2025-11-21 |
| Needham | Maintain | Buy | 2025-11-20 |
| Keybanc | Maintain | Overweight | 2025-10-08 |
| JMP Securities | Maintain | Market Outperform | 2025-09-23 |
| Morgan Stanley | Maintain | Equal Weight | 2025-08-06 |
| JMP Securities | Maintain | Market Outperform | 2025-08-05 |
Oddity Tech Ltd.’s ratings mostly consist of overweight and market outperform grades with several equal weight ratings, reflecting steady positive but somewhat cautious analyst sentiment.
Which company has the best grades?
Both Palo Alto Networks, Inc. and Oddity Tech Ltd. have a consensus “Buy” rating, but Palo Alto Networks shows a broader presence of buy and outperform grades, while Oddity Tech leans more on overweight and market outperform without buy consensus volume. This suggests Palo Alto Networks may be viewed more favorably by analysts, potentially influencing investor confidence and portfolio decisions.
Strengths and Weaknesses
Below is a comparison table summarizing the key strengths and weaknesses of Palo Alto Networks, Inc. (PANW) and Oddity Tech Ltd. (ODD) based on the most recent financial and strategic data available.
| Criterion | Palo Alto Networks, Inc. (PANW) | Oddity Tech Ltd. (ODD) |
|---|---|---|
| Diversification | Moderate diversification: strong in cybersecurity subscriptions and support services, less in product sales | Limited data on product mix but appears focused, potentially less diversified |
| Profitability | Moderate net margin (12.3%), ROIC below WACC indicating value destruction but improving profitability | Strong profitability: net margin 15.7%, ROIC well above WACC, creating value |
| Innovation | Solid innovation with growing ROIC trend, but still shedding value overall | High innovation reflected in very favorable moat and profitability growth |
| Global presence | Established global presence with increasing subscription revenues | Emerging global presence, likely more regionally focused but growing fast |
| Market Share | Leading cybersecurity market player with substantial subscription base | Smaller but rapidly growing player with strong competitive advantage |
Key takeaways: Oddity Tech demonstrates a stronger economic moat and profitability profile, making it a more favorable investment in terms of value creation and financial health. Palo Alto Networks shows improving profitability trends but still struggles with value destruction and higher valuation multiples, warranting cautious consideration.
Risk Analysis
Below is a comparison table highlighting key risks for Palo Alto Networks, Inc. (PANW) and Oddity Tech Ltd. (ODD) based on their latest financial and operational profiles.
| Metric | Palo Alto Networks, Inc. (PANW) | Oddity Tech Ltd. (ODD) |
|---|---|---|
| Market Risk | Moderate (Beta 0.75) | High (Beta 3.18) |
| Debt level | Low (Debt/Equity 0.04) | Low (Debt/Equity 0.08) |
| Regulatory Risk | Moderate (US cybersecurity laws) | Moderate (International, Israel) |
| Operational Risk | Moderate (Complex product suite) | Moderate (Scaling digital brands) |
| Environmental Risk | Low | Low |
| Geopolitical Risk | Moderate (US market focus) | Elevated (Israel-based, geopolitical tensions) |
The most likely and impactful risks are market volatility for Oddity Tech due to its high beta and geopolitical tensions given its Israel base. Palo Alto Networks shows strong financial stability with low debt but faces regulatory challenges in the cybersecurity sector. Investors should weigh Oddity’s growth potential against its higher risk profile.
Which Stock to Choose?
Palo Alto Networks, Inc. (PANW) has shown favorable income growth with a 14.87% revenue increase in 2025 and strong profitability metrics, including a 12.3% net margin. Its financial ratios are slightly favorable, with solid debt management but some valuation concerns due to high P/E and P/B ratios. The company exhibits growing profitability but is currently shedding value with a slightly unfavorable moat status.
Oddity Tech Ltd. (ODD) demonstrates robust income evolution, with a 27.2% revenue growth in 2024 and consistently favorable profitability ratios such as a 15.69% net margin and high returns on equity and capital. Its financial ratios are largely favorable, supported by strong liquidity and efficient asset use, while maintaining a very favorable moat indicating durable competitive advantage.
Investors prioritizing durable value creation and strong financial ratios might find Oddity Tech Ltd. more favorable, while those focusing on established growth and improving profitability could interpret Palo Alto Networks as a potential option, noting its slightly unfavorable moat but favorable income statement. The choice could depend on the investor’s tolerance for current value destruction versus long-term growth prospects.
Disclaimer: Investment carries a risk of loss of initial capital. The past performance is not a reliable indicator of future results. Be sure to understand risks before making an investment decision.
Go Further
I encourage you to read the complete analyses of Palo Alto Networks, Inc. and Oddity Tech Ltd. to enhance your investment decisions: