Home > Comparison > Technology > PLTR vs ODD
The strategic rivalry between Palantir Technologies Inc. and Oddity Tech Ltd. shapes the evolving landscape of the technology sector. Palantir operates as a data-centric software infrastructure powerhouse serving intelligence and enterprise clients. Oddity Tech, by contrast, focuses on consumer-tech innovation, disrupting beauty and wellness markets through digital-first brands. This analysis pits Palantir’s scale and deep data integration against Oddity’s niche growth model to identify which offers superior risk-adjusted returns for diversified portfolios.

Table of contents
Companies Overview
Palantir Technologies Inc. and Oddity Tech Ltd. represent two distinct forces shaping the global software infrastructure and consumer-tech markets.
Palantir Technologies Inc.: Data-Driven Intelligence Platform Leader
Palantir dominates software infrastructure by delivering platforms that empower intelligence agencies and enterprises to analyze complex datasets. Its core revenue stems from licensing Palantir Gotham and Foundry, which integrate and operationalize data for threat response and business transformation. In 2026, Palantir focuses on expanding its AI platform and cloud deployments to enhance predictive analytics capabilities.
Oddity Tech Ltd.: Digital-First Consumer-Tech Innovator
Oddity Tech leads in digital beauty and wellness products, leveraging proprietary PowerMatch technology to disrupt traditional retail models. Its revenue engine revolves around scaling online brands like IL MAKIAGE and SpoiledChild through data-driven consumer targeting. The company’s 2026 strategy centers on accelerating global brand expansion and innovating personalized product offerings.
Strategic Collision: Similarities & Divergences
Both companies invest heavily in software infrastructure, yet Palantir targets enterprise and government sectors, while Oddity Tech focuses on consumer markets. Their battleground lies in leveraging data analytics for competitive advantage—Palantir through operational intelligence, Oddity via personalized consumer engagement. Investors face contrasting profiles: Palantir offers a high-market-cap, AI-driven infrastructure play; Oddity presents a nimble, high-beta consumer disruptor.
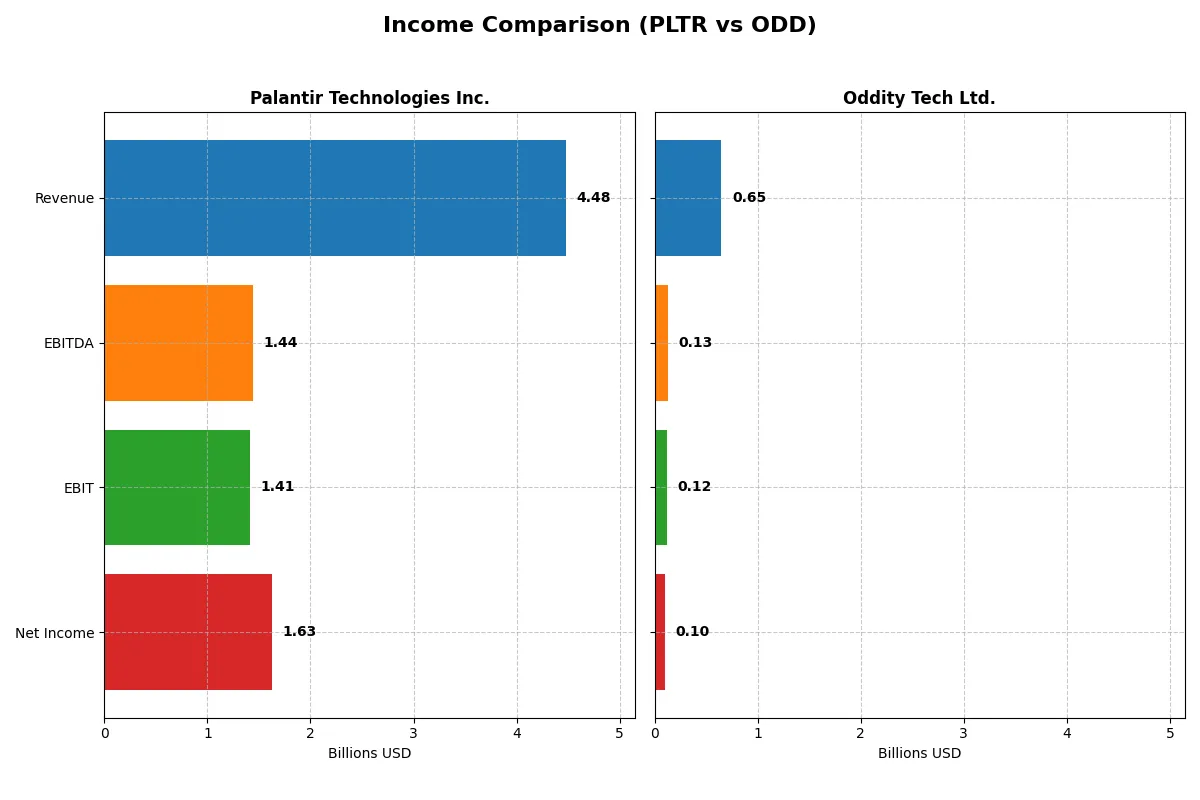
Income Statement Comparison
This data dissects the core profitability and scalability of both corporate engines to reveal who dominates the bottom line:
| Metric | Palantir Technologies Inc. (PLTR) | Oddity Tech Ltd. (ODD) |
|---|---|---|
| Revenue | 4.48B | 647M |
| Cost of Revenue | 789M | 179M |
| Operating Expenses | 2.27B | 353M |
| Gross Profit | 3.69B | 468M |
| EBITDA | 1.44B | 125M |
| EBIT | 1.41B | 116M |
| Interest Expense | 0 | 76K |
| Net Income | 1.63B | 101M |
| EPS | 0.69 | 1.78 |
| Fiscal Year | 2025 | 2024 |
Income Statement Analysis: The Bottom-Line Duel
This income statement comparison reveals how efficiently each company turns revenue into profit and sustains growth momentum.
Palantir Technologies Inc. Analysis
Palantir’s revenue surged from 1.54B in 2021 to 4.48B in 2025, reflecting robust growth. Net income turned positive after losses, reaching 1.63B in 2025. Gross margin remains strong at 82.4%, and net margin improved to 36.3%, demonstrating enhanced operational efficiency and significant profitability momentum in the latest year.
Oddity Tech Ltd. Analysis
Oddity scaled revenue from 110M in 2020 to 647M in 2024, showing impressive expansion. Net income also rose sharply to 101M in 2024. Gross margin stands at 72.4%, with a net margin of 15.7%. Despite lower margins than Palantir, Oddity’s steady profit growth and improving margins signal solid operational leverage and consistent earnings progress.
Growth Scale vs. Margin Strength
Palantir dominates with superior margins and a dramatic net income turnaround, translating growth into high profitability. Oddity impresses with rapid revenue expansion and expanding earnings but at lower margin levels. Palantir’s profile suits investors prioritizing margin power, while Oddity appeals to those favoring high-growth potential with improving profitability.
Financial Ratios Comparison
These vital ratios act as a diagnostic tool to expose the underlying fiscal health, valuation premiums, and capital efficiency of the companies compared:
| Ratios | Palantir Technologies Inc. (PLTR) | Oddity Tech Ltd. (ODD) |
|---|---|---|
| ROE | 22.0% | 35.9% |
| ROIC | 17.9% | 28.6% |
| P/E | 259.2 | 23.7 |
| P/B | 57.0 | 8.5 |
| Current Ratio | 7.11 | 1.79 |
| Quick Ratio | 7.11 | 0.99 |
| D/E (Debt to Equity) | 0.031 | 0.080 |
| Debt-to-Assets | 2.6% | 5.2% |
| Interest Coverage | 0 (not reported) | 1521 |
| Asset Turnover | 0.50 | 1.47 |
| Fixed Asset Turnover | 17.8 | 19.4 |
| Payout ratio | 0 | 0 |
| Dividend yield | 0% | 0% |
| Fiscal Year | 2025 | 2024 |
Efficiency & Valuation Duel: The Vital Signs
Financial ratios act as a company’s DNA, exposing hidden risks and revealing operational efficiency and market valuation nuances.
Palantir Technologies Inc.
Palantir posts a robust 22% ROE and a strong 36.31% net margin, signaling operational excellence. However, its valuation is stretched, with a P/E of 259.19 and P/B at 57.02, far above sector norms. Palantir returns no dividends, instead reinvesting heavily into R&D to fuel growth and innovation.
Oddity Tech Ltd.
Oddity Tech delivers an impressive 35.95% ROE and a solid 15.69% net margin, indicating high profitability. Its valuation remains reasonable with a P/E of 23.75, reflecting market confidence without excess. Like Palantir, it pays no dividends, focusing on capex and maintaining a healthy cash flow to support expansion.
Premium Valuation vs. Operational Safety
Palantir’s high valuation contrasts with Oddity’s balanced multiples and superior capital efficiency. Oddity offers a better risk-reward profile given its reasonable valuation and strong returns. Investors favoring growth at any price may lean toward Palantir, while those seeking operational safety with upside might prefer Oddity.
Which one offers the Superior Shareholder Reward?
Palantir Technologies Inc. (PLTR) and Oddity Tech Ltd. (ODD) both forego dividends, channeling cash into growth. PLTR boasts zero dividend payout, a negligible buyback program, and reinvests heavily in R&D, maintaining an extraordinary 0.88 FCF per share in 2025. Oddity Tech similarly pays no dividend but deploys robust share repurchases and sustains strong free cash flow of 2.26 per share, reflecting a more aggressive capital return via buybacks. PLTR’s sky-high valuation multiples (P/E ~259) suggest growth priced at a premium, while ODD trades at a reasonable P/E near 24, with a solid operating margin of 17.9%. I see ODD’s balanced buyback and sustainable margin profile as a superior risk-adjusted total return vehicle in 2026.
Comparative Score Analysis: The Strategic Profile
The radar chart reveals the fundamental DNA and trade-offs of Palantir Technologies Inc. and Oddity Tech Ltd., highlighting their financial strengths and vulnerabilities:
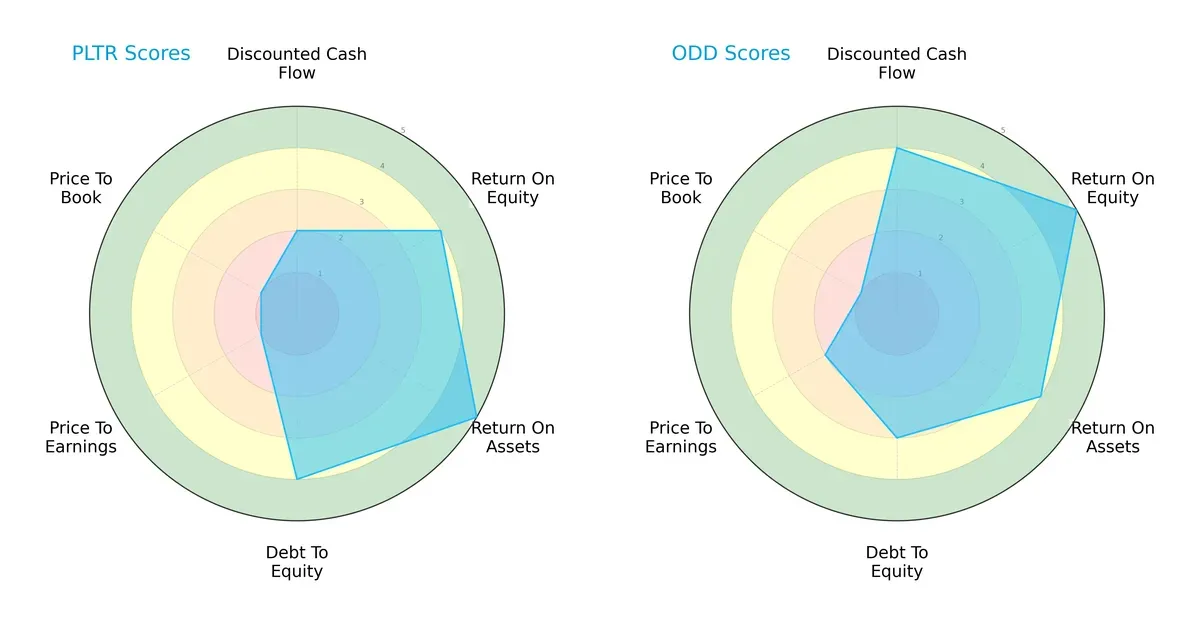
Palantir shows a stronger balance sheet with higher ROA and debt-to-equity scores, signaling efficient asset use and lower leverage risk. Oddity Tech leads in discounted cash flow and ROE, indicating robust profitability drivers but a slightly weaker debt position. Palantir’s valuation scores lag, suggesting market skepticism. Overall, Palantir offers a more balanced profile, while Oddity relies on superior profitability metrics.
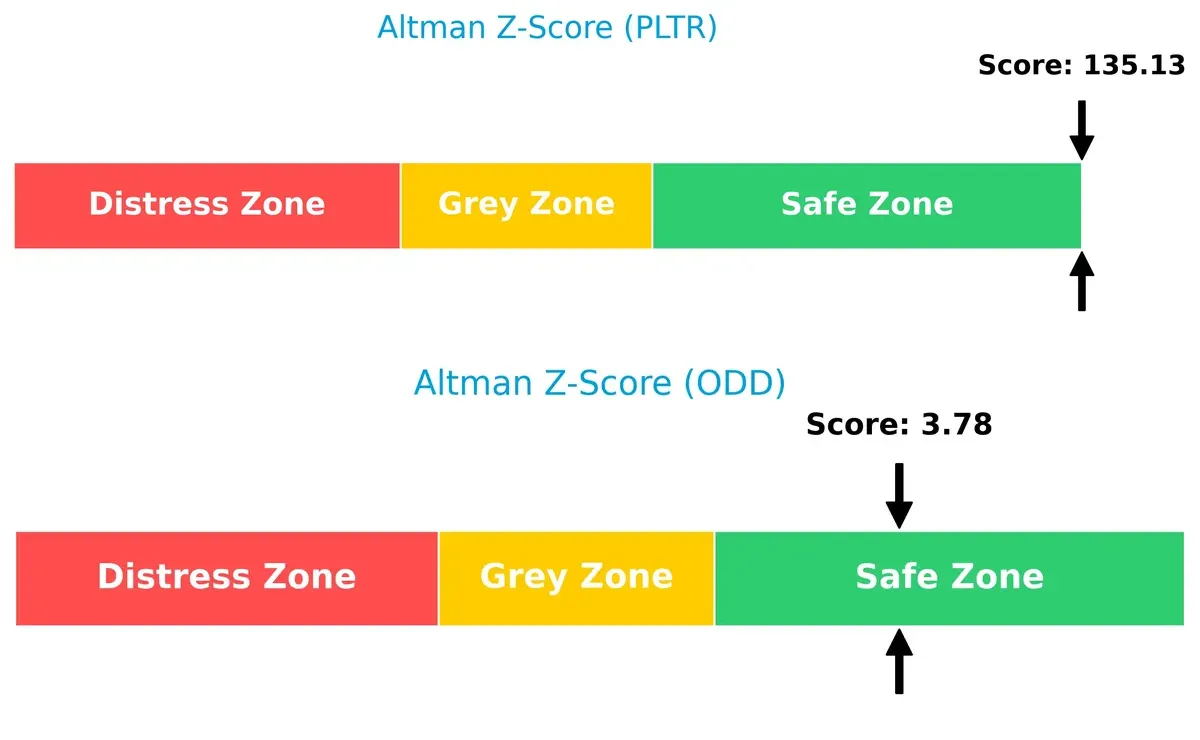
Bankruptcy Risk: Solvency Showdown
The Altman Z-Scores demonstrate both firms are in the safe zone, but Palantir’s extraordinarily high score indicates an exceptionally low bankruptcy risk, far surpassing Oddity Tech:
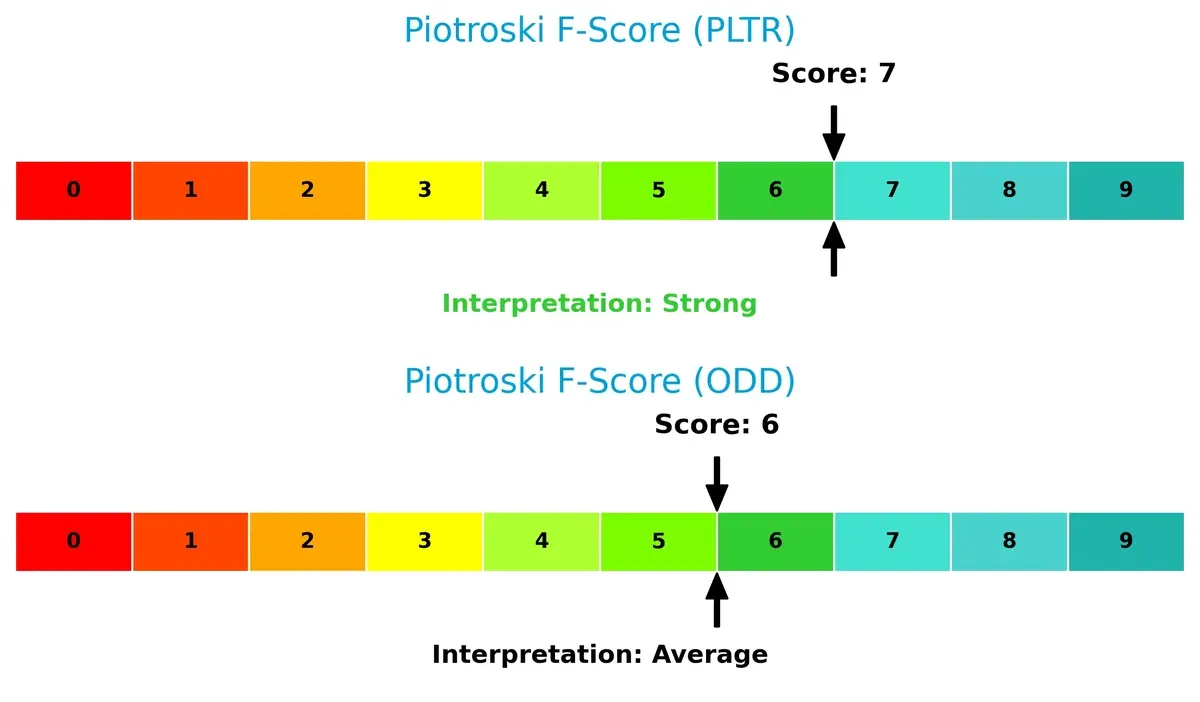
Financial Health: Quality of Operations
Palantir’s Piotroski F-Score of 7 indicates strong financial health with solid internal metrics. Oddity Tech’s score of 6 is respectable but flags potential areas for improvement:
How are the two companies positioned?
This section dissects the operational DNA of Palantir Technologies and Oddity Tech by comparing their revenue distribution and internal dynamics. The goal is to confront their economic moats and identify which model offers the most resilient, sustainable competitive advantage today.
Revenue Segmentation: The Strategic Mix
This visual comparison dissects how Palantir Technologies Inc. and Oddity Tech Ltd. diversify their income streams and where their primary sector bets lie:
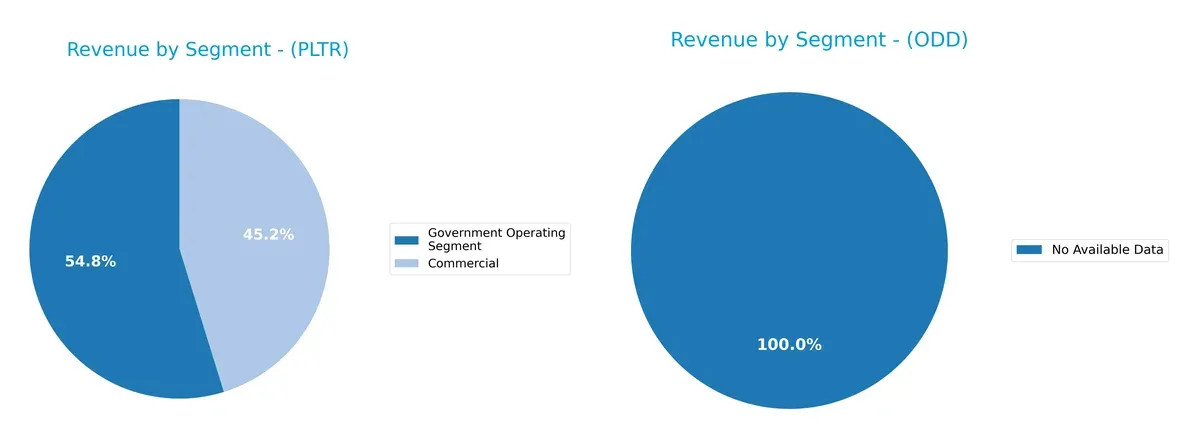
Palantir anchors its revenue in two clear segments: government and commercial. In 2024, government contracts generated $1.57B, slightly dwarfing the $1.30B commercial revenue. Oddity Tech Ltd. lacks available data, preventing segmentation analysis. Palantir’s dual-segment focus reduces concentration risk while leveraging its government ecosystem lock-in, a strategy that has driven consistent growth and sustained competitive advantage.
Strengths and Weaknesses Comparison
This table compares the Strengths and Weaknesses of Palantir Technologies Inc. and Oddity Tech Ltd.:
Palantir Strengths
- Strong profitability with 36.31% net margin
- Robust ROE at 22.0%
- Favorable ROIC at 17.95%
- Low debt-to-assets at 2.58%
- High current and quick ratios indicating liquidity
- Diversified revenue streams across commercial and government sectors
- Significant global presence with major US, UK, and Rest of World sales
Oddity Strengths
- Higher ROE of 35.95% and excellent ROIC at 28.56%
- Strong net margin at 15.69%
- Favorable current ratio at 1.79 and low debt-to-assets at 5.17%
- High asset turnover of 1.47 and fixed asset turnover of 19.38
- Solid interest coverage ratio at 1521.05
- Geographic diversification in North America and other countries
Palantir Weaknesses
- Unfavorable high P/E at 259.19 and P/B at 57.02 indicating possible overvaluation
- High current ratio of 7.11 may signal inefficient asset use
- WACC higher than ideal at 11.79%
- No dividend yield
- Moderate asset turnover at 0.5
Oddity Weaknesses
- Unfavorable WACC at 18.7% reducing capital efficiency
- P/B ratio unfavorable at 8.54
- Quick ratio neutral at 0.99 indicating tight liquidity
- No dividend yield
- Slightly higher debt-to-assets ratio at 5.17%
Palantir excels in profitability and liquidity with broad market reach but faces valuation and efficiency concerns. Oddity shows superior capital returns and turnover metrics but carries higher capital costs and moderate liquidity risks. Both must balance growth with prudent capital allocation in competitive markets.
The Moat Duel: Analyzing Competitive Defensibility
A structural moat alone shields long-term profits from relentless competitive pressures and market disruption. Let’s dissect the competitive barriers of two tech firms:
Palantir Technologies Inc.: Data Integration Moat
Palantir’s core advantage lies in its proprietary data integration and analytics platforms. This manifests in a very favorable 6.16% ROIC premium over WACC and soaring margins above 30%. Expansion into AI-driven intelligence platforms in 2026 should deepen its moat.
Oddity Tech Ltd.: Brand-Driven Cost Advantage
Oddity leverages digital-first branding and cost efficiencies in beauty tech, generating a higher 9.86% ROIC premium versus WACC but lower margins near 18%. Its challenge is scaling global reach, though market disruption opportunities remain promising.
The Moat Showdown: Data Dominance vs. Brand-Cost Efficiency
Palantir’s moat runs deeper with sustainable, growing returns from complex data ecosystems. Oddity’s cost and brand moat is narrower but profitable. Palantir stands better poised to defend market share amid intensifying tech competition.
Which stock offers better returns?
The past year showed starkly contrasting price dynamics, with Palantir Technologies soaring sharply before recent mild declines, while Oddity Tech faced a consistent downward trajectory.
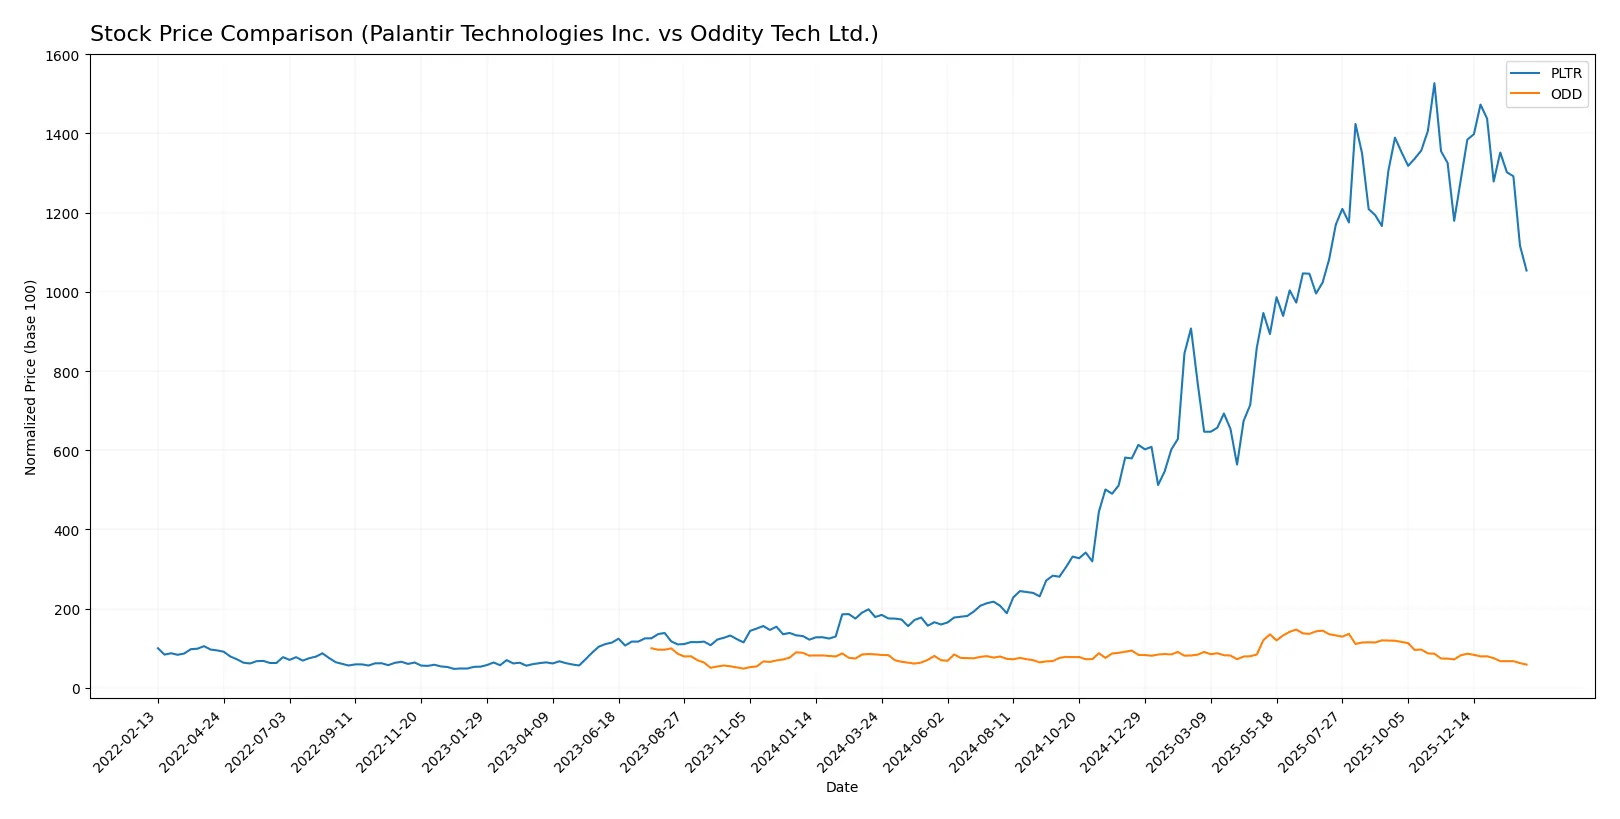
Trend Comparison
Palantir’s stock gained 489% over the past 12 months, marking a strong bullish trend despite recent deceleration and a 10.7% drop in the last quarter. Its volatility is high with a 59.55 standard deviation.
Oddity Tech’s stock declined 30.4% over the same period, confirming a bearish trend with further 18% losses recently. The deceleration in decline and lower volatility (11.97 std dev) suggest weakening selling pressure.
Palantir outperformed Oddity Tech significantly, delivering the highest market returns despite recent softness, contrasting with Oddity’s sustained bearish momentum.
Target Prices
Analysts show a bullish consensus for Palantir Technologies and Oddity Tech, signaling strong upside potential.
| Company | Target Low | Target High | Consensus |
|---|---|---|---|
| Palantir Technologies Inc. | 180 | 230 | 198.8 |
| Oddity Tech Ltd. | 40 | 80 | 66.33 |
The target consensus for Palantir sits 46% above its current 136 USD price, reflecting optimism in its software platform growth. Oddity Tech’s consensus price more than doubles its 31 USD market price, indicating high expectations despite its elevated beta risk.

Don’t Let Luck Decide Your Entry Point
Optimize your entry points with our advanced ProRealTime indicators. You’ll get efficient buy signals with precise price targets for maximum performance. Start outperforming now!
How do institutions grade them?
Here is a summary of recent institutional grades for Palantir Technologies Inc. and Oddity Tech Ltd.:
Palantir Technologies Inc. Grades
The following table shows recent grades from notable financial institutions for Palantir Technologies Inc.:
| Grading Company | Action | New Grade | Date |
|---|---|---|---|
| UBS | Maintain | Neutral | 2026-02-03 |
| DA Davidson | Maintain | Neutral | 2026-02-03 |
| Citigroup | Maintain | Buy | 2026-02-03 |
| Citigroup | Upgrade | Buy | 2026-01-12 |
| Morgan Stanley | Maintain | Equal Weight | 2025-11-04 |
| DA Davidson | Maintain | Neutral | 2025-11-04 |
| Piper Sandler | Maintain | Overweight | 2025-11-04 |
| Cantor Fitzgerald | Maintain | Neutral | 2025-11-04 |
| Baird | Maintain | Neutral | 2025-11-04 |
| B of A Securities | Maintain | Buy | 2025-11-04 |
Oddity Tech Ltd. Grades
Below are the most recent institutional grades for Oddity Tech Ltd.:
| Grading Company | Action | New Grade | Date |
|---|---|---|---|
| Keybanc | Maintain | Overweight | 2026-01-08 |
| JP Morgan | Maintain | Overweight | 2025-12-12 |
| Barclays | Maintain | Equal Weight | 2025-11-21 |
| JP Morgan | Maintain | Overweight | 2025-11-21 |
| Morgan Stanley | Maintain | Equal Weight | 2025-11-21 |
| Needham | Maintain | Buy | 2025-11-20 |
| Keybanc | Maintain | Overweight | 2025-10-08 |
| JMP Securities | Maintain | Market Outperform | 2025-09-23 |
| Morgan Stanley | Maintain | Equal Weight | 2025-08-06 |
| JMP Securities | Maintain | Market Outperform | 2025-08-05 |
Which company has the best grades?
Oddity Tech Ltd. maintains slightly stronger grades overall, including multiple “Overweight” and “Market Outperform” ratings. Palantir’s grades cluster around “Neutral” and “Buy,” indicating more cautious optimism. Investors may perceive Oddity as having higher institutional conviction.
Risks specific to each company
The following categories identify the critical pressure points and systemic threats facing both firms in the 2026 market environment:
1. Market & Competition
Palantir Technologies Inc.
- Dominates software infrastructure for intelligence, but faces pressure from larger tech firms and fast innovation cycles.
Oddity Tech Ltd.
- Competes in consumer-tech beauty sector with digital-first brands, challenged by offline incumbents and brand loyalty.
2. Capital Structure & Debt
Palantir Technologies Inc.
- Maintains extremely low debt (D/E 0.03), signaling strong balance sheet and low financial risk.
Oddity Tech Ltd.
- Slightly higher leverage (D/E 0.08) but still conservative, manageable debt with healthy interest coverage.
3. Stock Volatility
Palantir Technologies Inc.
- Beta 1.69 indicates above-market volatility; wide price range (66.12-207.52) highlights investor uncertainty.
Oddity Tech Ltd.
- Beta 3.19 signals high volatility and speculative trading risk; narrower price range but sharp swings present.
4. Regulatory & Legal
Palantir Technologies Inc.
- Subject to strict government regulations and geopolitical scrutiny due to intelligence sector focus.
Oddity Tech Ltd.
- Faces consumer protection and international regulatory hurdles in beauty products and digital marketing.
5. Supply Chain & Operations
Palantir Technologies Inc.
- Software delivery model mitigates physical supply chain risks; operational scale is significant.
Oddity Tech Ltd.
- Depends on product manufacturing and distribution; supply chain disruptions could impact revenues.
6. ESG & Climate Transition
Palantir Technologies Inc.
- Limited direct environmental footprint; governance in handling sensitive data is critical.
Oddity Tech Ltd.
- Consumer goods face increasing ESG scrutiny, especially on sustainable sourcing and packaging.
7. Geopolitical Exposure
Palantir Technologies Inc.
- High exposure due to US and allied intelligence contracts; geopolitical tensions could impact revenue.
Oddity Tech Ltd.
- Israeli base and global consumer markets expose it to regional instability and trade risks.
Which company shows a better risk-adjusted profile?
Palantir’s dominant government contracts and strong balance sheet reduce financial risks but expose it to regulatory and geopolitical uncertainty. Oddity’s higher stock volatility and supply chain vulnerabilities amplify risk despite solid profitability metrics. Palantir’s low leverage and stable operating model offer a safer risk-adjusted profile. Oddity’s rapid consumer tech growth comes with amplified market and operational risks. The key red flag for Palantir is its stretched valuation metrics, while Oddity’s stock volatility demands caution. Recent data show Palantir’s Altman Z-score and Piotroski score far exceed Oddity’s, underscoring financial stability despite market uncertainties.
Final Verdict: Which stock to choose?
Palantir Technologies Inc. wields unmatched operational efficiency, turning data into a powerful cash-generating engine. Its robust return on invested capital, well above its cost of capital, signals a sustainable competitive edge. A point of vigilance lies in its lofty valuation multiples, which could challenge near-term price appreciation. It suits aggressive growth portfolios that can stomach valuation risks.
Oddity Tech Ltd. boasts a strategic moat rooted in strong capital efficiency and recurring revenue streams, reflected in superior return on equity and stable cash flows. It offers a safer profile compared to Palantir, with more reasonable valuation and solid financial stability. This aligns well with growth-at-a-reasonable-price (GARP) investors seeking balanced upside and risk control.
If you prioritize high operational leverage and are comfortable with premium valuations, Palantir outshines as a dynamic growth play. However, if you seek better valuation discipline and a steadier financial footing, Oddity Tech offers superior stability and a compelling moat. Both present very favorable economic moats, but your risk tolerance and investment horizon will guide the best fit.
Disclaimer: Investment carries a risk of loss of initial capital. The past performance is not a reliable indicator of future results. Be sure to understand risks before making an investment decision.
Go Further
I encourage you to read the complete analyses of Palantir Technologies Inc. and Oddity Tech Ltd. to enhance your investment decisions: