In today’s fast-evolving technology landscape, Oracle Corporation and Oddity Tech Ltd. represent two distinct yet intriguing players in the software infrastructure sector. Oracle, a longstanding giant, delivers comprehensive enterprise cloud solutions, while Oddity Tech innovates by blending consumer tech with digital-first beauty and wellness brands. This comparison explores their market positions and innovation strategies to help you identify the most compelling investment opportunity. Let’s dive into which company deserves a spot in your portfolio.

Table of contents
Companies Overview
I will begin the comparison between Oracle Corporation and Oddity Tech Ltd. by providing an overview of these two companies and their main differences.
Oracle Corporation Overview
Oracle Corporation is a major player in the software infrastructure industry, focusing on enterprise IT environments worldwide. The company offers a broad portfolio including cloud software applications, industry-specific cloud solutions, infrastructure technologies like Oracle Database and Java, as well as hardware products and consulting services. Founded in 1977 and headquartered in Austin, Texas, Oracle serves a diverse client base including businesses, government agencies, and educational institutions.
Oddity Tech Ltd. Overview
Oddity Tech Ltd. operates as a consumer-tech company specializing in beauty and wellness products enhanced by its proprietary PowerMatch technology. The company builds digital-first brands to challenge traditional offline markets, offering a range of products under the IL MAKIAGE and SpoiledChild brands. Incorporated in 2013 and based in Tel Aviv-Jaffa, Israel, Oddity Tech focuses on innovation within the beauty and wellness sectors.
Key similarities and differences
Both Oracle and Oddity Tech operate within the technology sector and focus on software infrastructure but target vastly different markets and scales. Oracle’s business model centers on enterprise software, cloud services, and hardware solutions for large institutions, while Oddity Tech emphasizes consumer products and digital branding within beauty and wellness industries. Oracle is a well-established giant with a market cap over 549B USD, whereas Oddity Tech is a smaller, rapidly growing company valued around 2B USD.
Income Statement Comparison
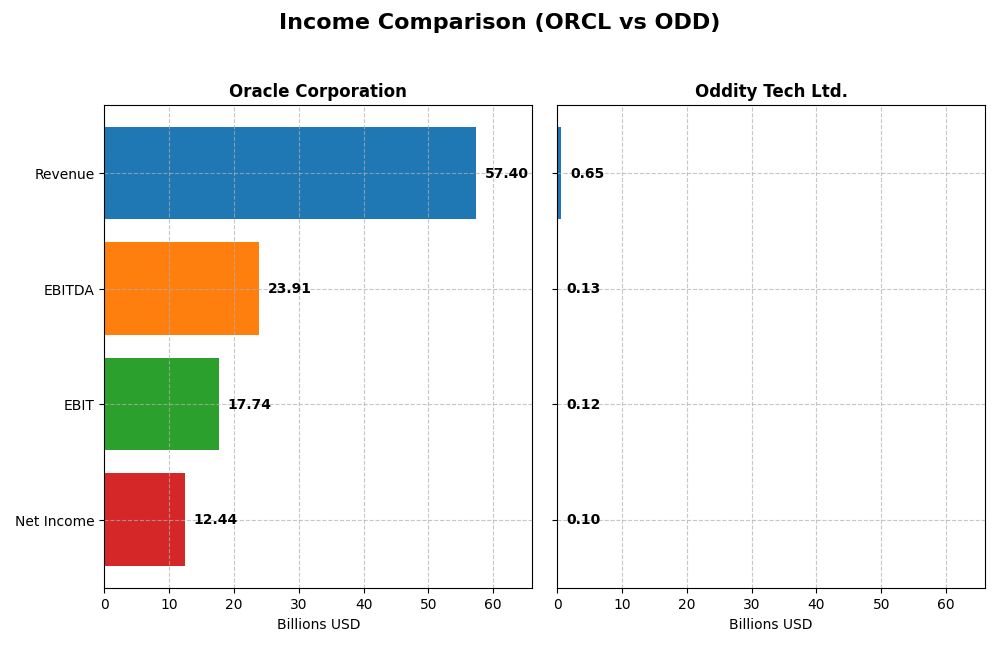
This table presents a side-by-side comparison of key income statement metrics for Oracle Corporation and Oddity Tech Ltd. for their most recent fiscal years.
| Metric | Oracle Corporation | Oddity Tech Ltd. |
|---|---|---|
| Market Cap | 549B | 2B |
| Revenue | 57.4B | 647M |
| EBITDA | 23.9B | 125M |
| EBIT | 17.7B | 116M |
| Net Income | 12.4B | 101M |
| EPS | 4.46 | 1.78 |
| Fiscal Year | 2025 | 2024 |
Income Statement Interpretations
Oracle Corporation
Oracle’s revenue demonstrated consistent growth from 40.5B in 2021 to 57.4B in 2025, an overall increase of 41.8%. Net income showed volatility, peaking in 2021 at 13.7B but declining to 12.4B in 2025. Margins remain strong with a favorable gross margin of 70.5% and net margin of 21.7%. In 2025, revenue grew 8.4% with net margin improving by 9.7%, indicating solid operational efficiency.
Oddity Tech Ltd.
Oddity Tech exhibited rapid expansion with revenue surging from 110M in 2020 to 647M in 2024, a 485% increase. Net income grew even more impressively by 766%, reaching 101M in 2024. Margins improved alongside growth, with a gross margin of 72.4% and a net margin of 15.7% in the latest year. The latest fiscal year saw revenue growth of 27.2% and a net margin increase of 36.3%, signaling accelerating profitability.
Which one has the stronger fundamentals?
Oracle presents stable, high-margin profitability with steady revenue growth and favorable operating efficiency, though net income declined overall. Oddity Tech shows exceptional growth rates in revenue and net income, with improving margins reflecting scaling potential. While Oracle’s fundamentals are robust and mature, Oddity’s rapid expansion and margin gains highlight strong growth fundamentals in a smaller base.
Financial Ratios Comparison
The table below provides a side-by-side comparison of key financial ratios for Oracle Corporation and Oddity Tech Ltd. based on their most recent fiscal year data.
| Ratios | Oracle Corporation (2025) | Oddity Tech Ltd. (2024) |
|---|---|---|
| ROE | 60.8% | 35.9% |
| ROIC | 10.9% | 28.6% |
| P/E | 37.1 | 23.7 |
| P/B | 22.6 | 8.5 |
| Current Ratio | 0.75 | 1.79 |
| Quick Ratio | 0.75 | 0.99 |
| D/E (Debt-to-Equity) | 5.09 | 0.08 |
| Debt-to-Assets | 61.8% | 5.2% |
| Interest Coverage | 4.94 | 1521 |
| Asset Turnover | 0.34 | 1.47 |
| Fixed Asset Turnover | 1.32 | 19.38 |
| Payout Ratio | 38.1% | 0% |
| Dividend Yield | 1.03% | 0% |
Interpretation of the Ratios
Oracle Corporation
Oracle shows strong profitability with a 21.68% net margin and an exceptionally high 60.84% return on equity, reflecting efficient use of shareholder funds. However, several liquidity and leverage ratios are weak, including a low current ratio of 0.75 and a high debt-to-assets ratio of 61.83%, which raises concerns about financial risk. Oracle pays dividends with a modest 1.03% yield, supported by steady payouts and share buybacks, though coverage by free cash flow appears strained.
Oddity Tech Ltd.
Oddity Tech presents generally strong ratios, including a 15.69% net margin, 35.95% return on equity, and a notably high 28.56% return on invested capital, indicating solid operational efficiency. The company maintains healthy liquidity with a current ratio of 1.79 and minimal debt, evidenced by a debt-to-assets ratio of 5.17%. Oddity does not pay dividends, likely prioritizing reinvestment and growth, consistent with its high beta and growth phase status.
Which one has the best ratios?
Oddity Tech’s financial ratios are predominantly favorable, showcasing strong profitability, efficient asset use, and low leverage, which align with a growth-oriented profile. In contrast, Oracle, while highly profitable, faces challenges in liquidity and leverage metrics. Overall, Oddity Tech’s ratios present a more favorable balance of risk and operational performance compared to Oracle’s mix of strengths and weaknesses.
Strategic Positioning
This section compares the strategic positioning of Oracle Corporation and Oddity Tech Ltd. across Market position, Key segments, and Exposure to technological disruption:
Oracle Corporation
- Large market cap of 549B with significant competitive pressure in software infrastructure sector.
- Diversified business with Cloud & License (49B), Hardware (3B), Services (5B) driving revenue.
- Exposure to technological disruption through cloud software, autonomous database, IoT, and blockchain.
Oddity Tech Ltd.
- Small market cap of 2B, operating in consumer-tech with niche competitive pressure.
- Focused on beauty and wellness digital-first brands using PowerMatch technology.
- Disrupts offline beauty and wellness markets using digital-first consumer technology.
Oracle Corporation vs Oddity Tech Ltd. Positioning
Oracle pursues a diversified approach with multiple large-scale segments including cloud, hardware, and services, benefiting from scale but facing intense competition. Oddity Tech concentrates on digital consumer brands in beauty and wellness, leveraging technology to disrupt traditional markets but with a smaller scale and narrower focus.
Which has the best competitive advantage?
Oddity Tech demonstrates a strong and growing competitive advantage with ROIC well above WACC and increasing profitability, indicating durable value creation. Oracle currently sheds value with declining ROIC below WACC, reflecting weaker economic moat status.
Stock Comparison
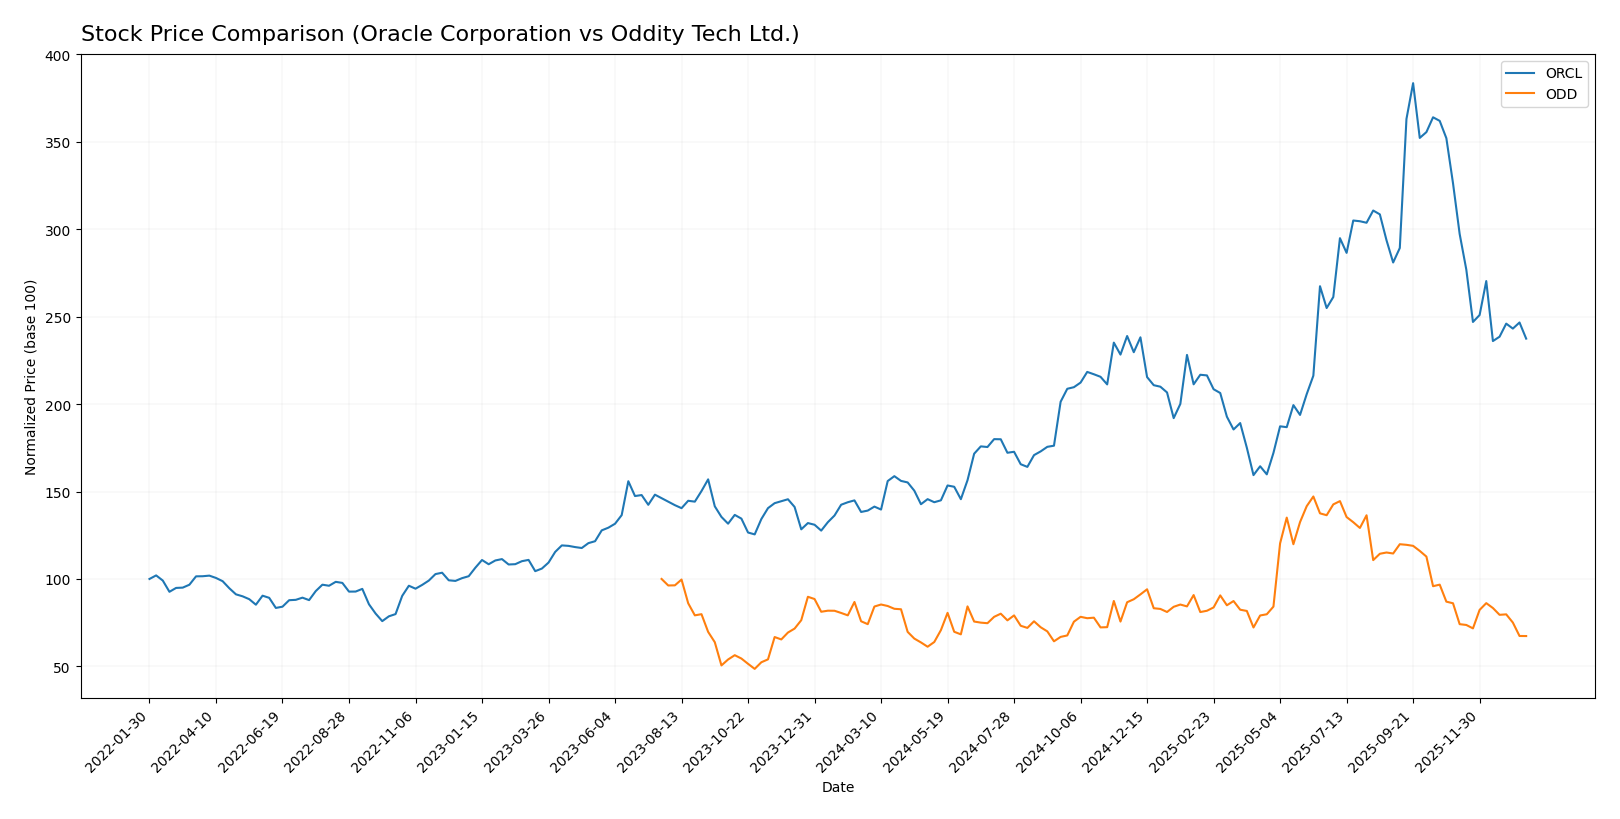
The stock price movements of Oracle Corporation and Oddity Tech Ltd. over the past 12 months reveal contrasting trends, with Oracle showing strong gains despite recent pullbacks, while Oddity Tech exhibits a consistent decline with decelerating losses.
Trend Analysis
Oracle Corporation’s stock demonstrated a bullish trend over the past year with a 70.69% price increase, though the trend is currently decelerating. Notably, prices ranged from a low of 111.95 to a high of 308.66, with recent months showing a -27.23% decline.
Oddity Tech Ltd. experienced a bearish trend with a -9.16% price change over the same period, also with deceleration in losses. The stock’s price fluctuated between 32.19 and 77.35, and the recent trend shows a further -21.77% decline.
Comparing both stocks, Oracle delivered the highest market performance with a substantial positive gain, whereas Oddity Tech faced ongoing downward pressure and weaker price returns.
Target Prices
Analysts present a clear consensus on target prices for Oracle Corporation and Oddity Tech Ltd.
| Company | Target High | Target Low | Consensus |
|---|---|---|---|
| Oracle Corporation | 400 | 175 | 314.08 |
| Oddity Tech Ltd. | 80 | 40 | 66.33 |
Oracle’s target consensus at 314.08 significantly exceeds its current price of 191.09, indicating strong upside potential. Oddity Tech’s consensus target of 66.33 is almost double its current 35.4 price, reflecting bullish analyst expectations.
Analyst Opinions Comparison
This section compares analysts’ ratings and grades for Oracle Corporation and Oddity Tech Ltd.:
Rating Comparison
Oracle Corporation Rating
- Rating: B, classified as Very Favorable by analysts.
- Discounted Cash Flow Score: Moderate with a score of 3.
- ROE Score: Very Favorable with the highest score of 5.
- ROA Score: Favorable at 4, showing efficient asset use.
- Debt To Equity Score: Very Unfavorable at 1, signaling higher risk.
- Overall Score: Moderate with a score of 3.
Oddity Tech Ltd. Rating
- Rating: B+, also rated Very Favorable by analysts.
- Discounted Cash Flow Score: Favorable at 4, indicating better valuation.
- ROE Score: Equally Very Favorable with a score of 5.
- ROA Score: Also Favorable at 4, matching Oracle’s efficiency.
- Debt To Equity Score: Moderate at 3, indicating better balance sheet stability.
- Overall Score: Moderate with the same score of 3.
Which one is the best rated?
Oddity Tech Ltd. holds a slightly better rating with a B+ compared to Oracle’s B, mainly due to its higher Discounted Cash Flow and Debt To Equity scores. Both companies share equal strengths in ROE, ROA, and Overall Score.
Scores Comparison
Here is a comparison of the Altman Z-Score and Piotroski Score for Oracle Corporation and Oddity Tech Ltd.:
ORCL Scores
- Altman Z-Score: 2.43, grey zone indicating moderate bankruptcy risk.
- Piotroski Score: 5, average financial strength.
ODD Scores
- Altman Z-Score: 3.78, safe zone indicating low bankruptcy risk.
- Piotroski Score: 6, average financial strength.
Which company has the best scores?
Based strictly on the provided data, Oddity Tech Ltd. has a better Altman Z-Score in the safe zone, while both companies have average Piotroski Scores. Therefore, Oddity Tech Ltd. shows stronger financial stability overall.
Grades Comparison
Here is the comparison of recent grades provided by recognized financial institutions for both companies:
Oracle Corporation Grades
The following table summarizes Oracle Corporation’s grades from major grading companies over the past months:
| Grading Company | Action | New Grade | Date |
|---|---|---|---|
| UBS | Maintain | Buy | 2026-01-05 |
| RBC Capital | Maintain | Sector Perform | 2026-01-05 |
| Jefferies | Maintain | Buy | 2026-01-05 |
| Goldman Sachs | Maintain | Neutral | 2025-12-12 |
| Keybanc | Maintain | Overweight | 2025-12-11 |
| UBS | Maintain | Buy | 2025-12-11 |
| Citigroup | Maintain | Buy | 2025-12-11 |
| JP Morgan | Maintain | Neutral | 2025-12-11 |
| DA Davidson | Maintain | Neutral | 2025-12-11 |
| Scotiabank | Maintain | Sector Outperform | 2025-12-11 |
Oracle’s grades show a stable positive trend, predominantly buy and overweight ratings, with some neutral and sector perform assessments.
Oddity Tech Ltd. Grades
The following table summarizes Oddity Tech Ltd.’s grades from recognized grading companies:
| Grading Company | Action | New Grade | Date |
|---|---|---|---|
| Keybanc | Maintain | Overweight | 2026-01-08 |
| JP Morgan | Maintain | Overweight | 2025-12-12 |
| JP Morgan | Maintain | Overweight | 2025-11-21 |
| Barclays | Maintain | Equal Weight | 2025-11-21 |
| Morgan Stanley | Maintain | Equal Weight | 2025-11-21 |
| Needham | Maintain | Buy | 2025-11-20 |
| Keybanc | Maintain | Overweight | 2025-10-08 |
| JMP Securities | Maintain | Market Outperform | 2025-09-23 |
| Morgan Stanley | Maintain | Equal Weight | 2025-08-06 |
| JMP Securities | Maintain | Market Outperform | 2025-08-05 |
Oddity Tech exhibits a consistent pattern of overweight and market outperform ratings, with several equal weight assessments, indicating generally positive but somewhat mixed views.
Which company has the best grades?
Both Oracle Corporation and Oddity Tech Ltd. hold a consensus “Buy” rating, but Oracle receives a higher volume of buy and sector outperform grades from a broader range of firms. This could suggest relatively stronger analyst confidence in Oracle, potentially implying more stable investor sentiment compared to Oddity Tech.
Strengths and Weaknesses
Below is a comparison of key strengths and weaknesses between Oracle Corporation (ORCL) and Oddity Tech Ltd. (ODD) based on their latest financial and strategic data.
| Criterion | Oracle Corporation (ORCL) | Oddity Tech Ltd. (ODD) |
|---|---|---|
| Diversification | Strong diversification with Cloud & License $49.2B, Services $5.2B, Hardware $2.9B | Less diversified, focused on tech innovation and software solutions |
| Profitability | High net margin 21.7%, ROE 60.8%, ROIC 10.9% but declining ROIC trend | Solid net margin 15.7%, ROE 36.0%, ROIC 28.6% with growing trend |
| Innovation | Moderate innovation pace, facing challenges in sustaining growth | High innovation, demonstrated by strong ROIC growth and competitive advantage |
| Global presence | Extensive global footprint as a mature IT giant | Emerging global presence, focused on niche markets |
| Market Share | Large market share in enterprise software and cloud | Growing market share in tech sectors but smaller scale |
Oracle shows strength in diversification and profitability metrics, but its profitability and return on capital are declining, indicating caution. Oddity Tech demonstrates robust profitability growth and innovation, suggesting a durable competitive advantage despite smaller scale and less diversification.
The key takeaway is that Oddity Tech offers promising growth and value creation, while Oracle, though established, faces challenges in sustaining profitability and efficient capital use. Investors should weigh stability against growth potential accordingly.
Risk Analysis
Below is a comparative overview of key risk factors for Oracle Corporation and Oddity Tech Ltd. based on the most recent data available in 2026:
| Metric | Oracle Corporation (ORCL) | Oddity Tech Ltd. (ODD) |
|---|---|---|
| Market Risk | Beta 1.65, sensitive to tech cycles | Beta 3.18, high volatility exposure |
| Debt level | High leverage (D/E 5.09), 61.8% debt to assets | Very low leverage (D/E 0.08), 5.17% debt to assets |
| Regulatory Risk | Moderate, US tech regulations | Moderate, Israel and global compliance challenges |
| Operational Risk | Large scale complexity, legacy systems | Smaller scale, reliance on innovation and brand growth |
| Environmental Risk | Moderate, increasing sustainability pressure | Low, consumer product focus with growing ESG initiatives |
| Geopolitical Risk | US-centric but global operations | Higher, due to geopolitical tensions in Middle East region |
The most impactful risks are Oracle’s high debt level and market sensitivity with a beta of 1.65, increasing financial risk amid market fluctuations. Oddity Tech’s high beta of 3.18 indicates greater volatility risk, though its low debt offers resilience. Geopolitical tensions pose a notable threat to Oddity’s stability. Investors should weigh Oracle’s financial leverage risk against Oddity’s market volatility and geopolitical exposure.
Which Stock to Choose?
Oracle Corporation (ORCL) shows a favorable income evolution with 8.38% revenue growth in 2025, strong profitability indicated by a 21.68% net margin, but an unfavorable debt profile and a global ratios opinion deemed unfavorable. Its rating is very favorable (B) despite some financial leverage concerns.
Oddity Tech Ltd. (ODD) presents a robust income growth of 27.2% in 2024, excellent profitability metrics including a 15.69% net margin, and a strong balance sheet with low debt levels. Its financial ratios are globally favorable, and it holds a very favorable rating (B+).
For investors prioritizing financial stability and value creation, Oddity Tech’s very favorable moat and strong ratio evaluations might appear more attractive, while risk-tolerant investors focused on established profitability might consider Oracle’s strong income statement and rating, despite its higher leverage and mixed ratios.
Disclaimer: Investment carries a risk of loss of initial capital. The past performance is not a reliable indicator of future results. Be sure to understand risks before making an investment decision.
Go Further
I encourage you to read the complete analyses of Oracle Corporation and Oddity Tech Ltd. to enhance your investment decisions: