In the dynamic world of technology, Okta, Inc. and Oddity Tech Ltd. stand out as intriguing companies within the software infrastructure sector. Okta leads with enterprise identity solutions, while Oddity innovates by integrating technology into beauty and wellness products. Their distinct approaches highlight the evolving tech landscape’s breadth. This article will analyze both companies to reveal which presents the most compelling investment opportunity for your portfolio in 2026.

Table of contents
Companies Overview
I will begin the comparison between Okta and Oddity Tech by providing an overview of these two companies and their main differences.
Okta Overview
Okta, Inc. is a US-based technology company specializing in identity solutions for enterprises, SMBs, universities, non-profits, and government agencies. Its flagship product, the Okta Identity Cloud, offers a comprehensive suite of security and access management tools, including Single Sign-On, Adaptive Multi-Factor Authentication, and API Access Management. Okta operates globally and employs about 5,900 people, positioning itself as a leader in software infrastructure.
Oddity Tech Overview
Oddity Tech Ltd., headquartered in Tel Aviv-Jaffa, Israel, is a consumer-tech company focused on beauty and wellness products powered by its proprietary PowerMatch technology. It develops and scales digital-first brands to challenge traditional offline markets, offering cosmetics and skincare under the IL MAKIAGE and SpoiledChild brands. With around 490 employees, Oddity Tech went public in 2023 and targets global consumers through innovative digital platforms.
Key similarities and differences
Both Okta and Oddity Tech operate in the technology sector and trade on NASDAQ, yet they serve distinct markets: Okta focuses on enterprise software infrastructure and identity security, while Oddity Tech targets consumer beauty and wellness. Okta’s business model centers on B2B cloud solutions, whereas Oddity Tech builds digital-first consumer brands. Their employee counts and market caps also contrast significantly, reflecting their differing scales and industry focuses.
Income Statement Comparison
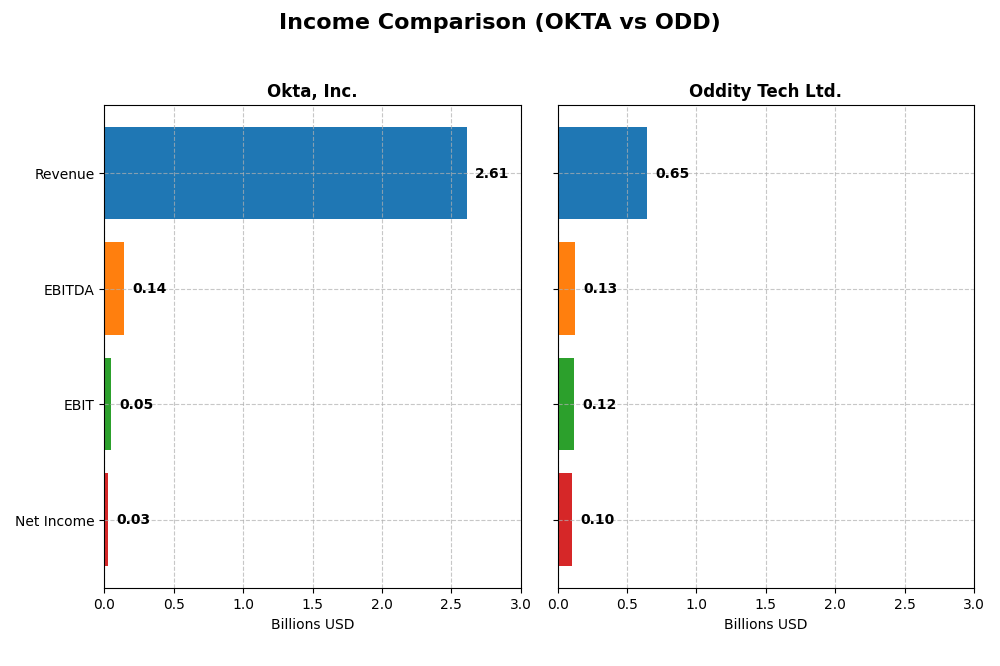
The table below compares key income statement metrics for the most recent fiscal year of Okta, Inc. and Oddity Tech Ltd., providing a snapshot of their financial performance.
| Metric | Okta, Inc. (OKTA) | Oddity Tech Ltd. (ODD) |
|---|---|---|
| Market Cap | 15.2B | 2.01B |
| Revenue | 2.61B | 647M |
| EBITDA | 139M | 125M |
| EBIT | 51M | 116M |
| Net Income | 28M | 101M |
| EPS | 0.17 | 1.78 |
| Fiscal Year | 2025 | 2024 |
Income Statement Interpretations
Okta, Inc.
Okta’s revenue and net income have shown strong growth from 2021 to 2025, with revenue rising from $835M to $2.61B and net income recovering from a loss of $266M in 2021 to a modest profit of $28M in 2025. Gross margins remained favorable around 76%, while net margins improved to a neutral 1.07%. The latest year shows solid revenue growth of 15.3% and a significant turnaround in profitability.
Oddity Tech Ltd.
Oddity Tech demonstrated robust expansion in revenue and net income between 2020 and 2024, with revenue surging from $111M to $647M and net income climbing from $12M to $101M. Margins have been consistently favorable, with a 72.4% gross margin and a strong 15.7% net margin in 2024. The most recent year recorded a 27.2% revenue increase and a 36.3% improvement in net margin, indicating accelerating profitability.
Which one has the stronger fundamentals?
Both companies exhibit favorable income statement trends, but Oddity Tech shows higher margins and faster growth rates overall, including a substantially larger net margin and EPS growth. Okta’s margins are stable but less pronounced, with a recent return to profitability. Oddity Tech’s consistent profitability and margin expansion suggest comparatively stronger fundamentals based solely on income metrics.
Financial Ratios Comparison
The table below presents a side-by-side comparison of key financial ratios for Okta, Inc. and Oddity Tech Ltd., based on their most recent fiscal year data.
| Ratios | Okta, Inc. (2025) | Oddity Tech Ltd. (2024) |
|---|---|---|
| ROE | 0.44% | 35.95% |
| ROIC | -0.61% | 28.56% |
| P/E | 570.6 | 23.75 |
| P/B | 2.49 | 8.54 |
| Current Ratio | 1.35 | 1.79 |
| Quick Ratio | 1.35 | 0.99 |
| D/E (Debt-to-Equity) | 0.15 | 0.08 |
| Debt-to-Assets | 10.1% | 5.17% |
| Interest Coverage | -14.8 | 1521.1 |
| Asset Turnover | 0.28 | 1.47 |
| Fixed Asset Turnover | 22.31 | 19.38 |
| Payout Ratio | 0 | 0 |
| Dividend Yield | 0% | 0% |
Interpretation of the Ratios
Okta, Inc.
Okta’s financial ratios present a mixed picture with 42.86% favorable and 42.86% unfavorable ratings. Key concerns include low net margin (1.07%), negative return on invested capital (-0.61%), and a very high P/E ratio of 570.6, indicating possible overvaluation. The company shows a solid balance sheet with favorable debt-to-equity (0.15) and interest coverage (10.2). Okta does not pay dividends, reflecting its reinvestment focus and growth strategy.
Oddity Tech Ltd.
Oddity Tech demonstrates strong financial health, with 64.29% of its ratios rated favorable. It boasts a robust net margin of 15.69%, high return on equity (35.95%), and return on invested capital (28.56%). The current ratio of 1.79 and minimal debt-to-assets ratio of 5.17% underscore liquidity and low leverage. Oddity Tech does not distribute dividends, likely prioritizing reinvestment and expansion.
Which one has the best ratios?
Oddity Tech holds the advantage with a higher proportion of favorable ratios and stronger profitability metrics. Okta’s ratios reveal several weaknesses, including low profitability and high valuation metrics, despite sound liquidity and debt management. Overall, Oddity Tech’s financial ratios suggest a more favorable position in terms of profitability and operational efficiency.
Strategic Positioning
This section compares the strategic positioning of Okta, Inc. and Oddity Tech Ltd. including market position, key segments, and exposure to technological disruption:
Okta, Inc.
- Leading identity solutions provider with strong market cap and moderate competitive pressure.
- Focuses on identity cloud platform serving enterprises, SMBs, and public sectors; subscription-driven revenue.
- Exposed to cloud infrastructure and cybersecurity tech, continuously evolving authentication methods.
Oddity Tech Ltd.
- Consumer-tech disruptor in beauty and wellness with smaller market cap and high volatility.
- Digital-first brands in beauty/wellness leveraging PowerMatch technology; product sales.
- Disrupts offline beauty industry via digital technology but less directly tied to software disruption.
Okta vs Oddity Positioning
Okta pursues a diversified B2B SaaS model focusing on identity security across sectors, benefiting from scale but facing intense competition. Oddity is more concentrated in consumer beauty tech, leveraging digital branding to challenge traditional markets but with higher beta risk and smaller scale.
Which has the best competitive advantage?
Oddity Tech shows a very favorable MOAT with growing ROIC above WACC, indicating durable competitive advantage. Okta has a slightly unfavorable MOAT, shedding value despite improving profitability, signaling weaker capital efficiency.
Stock Comparison
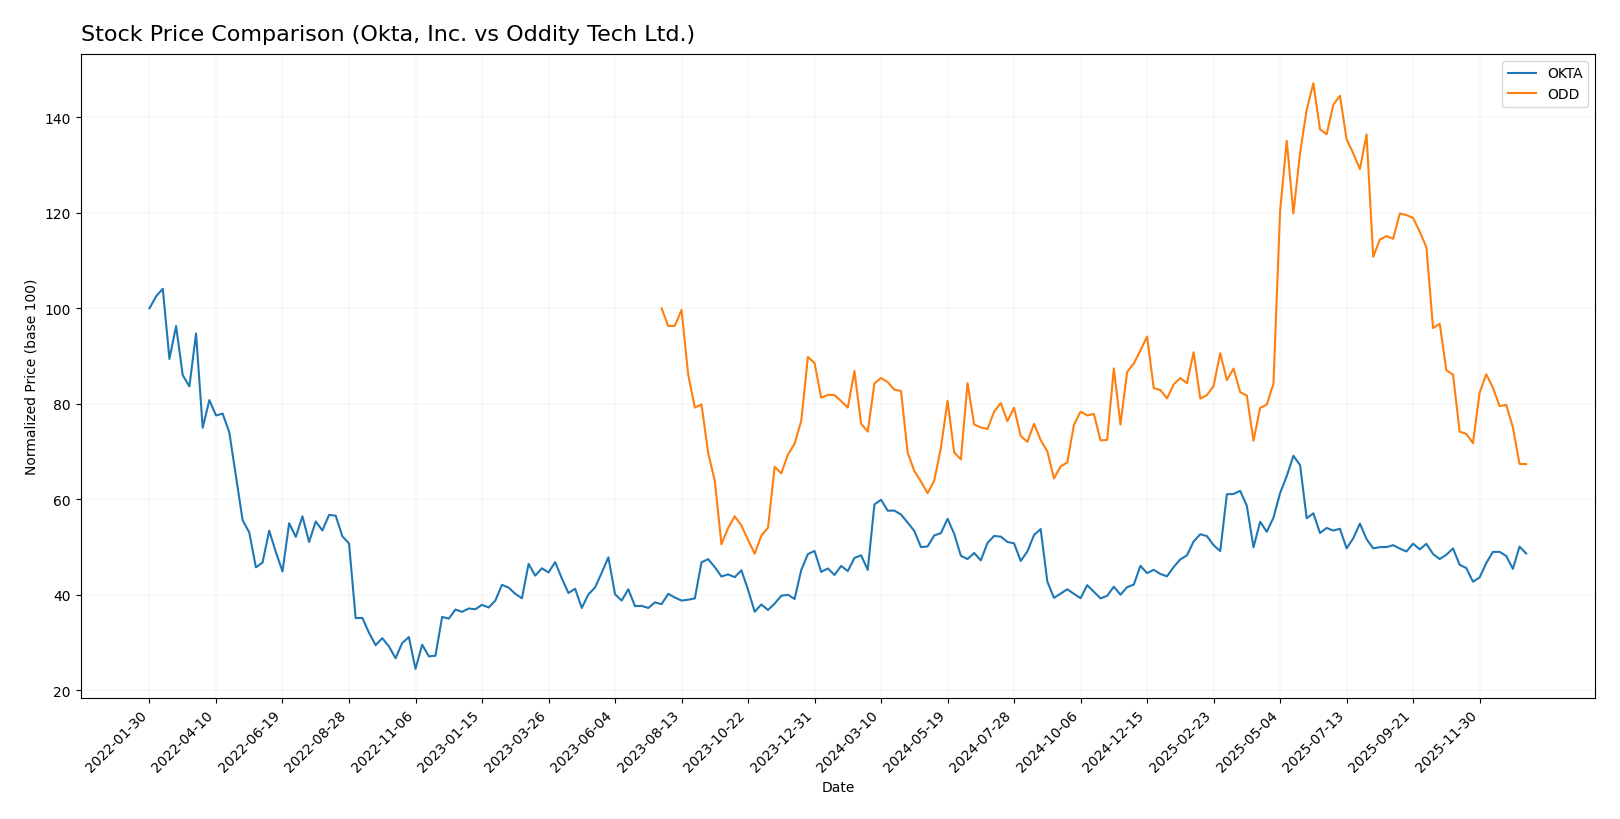
The stock prices of Okta, Inc. and Oddity Tech Ltd. over the past 12 months reveal contrasting dynamics, with Okta showing a bullish acceleration and Oddity Tech experiencing a bearish deceleration, reflecting diverging market sentiment and trading volumes.
Trend Analysis
Okta, Inc. recorded a 7.58% price increase over the past year, indicating a bullish trend with accelerating momentum, despite a recent slight decline of 2.16% in the last two and a half months. Oddity Tech Ltd. exhibited a 9.16% price decrease over the same period, confirming a bearish trend with deceleration, compounded by a sharper recent drop of 21.77%. Comparing both, Okta delivered the highest market performance with sustained buyer dominance and increasing volume, unlike Oddity Tech’s weaker demand and seller dominance.
Target Prices
Analysts present a mixed but generally optimistic target consensus for both Okta, Inc. and Oddity Tech Ltd.
| Company | Target High | Target Low | Consensus |
|---|---|---|---|
| Okta, Inc. | 140 | 60 | 110.67 |
| Oddity Tech Ltd. | 80 | 40 | 66.33 |
The consensus target prices for Okta and Oddity Tech suggest upside potential compared to their current market prices of 89.55 USD and 35.40 USD, respectively, indicating moderate to strong growth expectations.
Analyst Opinions Comparison
This section compares analysts’ ratings and financial scores for Okta, Inc. and Oddity Tech Ltd.:
Rating Comparison
Okta, Inc. Rating
- Rating: B, assessed as very favorable overall
- Discounted Cash Flow Score: 4, indicating favorable value
- ROE Score: 2, moderate efficiency in generating profit
- ROA Score: 3, moderate asset utilization
- Debt To Equity Score: 4, favorable financial risk profile
- Overall Score: 3, moderate summary rating
Oddity Tech Ltd. Rating
- Rating: B+, also classified as very favorable
- Discounted Cash Flow Score: 4, showing favorable value
- ROE Score: 5, very favorable profit generation efficiency
- ROA Score: 4, favorable asset utilization
- Debt To Equity Score: 3, moderate financial risk profile
- Overall Score: 3, moderate summary rating
Which one is the best rated?
Oddity Tech Ltd. holds a slightly better rating (B+) than Okta (B), with notably higher ROE and ROA scores, indicating more efficient profit generation and asset use, despite equal overall scores.
Scores Comparison
Here is a comparison of the Altman Z-Score and Piotroski Score for each company:
Okta Scores
- Altman Z-Score: 4.15, indicating a safe zone and low bankruptcy risk.
- Piotroski Score: 8, categorized as very strong financial health.
Oddity Tech Scores
- Altman Z-Score: 3.78, also in the safe zone with low bankruptcy risk.
- Piotroski Score: 6, considered average financial strength.
Which company has the best scores?
Okta has a higher Altman Z-Score and a stronger Piotroski Score compared to Oddity Tech. This suggests Okta demonstrates better financial stability and strength based on the provided data.
Grades Comparison
The grades comparison for Okta, Inc. and Oddity Tech Ltd. based on recent analyst updates is as follows:
Okta, Inc. Grades
This table presents recent grades and rating actions from verified grading companies for Okta, Inc.:
| Grading Company | Action | New Grade | Date |
|---|---|---|---|
| Stephens & Co. | Upgrade | Overweight | 2026-01-14 |
| Piper Sandler | Maintain | Neutral | 2026-01-05 |
| RBC Capital | Maintain | Outperform | 2026-01-05 |
| Jefferies | Upgrade | Buy | 2025-12-16 |
| Needham | Maintain | Buy | 2025-12-12 |
| BTIG | Maintain | Buy | 2025-12-04 |
| Susquehanna | Maintain | Neutral | 2025-12-03 |
| Cantor Fitzgerald | Maintain | Overweight | 2025-12-03 |
| Canaccord Genuity | Maintain | Buy | 2025-12-03 |
| Scotiabank | Maintain | Sector Perform | 2025-12-03 |
Okta’s grades show a solid buy and overweight consensus with some upgrades, indicating positive analyst sentiment.
Oddity Tech Ltd. Grades
This table presents recent grades and rating actions from verified grading companies for Oddity Tech Ltd.:
| Grading Company | Action | New Grade | Date |
|---|---|---|---|
| Keybanc | Maintain | Overweight | 2026-01-08 |
| JP Morgan | Maintain | Overweight | 2025-12-12 |
| JP Morgan | Maintain | Overweight | 2025-11-21 |
| Barclays | Maintain | Equal Weight | 2025-11-21 |
| Morgan Stanley | Maintain | Equal Weight | 2025-11-21 |
| Needham | Maintain | Buy | 2025-11-20 |
| Keybanc | Maintain | Overweight | 2025-10-08 |
| JMP Securities | Maintain | Market Outperform | 2025-09-23 |
| Morgan Stanley | Maintain | Equal Weight | 2025-08-06 |
| JMP Securities | Maintain | Market Outperform | 2025-08-05 |
Oddity Tech’s ratings mostly remain stable with overweight and market outperform grades, reflecting consistent confidence from analysts.
Which company has the best grades?
Okta, Inc. has received more upgrades and a higher number of buy and overweight recommendations compared to Oddity Tech Ltd., which shows steady but less frequent upgrades. This suggests stronger analyst conviction for Okta, potentially impacting investor confidence and perceived growth prospects.
Strengths and Weaknesses
The table below summarizes the key strengths and weaknesses of Okta, Inc. (OKTA) and Oddity Tech Ltd. (ODD) based on recent financial and strategic data.
| Criterion | Okta, Inc. (OKTA) | Oddity Tech Ltd. (ODD) |
|---|---|---|
| Diversification | Low – Revenue concentrated in subscriptions (2.56B USD in 2025) with minimal technology services | Moderate – Diverse tech portfolio, but smaller scale |
| Profitability | Low – Net margin 1.07%, ROIC negative (-0.61%) indicating value destruction | High – Net margin 15.69%, ROIC 28.56%, strong value creation |
| Innovation | Moderate – Growing ROIC trend shows improving efficiency despite current losses | High – Very favorable moat and growing profitability |
| Global presence | Moderate – Established SaaS security presence globally | Emerging – Smaller but with growing competitive advantage |
| Market Share | Significant in identity management but challenged by competition | Smaller niche player with potential for growth |
Key takeaway: Oddity Tech Ltd. shows stronger profitability and a durable competitive advantage with a favorable investment profile. Okta is growing its profitability but currently destroys value, warranting cautious risk management for investors.
Risk Analysis
Below is a comparison of key risk factors for Okta, Inc. and Oddity Tech Ltd. in 2026:
| Metric | Okta, Inc. | Oddity Tech Ltd. |
|---|---|---|
| Market Risk | Moderate (Beta 0.76) | High (Beta 3.18) |
| Debt level | Low (Debt/Equity 0.15) | Very Low (Debt/Equity 0.08) |
| Regulatory Risk | Moderate (US & global data privacy laws) | Moderate (Israel & global regulations) |
| Operational Risk | Moderate (Tech infrastructure, security focus) | Moderate (Consumer tech, brand reliance) |
| Environmental Risk | Low (Software sector) | Low (Consumer tech sector) |
| Geopolitical Risk | Moderate (US-based, global exposure) | Elevated (Based in Israel, geopolitical tensions) |
Okta faces moderate market and regulatory risks but benefits from a strong balance sheet and stable operational environment. Oddity Tech has higher market volatility and geopolitical risk, partly offset by low debt and strong profitability. Investors should weigh Oddity Tech’s elevated beta and geopolitical exposure against its favorable financial strength, while Okta’s valuation appears stretched despite lower risk.
Which Stock to Choose?
Okta, Inc. shows a favorable income evolution with strong revenue and net income growth over the 2021–2025 period. Despite neutral to unfavorable profitability ratios like ROIC at -0.61% and ROE at 0.44%, it maintains favorable debt metrics and a solid rating of B with a very favorable outlook. The company is shedding value but improving its profitability trend.
Oddity Tech Ltd. demonstrates consistently favorable income statement metrics, including a high net margin of 15.69% and strong growth in revenue and net income over 2020–2024. Its financial ratios are mostly favorable, with a robust ROE of 35.95% and a very favorable moat rating, indicating durable competitive advantages. Oddity holds a B+ rating with very favorable prospects.
For investors, Oddity Tech might appear more attractive for those seeking strong profitability and competitive moat durability, while Okta could be more relevant for investors focused on improving profitability trends despite current value destruction. Risk-tolerant investors may find Okta’s growth dynamics appealing, whereas risk-averse investors might favor Oddity’s stable financial performance and value creation.
Disclaimer: Investment carries a risk of loss of initial capital. The past performance is not a reliable indicator of future results. Be sure to understand risks before making an investment decision.
Go Further
I encourage you to read the complete analyses of Okta, Inc. and Oddity Tech Ltd. to enhance your investment decisions: