Home > Comparison > Technology > NXPI vs TSEM
The strategic rivalry between NXP Semiconductors N.V. and Tower Semiconductor Ltd. defines the current trajectory of the semiconductor industry. NXP operates as a diversified technology leader with a broad product portfolio spanning automotive and IoT markets. Tower Semiconductor specializes as an independent foundry offering customizable analog and mixed-signal manufacturing solutions. This analysis evaluates which operational model offers superior risk-adjusted returns for a diversified portfolio amid evolving sector dynamics.

Table of contents
Companies Overview
In the semiconductor sector, NXP Semiconductors and Tower Semiconductor stand as influential players shaping technology markets worldwide.
NXP Semiconductors N.V.: Global Innovator in Connected Solutions
NXP Semiconductors dominates with a broad portfolio of microcontrollers and wireless connectivity solutions. Its revenue stems from supplying automotive, industrial, and IoT applications globally. In 2026, the company emphasizes expanding advanced application processors and security controllers, reinforcing its leadership in high-performance, connected devices.
Tower Semiconductor Ltd.: Specialist Foundry for Analog Mixed-Signal
Tower Semiconductor operates as a focused independent foundry, manufacturing analog-intensive mixed-signal devices for diverse markets from consumer electronics to aerospace. Its core revenue comes from customizable fabrication technologies and design enablement services. The 2026 strategy centers on enhancing wafer fabrication capabilities and supporting fabless companies with optimized development processes.
Strategic Collision: Similarities & Divergences
Both compete in semiconductors but diverge significantly: NXP builds an integrated product ecosystem, while Tower offers flexible foundry services. Their battleground lies in analog and mixed-signal technologies targeting automotive and industrial sectors. Investment profiles differ sharply—NXP commands scale and product breadth, whereas Tower focuses on niche manufacturing agility.
Income Statement Comparison
This data dissects the core profitability and scalability of both corporate engines to reveal who dominates the bottom line:

| Metric | NXP Semiconductors N.V. (NXPI) | Tower Semiconductor Ltd. (TSEM) |
|---|---|---|
| Revenue | 12.3B | 1.44B |
| Cost of Revenue | 5.59B | 1.10B |
| Operating Expenses | 3.37B | 148M |
| Gross Profit | 6.68B | 339M |
| EBITDA | 3.89B | 451M |
| EBIT | 3.06B | 185M |
| Interest Expense | 384M | 5.86M |
| Net Income | 2.02B | 208M |
| EPS | 8.00 | 1.87 |
| Fiscal Year | 2025 | 2024 |
Income Statement Analysis: The Bottom-Line Duel
This income statement comparison reveals the true efficiency and profitability of each company’s corporate engine over recent years.
NXP Semiconductors N.V. Analysis
NXP Semiconductors’ revenue peaked at $13.3B in 2023 before declining to $12.3B in 2025. Net income followed a similar trend, dropping from $2.8B to $2.0B. The company maintains strong gross margins above 54% and a net margin near 16.5%, signaling robust profitability despite recent revenue softness. Efficiency slipped slightly in 2025, reflecting margin pressures and lower earnings per share.
Tower Semiconductor Ltd. Analysis
Tower Semiconductor’s revenue grew steadily to $1.44B in 2024, with net income rising sharply to $208M, though down from $519M in 2023. Its gross margin is a modest 23.6%, and net margin stands at 14.5%. The latest year showed declining operating profit and earnings per share, indicating near-term margin compression despite solid longer-term income growth.
Margin Strength vs. Earnings Momentum
NXP delivers superior scale and margin power with a gross margin over twice that of Tower Semiconductor, underpinning its larger earnings base. Tower shows higher net income growth over the medium term but suffers recent margin setbacks. For investors prioritizing established profitability and margin resilience, NXP’s profile offers a clearer fundamental advantage over Tower’s more volatile momentum.
Financial Ratios Comparison
These vital ratios act as a diagnostic tool to expose the underlying fiscal health, valuation premiums, and capital efficiency of the companies compared below:
| Ratios | NXP Semiconductors N.V. (NXPI) | Tower Semiconductor Ltd. (TSEM) |
|---|---|---|
| ROE | 20.1% | 7.8% |
| ROIC | 11.0% | 6.4% |
| P/E | 27.1 | 27.5 |
| P/B | 5.45 | 2.16 |
| Current Ratio | 2.05 | 6.18 |
| Quick Ratio | 1.38 | 5.23 |
| D/E (Debt-to-Equity) | 1.22 | 0.07 |
| Debt-to-Assets | 46.0% | 5.9% |
| Interest Coverage | 8.62 | 32.6 |
| Asset Turnover | 0.46 | 0.47 |
| Fixed Asset Turnover | 4.12 | 1.11 |
| Payout ratio | 50.7% | 0% |
| Dividend yield | 1.87% | 0% |
| Fiscal Year | 2025 | 2024 |
Efficiency & Valuation Duel: The Vital Signs
Financial ratios act as a company’s DNA, revealing hidden risks and operational excellence essential for informed investment decisions.
NXP Semiconductors N.V.
NXP Semiconductors delivers strong profitability with a 20.1% ROE and 16.47% net margin, signaling robust operational efficiency. Its valuation appears stretched, with a P/E of 27.14 and P/B of 5.45, above sector norms. The company rewards shareholders with a 1.87% dividend yield, balancing payouts with substantial R&D investment.
Tower Semiconductor Ltd.
Tower Semiconductor posts a modest 7.83% ROE and a 14.47% net margin, indicating moderate profitability but operational challenges. Its P/E ratio of 27.54 suggests it is equally pricey. The firm carries minimal debt and boasts a strong current ratio of 6.18 but offers no dividend, focusing reinvestment on growth and capital expenditure.
Premium Valuation vs. Operational Safety
NXP Semiconductors combines higher profitability with a dividend, though at a premium valuation and moderate debt. Tower Semiconductor offers stronger liquidity and lower leverage but lower returns and no dividend. Investors seeking income and efficiency may favor NXP, while those prioritizing balance sheet safety might lean toward Tower.
Which one offers the Superior Shareholder Reward?
I observe NXP Semiconductors N.V. (NXPI) delivers a balanced distribution with a 1.9% dividend yield and a 41% payout ratio, backed by strong free cash flow coverage (~74%-86%). NXPI also pursues moderate buybacks, sustaining shareholder returns while funding growth. Tower Semiconductor Ltd. (TSEM) pays no dividends, focusing on reinvestment and acquisitions, but its minuscule free cash flow relative to operating cash flow (~3%) limits buyback potential. TSEM’s buybacks are modest, reflecting cautious capital allocation. Historically, NXPI’s dividend and buyback blend offers more reliable, sustainable returns aligned with industry benchmarks. I judge NXPI superior for total shareholder reward in 2026.
Comparative Score Analysis: The Strategic Profile
The radar chart reveals the fundamental DNA and trade-offs of NXP Semiconductors N.V. and Tower Semiconductor Ltd., highlighting their distinct financial strengths and weaknesses:

NXP excels in profitability metrics, with higher ROE (4) and ROA (4) scores, but carries significant financial risk, reflected by a very unfavorable debt-to-equity score (1). Tower Semiconductor shows a more balanced financial risk profile (debt-to-equity score 4) but trails in valuation metrics and discounted cash flow. Tower’s strength lies in a stable balance sheet, while NXP leverages profitability but at higher leverage risk.
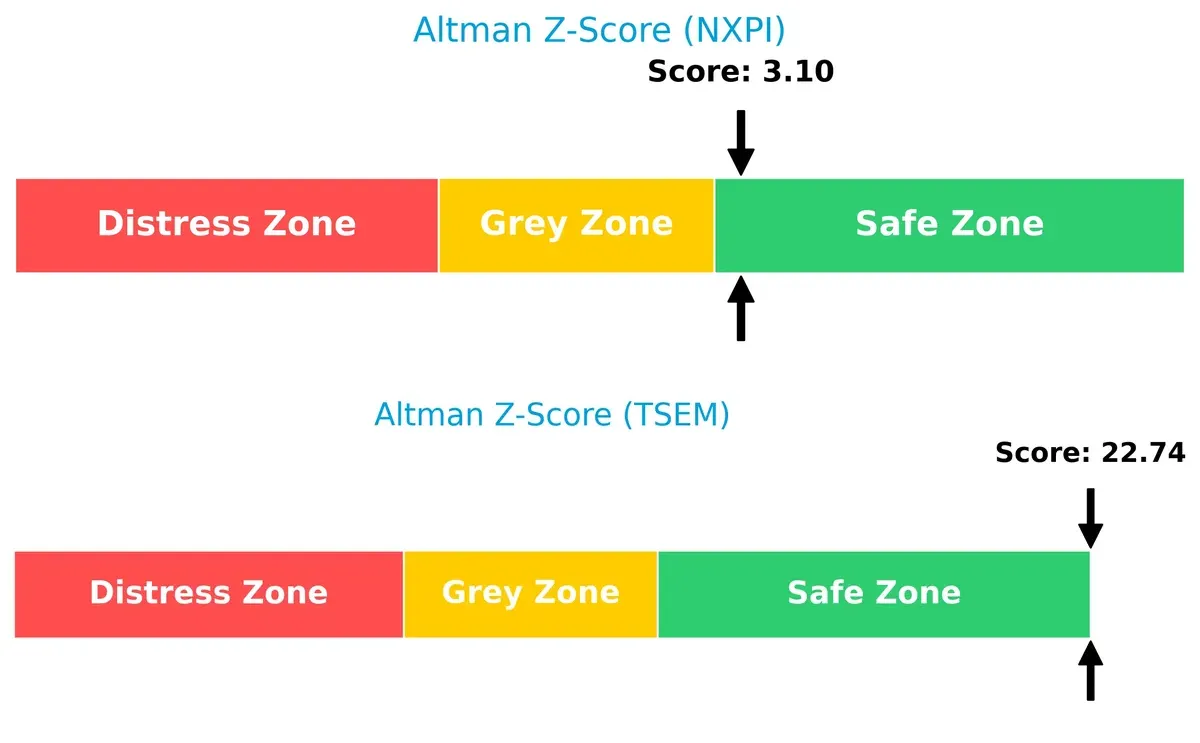
Bankruptcy Risk: Solvency Showdown
Tower Semiconductor’s Altman Z-Score (22.7) far outpaces NXP’s (3.1), both in the safe zone, signaling Tower’s superior long-term solvency and lower bankruptcy risk in this cycle:
Financial Health: Quality of Operations
Tower Semiconductor’s Piotroski F-Score of 7 indicates robust operational health, outperforming NXP’s average score of 5. This suggests Tower manages internal financial metrics more effectively, with fewer red flags in profitability, efficiency, and liquidity:

How are the two companies positioned?
This section dissects NXPI and TSEM’s operational DNA by comparing their revenue distribution and internal dynamics. The goal is to confront their economic moats and reveal which model offers the most resilient competitive advantage today.
Revenue Segmentation: The Strategic Mix
This comparison dissects how NXP Semiconductors N.V. and Tower Semiconductor Ltd. diversify income streams and where their primary sector bets lie:
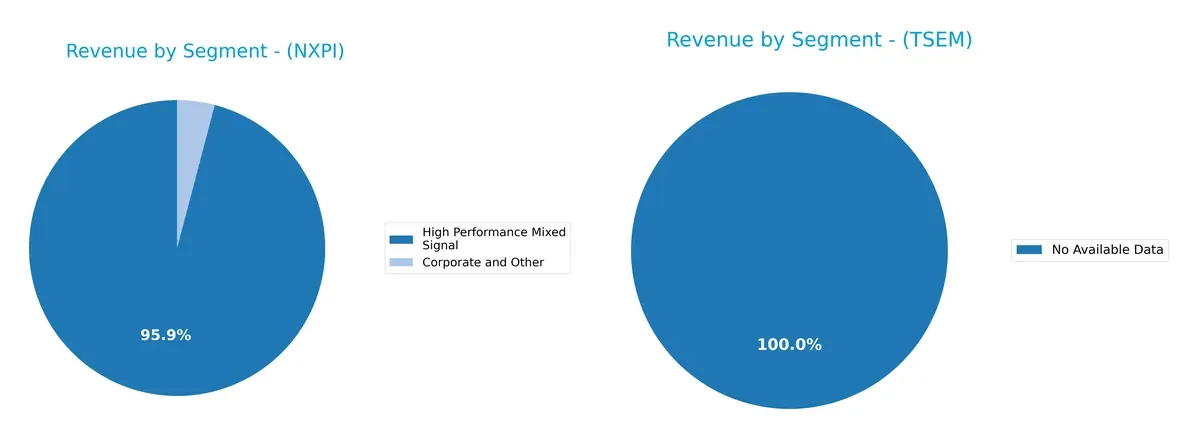
NXP Semiconductors anchors revenue in High Performance Mixed Signal, generating $9B in 2018, dwarfing Corporate and Other at $385M. This signals strong specialization with limited diversification. Tower Semiconductor lacks available segmentation data, preventing direct comparison. NXP’s focus on high-performance chips suggests ecosystem lock-in but exposes it to concentration risk if that segment slows. Investors must weigh robust dominance against potential volatility from segment reliance.
Strengths and Weaknesses Comparison
This table compares the strengths and weaknesses of NXP Semiconductors N.V. and Tower Semiconductor Ltd.:
NXP Semiconductors N.V. Strengths
- High net margin at 16.47%
- Strong ROE at 20.1%
- Favorable ROIC above WACC
- Robust current and quick ratios
- Significant global presence with diversified revenue across Asia, Europe, and Americas
- High fixed asset turnover
Tower Semiconductor Ltd. Strengths
- Favorable net margin at 14.47%
- Very low debt-to-equity and debt-to-assets ratios
- Strong interest coverage at 31.57
- Favorable quick ratio
- WACC below ROIC indicating efficient capital costs
- Lower P/B ratio suggests potential undervaluation
NXP Semiconductors N.V. Weaknesses
- Unfavorable high P/E and P/B ratios signal expensive valuation
- Debt-to-equity ratio above 1 indicates higher leverage
- Asset turnover below 0.5 suggests less efficient asset use
- Dividend yield is only neutral
- Moderate debt to assets ratio
Tower Semiconductor Ltd. Weaknesses
- Lower ROE at 7.83% reflects weaker profitability
- Unfavorable P/E ratio signals expensive stock
- Very high current ratio over 6 may indicate inefficient asset management
- No dividend yield reduces income potential
- Asset turnover slightly unfavorable
- Neutral fixed asset turnover
Both companies show slightly favorable financial health but highlight different strategic challenges. NXP leverages global diversification and profitability with higher leverage risk, while Tower emphasizes conservative debt management but faces profitability and valuation concerns. These contrasts shape their capital allocation and growth strategies going forward.
The Moat Duel: Analyzing Competitive Defensibility
A structural moat protects long-term profits from relentless competition erosion. Without it, market share and margins erode swiftly:
NXP Semiconductors N.V.: Diversified Product Portfolio Moat
NXP’s competitive edge lies in its broad semiconductor mix and analog expertise, sustaining high 25% EBIT margins. However, declining ROIC signals margin pressure in 2026 from intensifying competition.
Tower Semiconductor Ltd.: Niche Foundry Specialization Moat
Tower leverages specialized analog and mixed-signal foundry services, contrasting NXP’s scale with focused customization. Its rising ROIC trend hints at strengthening profitability and growth potential amid semiconductor demand shifts.
Scale and Specialization: Who Defends Market Share Better?
NXP boasts a wider moat through scale and product diversity, yet its profitability weakens. Tower’s deeper moat emerges from rising ROIC and specialization, positioning it better to defend niche market share.
Which stock offers better returns?
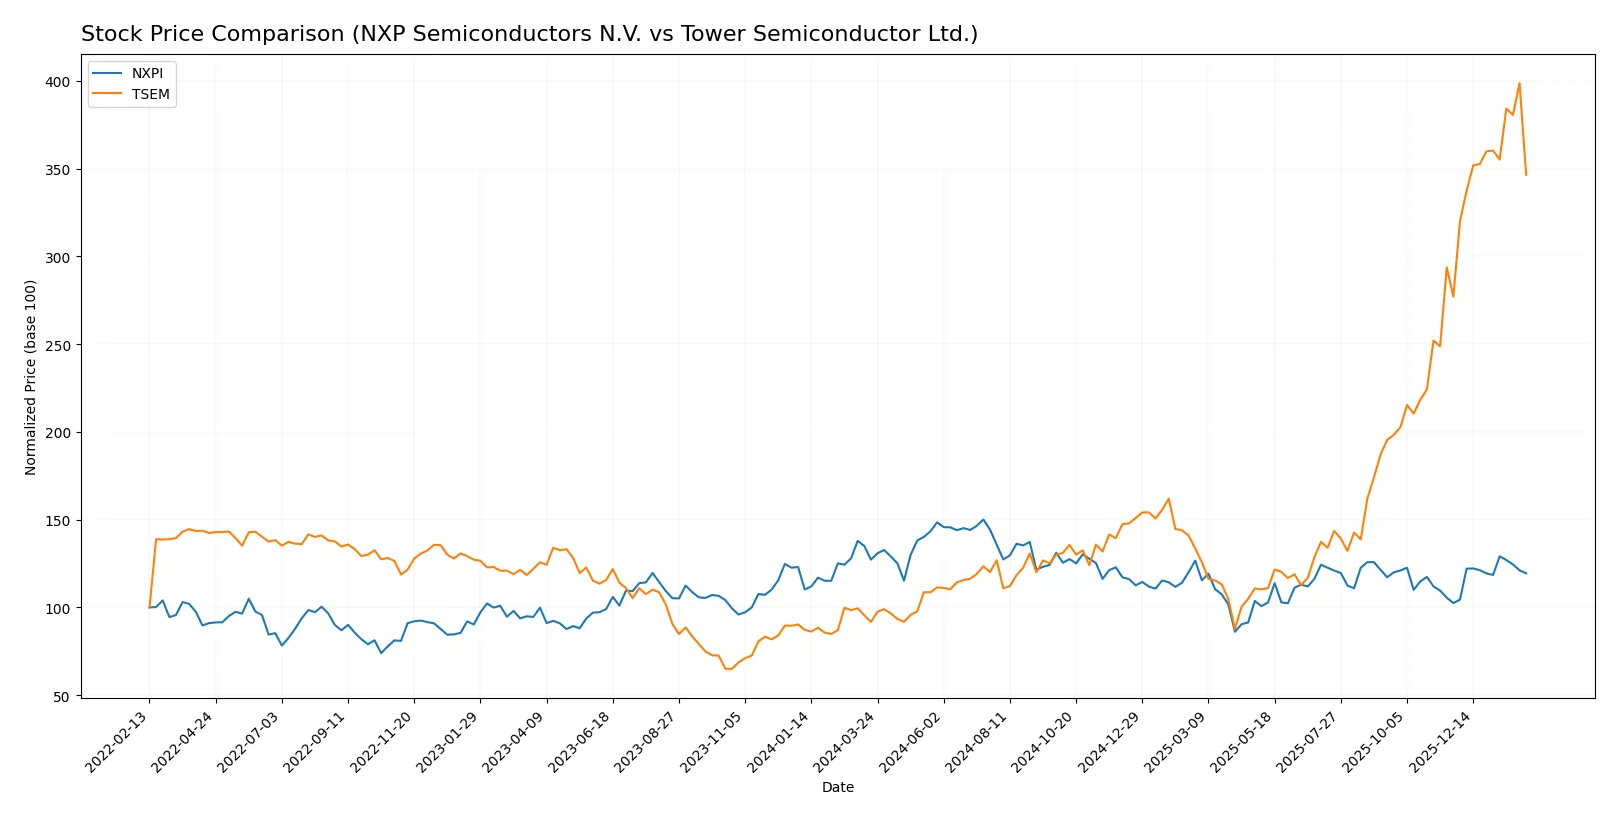
The past year reveals sharp contrasts: NXP Semiconductors shows a broad bearish trend with recent recovery, while Tower Semiconductor exhibits strong, accelerating gains throughout the period.
Trend Comparison
NXP Semiconductors experienced a 6.11% price decline over the past year, signaling a bearish trend with accelerating downward momentum and a wide price range between 161 and 280.
Tower Semiconductor delivered a robust 277.95% price increase over the same period, marking a bullish trend with acceleration and a notable rise from 30 to 135.
Tower Semiconductor clearly outperformed NXP Semiconductors, delivering substantially higher returns and sustained upward momentum over the last twelve months.
Target Prices
Analysts present a balanced target price consensus for both NXP Semiconductors N.V. and Tower Semiconductor Ltd., reflecting cautious optimism.
| Company | Target Low | Target High | Consensus |
|---|---|---|---|
| NXP Semiconductors N.V. | 215 | 280 | 250 |
| Tower Semiconductor Ltd. | 66 | 125 | 96 |
The consensus targets imply upside potential of roughly 13% for NXP from its current 222, and a slight downside for Tower Semiconductor versus its current 118 price. Analysts expect moderate growth with some valuation risk.

Don’t Let Luck Decide Your Entry Point
Optimize your entry points with our advanced ProRealTime indicators. You’ll get efficient buy signals with precise price targets for maximum performance. Start outperforming now!
How do institutions grade them?
Here is a comparison of institutional analyst grades for NXP Semiconductors N.V. and Tower Semiconductor Ltd.:
NXP Semiconductors N.V. Grades
The following table summarizes recent grades from reputable grading firms for NXP Semiconductors N.V.:
| Grading Company | Action | New Grade | Date |
|---|---|---|---|
| Evercore ISI Group | Maintain | Outperform | 2026-02-04 |
| B of A Securities | Maintain | Buy | 2026-02-04 |
| Truist Securities | Maintain | Buy | 2026-02-04 |
| Mizuho | Maintain | Outperform | 2026-02-04 |
| Citigroup | Maintain | Buy | 2026-02-04 |
| JP Morgan | Maintain | Neutral | 2026-02-04 |
| Needham | Maintain | Buy | 2026-02-03 |
| Citigroup | Maintain | Buy | 2026-01-15 |
| Wells Fargo | Maintain | Overweight | 2026-01-15 |
| Truist Securities | Maintain | Buy | 2025-12-19 |
Tower Semiconductor Ltd. Grades
Below is a table of recent institutional grades for Tower Semiconductor Ltd.:
| Grading Company | Action | New Grade | Date |
|---|---|---|---|
| Benchmark | Maintain | Buy | 2026-01-09 |
| Wedbush | Downgrade | Neutral | 2025-12-31 |
| Benchmark | Maintain | Buy | 2025-11-11 |
| Susquehanna | Maintain | Positive | 2025-11-11 |
| Wedbush | Maintain | Outperform | 2025-11-11 |
| Barclays | Maintain | Equal Weight | 2025-11-11 |
| Benchmark | Maintain | Buy | 2025-09-08 |
| Susquehanna | Maintain | Positive | 2025-08-05 |
| Benchmark | Maintain | Buy | 2025-08-05 |
| Benchmark | Maintain | Buy | 2025-08-04 |
Which company has the best grades?
NXP Semiconductors N.V. consistently receives Buy and Outperform ratings from multiple top-tier firms. Tower Semiconductor Ltd. shows mixed ratings with recent downgrades. Investors may view NXP’s stronger consensus grades as a sign of greater analyst confidence.
Risks specific to each company
The following categories identify the critical pressure points and systemic threats facing both firms in the 2026 market environment:
1. Market & Competition
NXP Semiconductors N.V.
- Operates globally with diversified product portfolio in automotive, industrial, and IoT sectors, facing intense competition from large semiconductor firms.
Tower Semiconductor Ltd.
- Focuses on analog and mixed-signal foundry services, competing with larger foundries but benefits from niche customization capabilities.
2. Capital Structure & Debt
NXP Semiconductors N.V.
- Debt-to-equity ratio at 1.22 signals higher leverage, raising financial risk despite favorable interest coverage of 7.97.
Tower Semiconductor Ltd.
- Extremely low debt-to-equity of 0.07 and debt-to-assets at 5.87% reflect a conservative capital structure with minimal financial risk.
3. Stock Volatility
NXP Semiconductors N.V.
- Beta of 1.458 indicates above-market volatility, exposing investors to higher systematic risk.
Tower Semiconductor Ltd.
- Beta of 0.891 shows relatively lower volatility and less sensitivity to market swings.
4. Regulatory & Legal
NXP Semiconductors N.V.
- Operates across multiple jurisdictions including China and the US, facing complex regulatory compliance and geopolitical trade tensions.
Tower Semiconductor Ltd.
- Also exposed internationally but less diversified; regulatory risks may concentrate in Israel and key customer regions.
5. Supply Chain & Operations
NXP Semiconductors N.V.
- Large global footprint implies complex supply chain vulnerable to disruptions but benefits from scale and integration.
Tower Semiconductor Ltd.
- Smaller scale and niche processes could limit disruption but also constrain operational flexibility.
6. ESG & Climate Transition
NXP Semiconductors N.V.
- Increasing investor focus on ESG; large multinational footprint demands aggressive climate transition strategies.
Tower Semiconductor Ltd.
- Emerging ESG programs; smaller scale may ease transition but less influence on industry standards.
7. Geopolitical Exposure
NXP Semiconductors N.V.
- Significant exposure to China-US tensions; supply chain and sales could be disrupted by geopolitical conflicts.
Tower Semiconductor Ltd.
- Israeli base and global customers expose it to Middle East regional risks and global trade uncertainties.
Which company shows a better risk-adjusted profile?
Tower Semiconductor’s conservative capital structure and lower stock volatility underpin a stronger risk-adjusted profile. NXP’s leverage and geopolitical exposure present higher risks despite its larger scale and diversified markets. Tower’s Altman Z-score and Piotroski Score also indicate superior financial health. Recent sharp share price decline of 13.8% at Tower signals near-term market concerns but does not overshadow its financial prudence. Conversely, NXP’s debt-to-equity ratio above 1 flags caution amid competitive and regulatory pressures.
Final Verdict: Which stock to choose?
NXP Semiconductors N.V. (NXPI) shines with its operational excellence and strong return on equity, demonstrating a powerful ability to generate profits efficiently. Its main point of vigilance lies in a slightly declining profitability trend and elevated debt levels. NXPI suits portfolios seeking aggressive growth with some tolerance for risk.
Tower Semiconductor Ltd. (TSEM) offers a strategic moat rooted in its improving profitability and exceptionally strong balance sheet, highlighted by low debt and high liquidity. While its returns are more modest than NXPI’s, TSEM provides better financial stability, fitting well within GARP (Growth at a Reasonable Price) strategies focused on steady growth and risk control.
If you prioritize operational strength and higher profit generation, NXPI is the compelling choice due to its efficiency and growth potential despite some financial risks. However, if you seek better financial safety and improving profitability with less volatility, TSEM offers superior stability and a growing economic moat, making it attractive for conservative growth investors.
Disclaimer: Investment carries a risk of loss of initial capital. The past performance is not a reliable indicator of future results. Be sure to understand risks before making an investment decision.
Go Further
I encourage you to read the complete analyses of NXP Semiconductors N.V. and Tower Semiconductor Ltd. to enhance your investment decisions: