Home > Comparison > Technology > NXPI vs TER
The strategic rivalry between NXP Semiconductors N.V. and Teradyne, Inc. shapes the semiconductor industry’s evolution. NXP operates as a broad-spectrum semiconductor innovator, delivering microcontrollers and connectivity solutions. Teradyne focuses on specialized test equipment and industrial automation, targeting manufacturing precision. This analysis contrasts their distinct operational models to reveal which company offers a superior risk-adjusted return for a diversified portfolio amid technological and market shifts.
Table of contents
Companies Overview
NXP Semiconductors and Teradyne stand as pivotal players reshaping the semiconductor and testing landscapes globally.
NXP Semiconductors N.V.: Global Semiconductor Innovator
NXP Semiconductors dominates the semiconductor market with a broad product portfolio including microcontrollers, application processors, and wireless connectivity solutions. Its core revenue stems from supplying advanced chips for automotive, industrial IoT, and communication infrastructure. In 2026, NXP focuses strategically on expanding secure connectivity and sensor integration across diverse industries.
Teradyne, Inc.: Leading Automated Test Equipment Provider
Teradyne specializes in automatic test equipment, supporting semiconductor manufacturers with wafer and device package testing. Its revenue relies heavily on the Semiconductor Test segment, complemented by System Test and Industrial Automation. Teradyne’s 2026 strategy centers on advancing collaborative robotics and wireless test technologies, targeting efficiency gains in manufacturing and IoT device validation.
Strategic Collision: Similarities & Divergences
NXP pursues a broad semiconductor product approach, while Teradyne targets niche test automation and robotics. They compete indirectly but share the battleground of semiconductor quality and innovation. NXP’s scale and product diversity contrast with Teradyne’s specialized equipment focus, creating distinct investment profiles—one driven by chip innovation, the other by manufacturing precision.
Income Statement Comparison
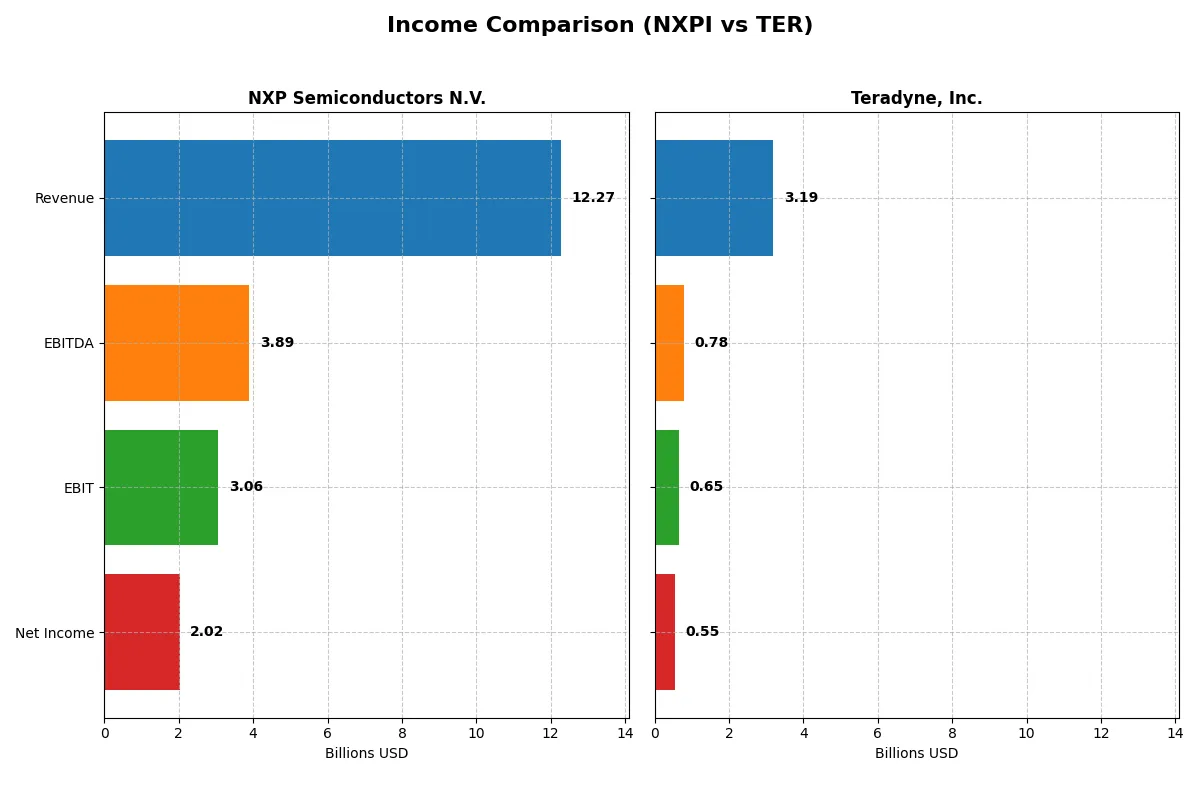
This data dissects the core profitability and scalability of both corporate engines to reveal who dominates the bottom line:
| Metric | NXP Semiconductors N.V. (NXPI) | Teradyne, Inc. (TER) |
|---|---|---|
| Revenue | 12.27B | 3.19B |
| Cost of Revenue | 5.59B | 1.32B |
| Operating Expenses | 3.37B | 1.17B |
| Gross Profit | 6.68B | 1.87B |
| EBITDA | 3.89B | 780M |
| EBIT | 3.06B | 653M |
| Interest Expense | 384M | 8M |
| Net Income | 2.02B | 554M |
| EPS | 8.00 | 3.49 |
| Fiscal Year | 2025 | 2025 |
Income Statement Analysis: The Bottom-Line Duel
This income statement comparison reveals which company leverages its revenue into stronger profitability and operational efficiency.
NXP Semiconductors N.V. Analysis
NXP Semiconductors’ revenue declined 2.7% in 2025 to $12.3B, with net income falling 19.7% to $2.0B. The company sustains healthy margins, boasting a gross margin of 54.4% and net margin of 16.5%. Despite recent margin pressure, NXP maintains solid EBIT and EPS growth over five years, signaling resilient operational momentum.
Teradyne, Inc. Analysis
Teradyne’s revenue jumped 13.1% to $3.2B in 2025, with net income rising 2.2% to $554M. It delivers stronger margins than NXP, with a 58.6% gross margin and 17.4% net margin. However, Teradyne’s long-term revenue and net income trends are negative, reflecting recent recovery rather than sustained growth.
Margin Strength vs. Growth Momentum
NXP dominates in scale and long-term earnings growth but faces near-term margin headwinds and revenue contraction. Teradyne impresses with higher profitability ratios and recent revenue acceleration, yet struggles with overall shrinking earnings. Investors favor NXP’s robust earnings base and growth resilience over Teradyne’s cyclical rebound profile.
Financial Ratios Comparison
These vital ratios act as a diagnostic tool to expose the underlying fiscal health, valuation premiums, and capital efficiency of the companies analyzed:
| Ratios | NXP Semiconductors N.V. (NXPI) | Teradyne, Inc. (TER) |
|---|---|---|
| ROE | 20.1% | 19.8% |
| ROIC | 11.0% | 18.4% |
| P/E | 27.1 | 54.6 |
| P/B | 5.45 | 10.83 |
| Current Ratio | 2.05 | 1.76 |
| Quick Ratio | 1.38 | 1.41 |
| D/E (Debt to Equity) | 1.22 | 0.12 |
| Debt-to-Assets | 46.0% | 8.3% |
| Interest Coverage | 8.62 | 86.44 |
| Asset Turnover | 0.46 | 0.76 |
| Fixed Asset Turnover | 4.12 | 4.99 |
| Payout Ratio | 50.7% | 13.8% |
| Dividend Yield | 1.87% | 0.25% |
| Fiscal Year | 2025 | 2025 |
Efficiency & Valuation Duel: The Vital Signs
Financial ratios serve as a company’s DNA, uncovering hidden risks and operational strengths that shape investment decisions.
NXP Semiconductors N.V.
NXP displays strong profitability with a 20.1% ROE and favorable net margin at 16.47%. Valuation appears stretched, reflected in a high P/E of 27.14 and P/B at 5.45. The company balances shareholder returns via a 1.87% dividend yield, supported by solid reinvestment into R&D for future growth.
Teradyne, Inc.
Teradyne delivers robust profitability, with a 19.82% ROE and a superior 18.45% ROIC. However, valuation looks expensive, with a P/E of 54.64 and a high P/B of 10.83. Its low dividend yield of 0.25% suggests a focus on capital preservation and growth investments, reinforced by strong balance sheet metrics.
Premium Valuation vs. Operational Safety
Teradyne offers higher operational efficiency and a stronger balance sheet but at a significantly higher valuation multiple. NXP combines solid profitability with a more balanced payout and reinvestment strategy. Risk-averse investors may prefer NXP’s steadier profile, while growth-focused investors might tolerate Teradyne’s premium.
Which one offers the Superior Shareholder Reward?
I compare NXP Semiconductors (NXPI) and Teradyne (TER) based on dividends, payout ratios, and buybacks. NXPI yields ~1.9% with a 41–51% payout, supported by strong free cash flow (~$8–10/share). TER pays a modest 0.25–0.5% yield with a low payout (~7–15%), retaining most earnings for growth. NXPI’s dividend is well-covered, reflecting disciplined capital allocation, while TER prioritizes reinvestment and moderate buybacks. TER’s lower leverage and high operating margins support sustainable buybacks but yield light immediate income. I see NXPI offering superior total shareholder returns in 2026 due to balanced income and buybacks, whereas TER suits growth-focused investors willing to forgo dividends.
Comparative Score Analysis: The Strategic Profile
The radar chart reveals the fundamental DNA and trade-offs of NXP Semiconductors and Teradyne, highlighting their financial strengths and valuation nuances:
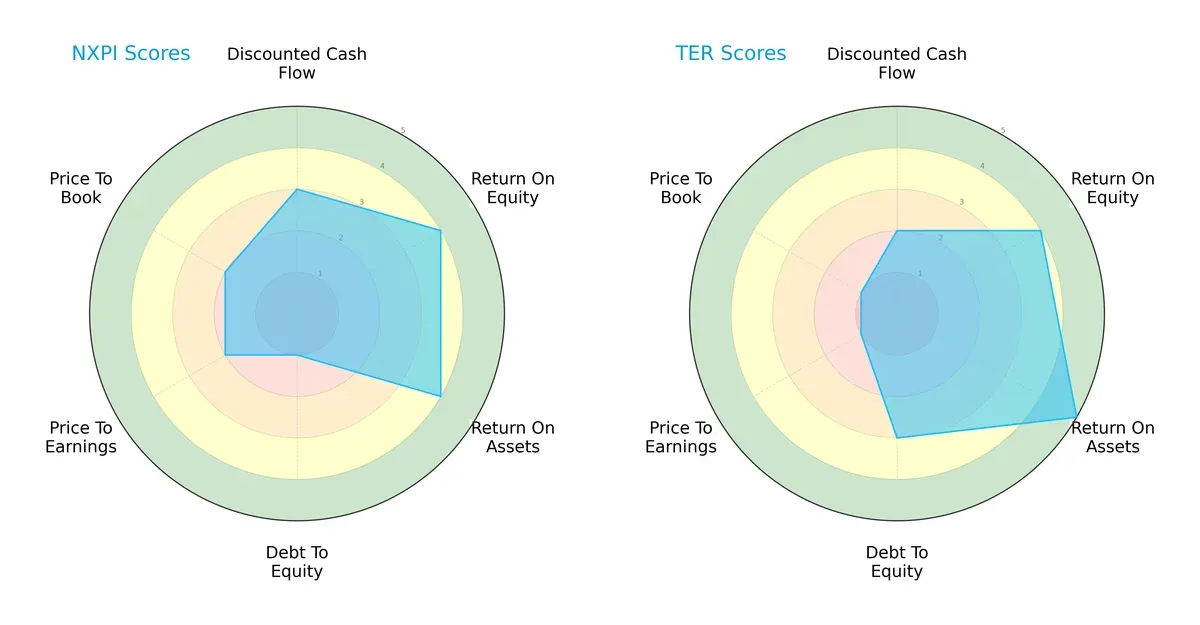
NXP Semiconductors scores higher on discounted cash flow and valuation metrics but struggles with debt, indicated by a very unfavorable debt-to-equity score. Teradyne excels in asset efficiency and maintains a more balanced debt profile, though it appears undervalued with weak P/E and P/B scores. Teradyne’s profile is more balanced, while NXP relies heavily on cash flow and profitability metrics.
Bankruptcy Risk: Solvency Showdown
Teradyne’s Altman Z-Score far exceeds NXP’s, implying a stronger buffer against bankruptcy risk in this cycle:
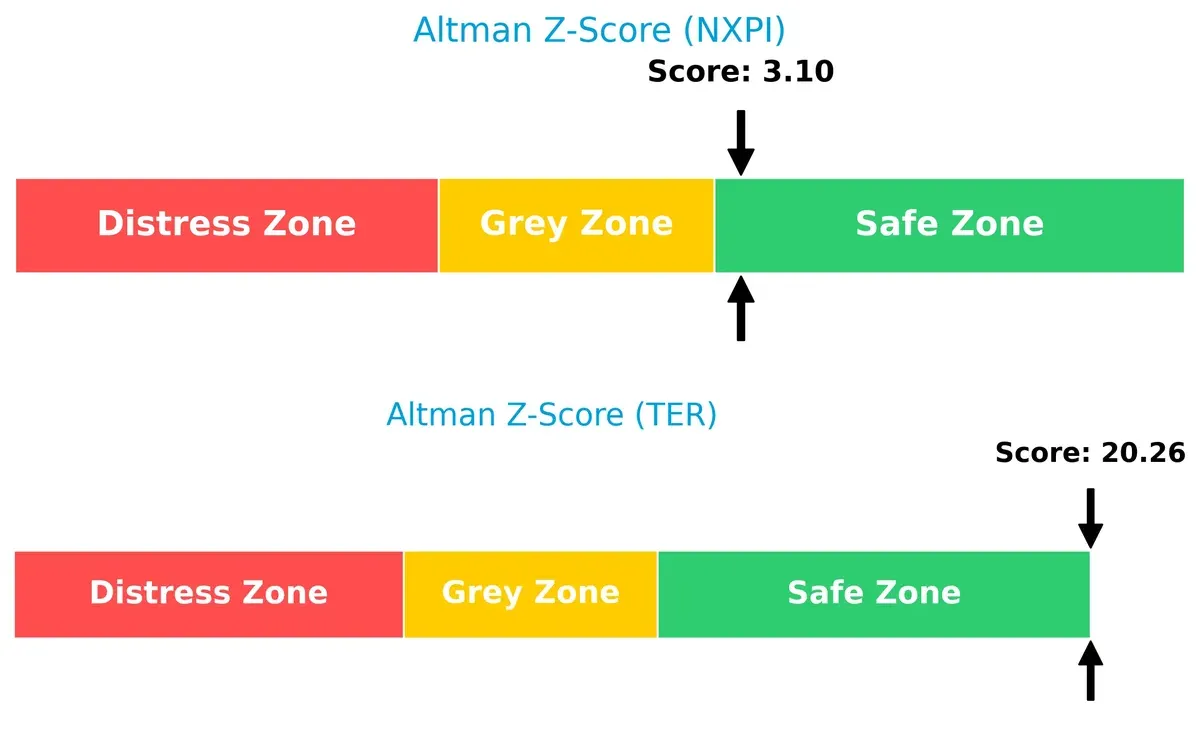
Teradyne’s score of 20.3 places it deep in the safe zone, signaling robust financial stability. NXP’s score of 3.1, while still safe, suggests a thinner margin of safety and higher vulnerability under stress.
Financial Health: Quality of Operations
Teradyne’s Piotroski F-Score edges out NXP by one point, reflecting slightly stronger operational quality and fewer red flags:
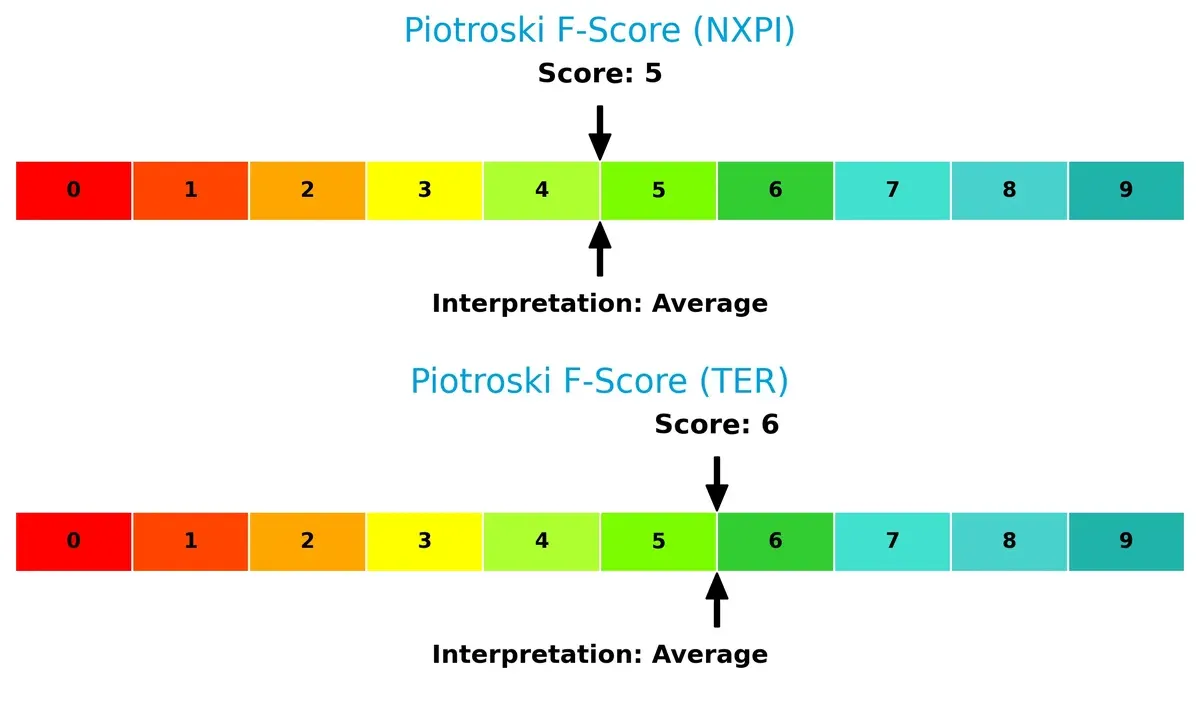
Both firms score in the average range, but Teradyne’s 6 versus NXP’s 5 indicates a modestly healthier internal financial position, offering investors a marginally stronger quality of earnings and balance sheet.
How are the two companies positioned?
This section dissects NXPI and TER’s operational DNA by comparing revenue distribution and internal dynamics—strengths and weaknesses. The goal is to confront their economic moats to identify which model delivers a more resilient, sustainable competitive advantage today.
Revenue Segmentation: The Strategic Mix
This visual comparison dissects how NXP Semiconductors N.V. and Teradyne, Inc. diversify their income streams and where their primary sector bets lie:
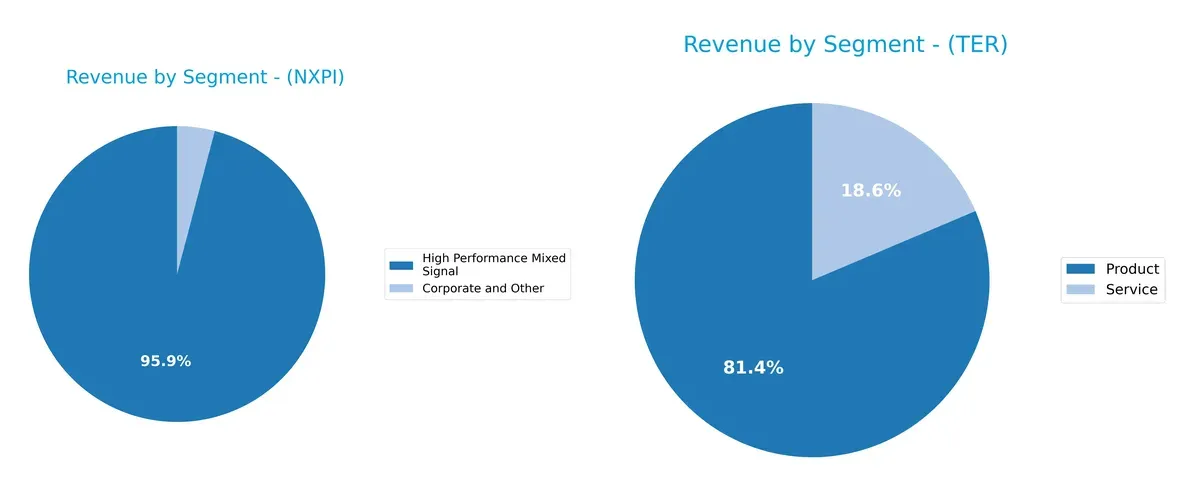
NXP Semiconductors anchors its revenue heavily in High Performance Mixed Signal, generating $9B in 2018, dwarfing its Corporate and Other segment at $385M. This signals strong specialization but concentration risk. Teradyne shows a more balanced mix with $2.3B in Product and $525M in Service revenue in 2024, reflecting a strategic pivot towards diversified offerings and ecosystem lock-in in automation and testing.
Strengths and Weaknesses Comparison
This table compares the strengths and weaknesses of NXP Semiconductors N.V. and Teradyne, Inc.:
NXP Semiconductors N.V. Strengths
- Strong profitability with 16.47% net margin
- High ROE at 20.1%
- Solid liquidity ratios above 1.3
- Diversified revenue from High Performance Mixed Signal products
- Global presence with significant sales in China and US
- Favorable fixed asset turnover at 4.12
Teradyne, Inc. Strengths
- Higher profitability with 17.37% net margin
- ROIC significantly above WACC at 18.45%
- Low debt-to-equity ratio at 0.12
- Strong interest coverage at 81.43
- Diverse product and service revenue streams
- Global sales spread including Taiwan and Korea
NXP Semiconductors N.V. Weaknesses
- Elevated debt-to-equity ratio at 1.22
- Unfavorable asset turnover at 0.46
- High price-to-book at 5.45
- Moderate debt-to-assets at 46%
- PE ratio above 27, indicating high valuation
- Limited product diversification beyond mixed signals
Teradyne, Inc. Weaknesses
- High WACC at 12.35%, reducing capital efficiency
- Elevated PE and PB ratios, signaling expensive valuation
- Low dividend yield at 0.25%
- Neutral asset turnover at 0.76
- Concentrated regional revenue, less exposure in key markets
Both companies exhibit strong profitability and global reach but face valuation and capital structure concerns. NXP’s higher leverage contrasts with Teradyne’s conservative debt use, influencing their financial flexibility and risk profiles.
The Moat Duel: Analyzing Competitive Defensibility
A structural moat is the only thing protecting long-term profits from erosion by competition. Let’s dissect how these firms defend their turf:
NXP Semiconductors N.V.: Intangible Assets and Industry Integration
NXP leverages strong intangible assets and broad application diversity, reflected in solid 25% EBIT margins and 54% gross margins. However, its declining ROIC highlights rising competitive pressures in 2026.
Teradyne, Inc.: Cost Advantage and Specialized Automation
Teradyne’s moat centers on cost-efficient automation solutions and specialized test equipment. It posts a robust 59% gross margin and creates value with ROIC well above WACC, despite a recent profitability dip.
Verdict: Intangible Assets vs. Cost Leadership
NXP’s intangible asset moat is broad but currently weaker due to declining returns. Teradyne’s cost advantage delivers a deeper moat with higher economic value creation. I see Teradyne better equipped to defend its market share in 2026.
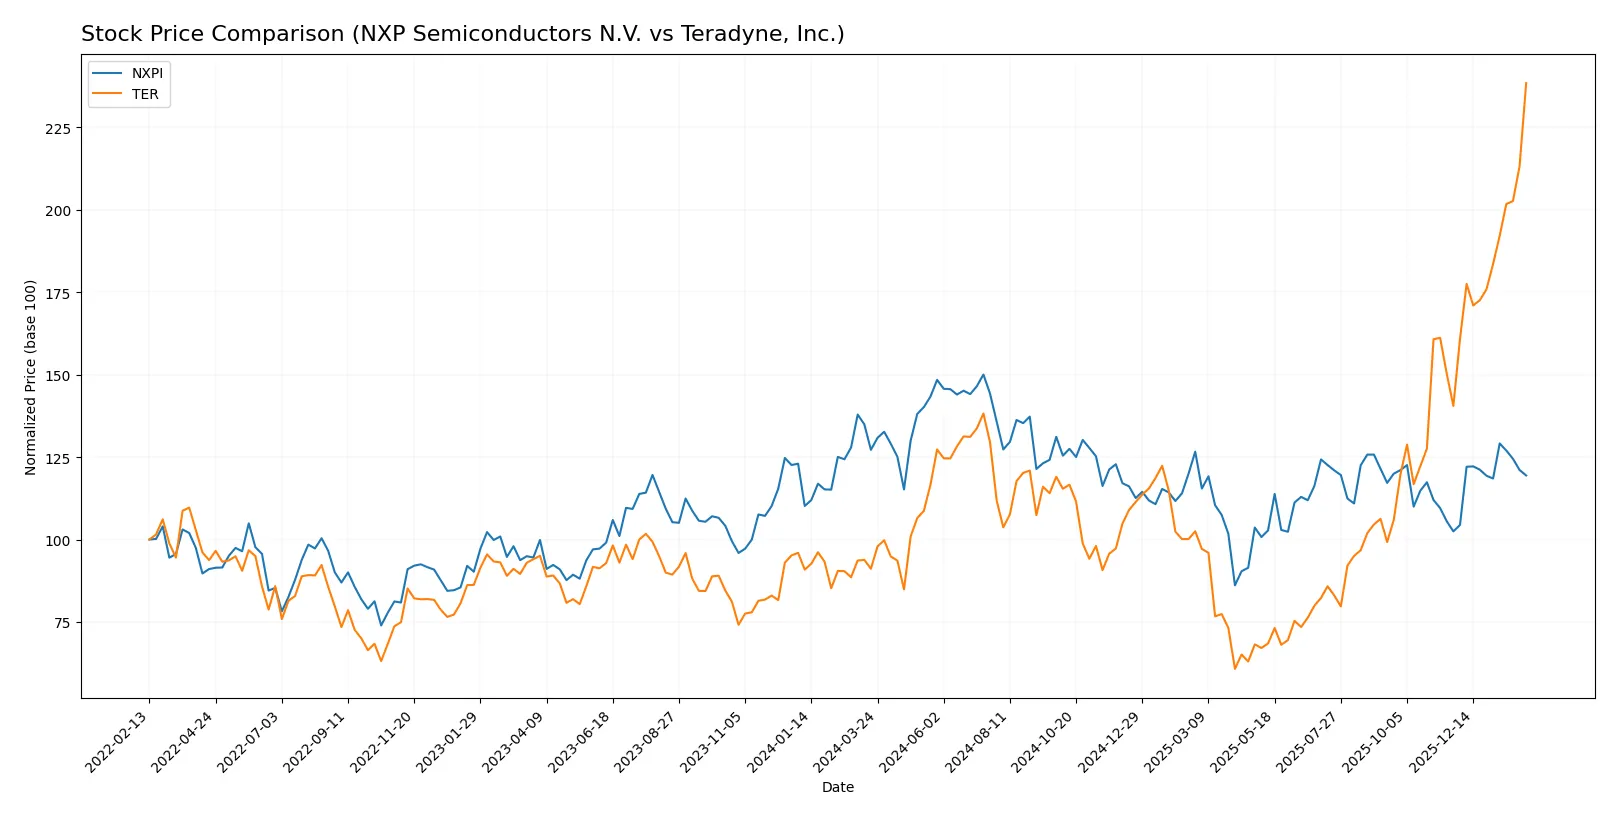
Which stock offers better returns?
The past year reveals starkly different price trajectories. NXP Semiconductors shows a bearish trend with accelerating decline, while Teradyne exhibits robust bullish momentum and strong buyer dominance since late 2025.
Trend Comparison
NXP Semiconductors (NXPI) declined 6.11% over the past year, marking a bearish trend with accelerating downward momentum. The stock ranged between 160.81 and 280.19, showing moderate volatility at 24.1 std deviation.
Teradyne (TER) surged 161.61% over the same period, demonstrating a bullish trend with accelerating gains. Its price fluctuated from 68.72 to 269.61, reflecting higher volatility at 39.22 std deviation.
Teradyne clearly outperformed NXP Semiconductors, delivering superior market returns with stronger upward price momentum and buyer dominance in recent months.
Target Prices
Analysts present a solid target price consensus for NXP Semiconductors N.V. and Teradyne, Inc.
| Company | Target Low | Target High | Consensus |
|---|---|---|---|
| NXP Semiconductors N.V. | 215 | 280 | 250 |
| Teradyne, Inc. | 175 | 335 | 276.08 |
Both companies show bullish analyst expectations. NXP’s consensus target of 250 sits about 12% above its current 223 price. Teradyne’s 276 consensus is slightly above its current 270 price, indicating moderate upside potential.

Don’t Let Luck Decide Your Entry Point
Optimize your entry points with our advanced ProRealTime indicators. You’ll get efficient buy signals with precise price targets for maximum performance. Start outperforming now!
How do institutions grade them?
Here are the latest institutional grades for NXP Semiconductors N.V. and Teradyne, Inc.:
NXP Semiconductors N.V. Grades
The table below shows recent grades from recognized investment firms for NXP Semiconductors N.V.:
| Grading Company | Action | New Grade | Date |
|---|---|---|---|
| Evercore ISI Group | Maintain | Outperform | 2026-02-04 |
| B of A Securities | Maintain | Buy | 2026-02-04 |
| Truist Securities | Maintain | Buy | 2026-02-04 |
| Mizuho | Maintain | Outperform | 2026-02-04 |
| Citigroup | Maintain | Buy | 2026-02-04 |
| JP Morgan | Maintain | Neutral | 2026-02-04 |
| Needham | Maintain | Buy | 2026-02-03 |
| Citigroup | Maintain | Buy | 2026-01-15 |
| Wells Fargo | Maintain | Overweight | 2026-01-15 |
| Truist Securities | Maintain | Buy | 2025-12-19 |
Teradyne, Inc. Grades
Below is the recent grading summary from major institutions for Teradyne, Inc.:
| Grading Company | Action | New Grade | Date |
|---|---|---|---|
| Evercore ISI Group | Maintain | Outperform | 2026-02-04 |
| Cantor Fitzgerald | Maintain | Overweight | 2026-02-04 |
| Stifel | Maintain | Buy | 2026-02-04 |
| Evercore ISI Group | Maintain | Outperform | 2026-02-03 |
| Cantor Fitzgerald | Maintain | Overweight | 2026-02-02 |
| Stifel | Maintain | Buy | 2026-01-30 |
| UBS | Maintain | Buy | 2026-01-26 |
| B of A Securities | Maintain | Buy | 2026-01-22 |
| Stifel | Maintain | Buy | 2026-01-14 |
| B of A Securities | Maintain | Buy | 2026-01-13 |
Which company has the best grades?
Both companies receive predominantly positive grades, including multiple “Buy” and “Outperform” ratings. Teradyne shows consistent “Buy” and “Overweight” grades, slightly broader than NXP’s mix, suggesting comparable institutional confidence that may influence investor sentiment and portfolio positioning.
Risks specific to each company
In the challenging 2026 market environment, these categories identify the critical pressure points and systemic threats facing both NXP Semiconductors N.V. and Teradyne, Inc.:
1. Market & Competition
NXP Semiconductors N.V.
- Faces intense competition in automotive and IoT semiconductors; moderate asset turnover signals competitive pressure.
Teradyne, Inc.
- Operates in specialized test equipment markets; higher asset turnover reflects efficient market positioning but higher beta implies risk.
2. Capital Structure & Debt
NXP Semiconductors N.V.
- High debt-to-equity ratio (1.22) signals elevated leverage risk; interest coverage is adequate but warrants caution.
Teradyne, Inc.
- Low debt-to-equity (0.12) indicates strong balance sheet; very high interest coverage reduces financial distress risk.
3. Stock Volatility
NXP Semiconductors N.V.
- Beta of 1.46 suggests above-market volatility; stock price range relatively stable.
Teradyne, Inc.
- Beta of 1.82 indicates higher volatility; recent sharp price drop (-4.7%) raises concerns.
4. Regulatory & Legal
NXP Semiconductors N.V.
- Exposure to international trade regulations given global footprint, especially China and Europe.
Teradyne, Inc.
- U.S.-centric with defense sector exposure; regulatory environment could tighten amid geopolitical tensions.
5. Supply Chain & Operations
NXP Semiconductors N.V.
- Complex global operations in multiple countries increase supply chain risk; semiconductor shortages remain a systemic threat.
Teradyne, Inc.
- Smaller workforce and diversified segments reduce operational complexity; automation segment mitigates supply chain vulnerability.
6. ESG & Climate Transition
NXP Semiconductors N.V.
- Increasing pressure to meet ESG standards in semiconductor manufacturing; energy-intensive processes could elevate transition costs.
Teradyne, Inc.
- Robotics and automation focus aligns well with climate transition goals; ESG compliance likely less costly.
7. Geopolitical Exposure
NXP Semiconductors N.V.
- Significant exposure to China and Asia-Pacific risks amid ongoing trade tensions.
Teradyne, Inc.
- Primarily U.S.-based; defense and industrial segments may be impacted by geopolitical defense spending shifts.
Which company shows a better risk-adjusted profile?
Teradyne’s low leverage, superior interest coverage, and higher return on invested capital present a stronger risk-adjusted profile despite notable stock volatility. NXP’s elevated debt and global geopolitical exposure amplify its risk, although it maintains solid operational scale and profitability. Teradyne’s recent 4.7% stock dip signals market concern but fits with its higher beta. I see Teradyne as more resilient, balancing growth and financial stability better in 2026’s volatile semiconductor landscape.
Final Verdict: Which stock to choose?
NXP Semiconductors N.V. (NXPI) excels as a cash generator with solid profitability and a strong balance sheet. Its efficiency in turning invested capital into returns is notable, though its slightly elevated debt-to-equity ratio remains a point of vigilance. NXPI suits investors targeting aggressive growth with moderate risk tolerance.
Teradyne, Inc. (TER) boasts a strategic moat in automation and testing solutions, delivering consistently high returns on invested capital with minimal leverage. It offers a safer profile than NXPI, backed by strong liquidity and conservative debt levels. TER fits well within Growth at a Reasonable Price (GARP) portfolios seeking stability with upside.
If you prioritize high capital efficiency and aggressive expansion, NXPI presents a compelling choice due to its robust cash generation despite some leverage concerns. However, if you seek better financial stability and a durable competitive advantage, TER outshines NXPI with superior balance sheet strength and a proven moat, albeit at a premium valuation. Both require careful monitoring of their declining ROIC trends.
Disclaimer: Investment carries a risk of loss of initial capital. The past performance is not a reliable indicator of future results. Be sure to understand risks before making an investment decision.
Go Further
I encourage you to read the complete analyses of NXP Semiconductors N.V. and Teradyne, Inc. to enhance your investment decisions: