Home > Comparison > Technology > TSM vs NXPI
The strategic rivalry between Taiwan Semiconductor Manufacturing Company Limited and NXP Semiconductors N.V. shapes the semiconductor industry’s future. TSMC operates as a capital-intensive contract manufacturer dominating advanced wafer fabrication. NXP contrasts as a diversified semiconductor innovator focused on automotive and connectivity solutions. This head-to-head pits scale and process leadership against product specialization. This analysis will identify which company’s trajectory offers superior risk-adjusted returns for a diversified portfolio in an evolving technology landscape.
Table of contents
Companies Overview
Taiwan Semiconductor Manufacturing Company Limited and NXP Semiconductors N.V. stand as key players shaping the semiconductor industry.
Taiwan Semiconductor Manufacturing Company Limited: Global Foundry Leader
Taiwan Semiconductor Manufacturing Company Limited dominates wafer fabrication, producing integrated circuits for high performance computing and consumer electronics. Its core revenue stems from advanced wafer fabrication processes, including CMOS logic and mixed-signal technologies. In 2026, the company focuses strategically on expanding cutting-edge manufacturing capabilities and investing in technology start-ups to maintain its technological edge.
NXP Semiconductors N.V.: Diverse Semiconductor Solutions Provider
NXP Semiconductors N.V. specializes in microcontrollers, application processors, and wireless connectivity solutions for automotive and IoT markets. Its revenue base is driven by a broad product portfolio that serves original equipment manufacturers globally. The company’s 2026 strategy emphasizes innovation in communication processors and security controllers to capitalize on increasing demand in connected devices and automotive sectors.
Strategic Collision: Similarities & Divergences
Both companies lead in semiconductors but diverge in approach: Taiwan Semiconductor Manufacturing Company Limited operates a pure-play foundry model, while NXP builds a diversified product ecosystem. Their primary battleground lies in automotive and IoT chips, where scale meets specialization. This creates distinct investment profiles—one focused on manufacturing dominance, the other on product innovation and market breadth.
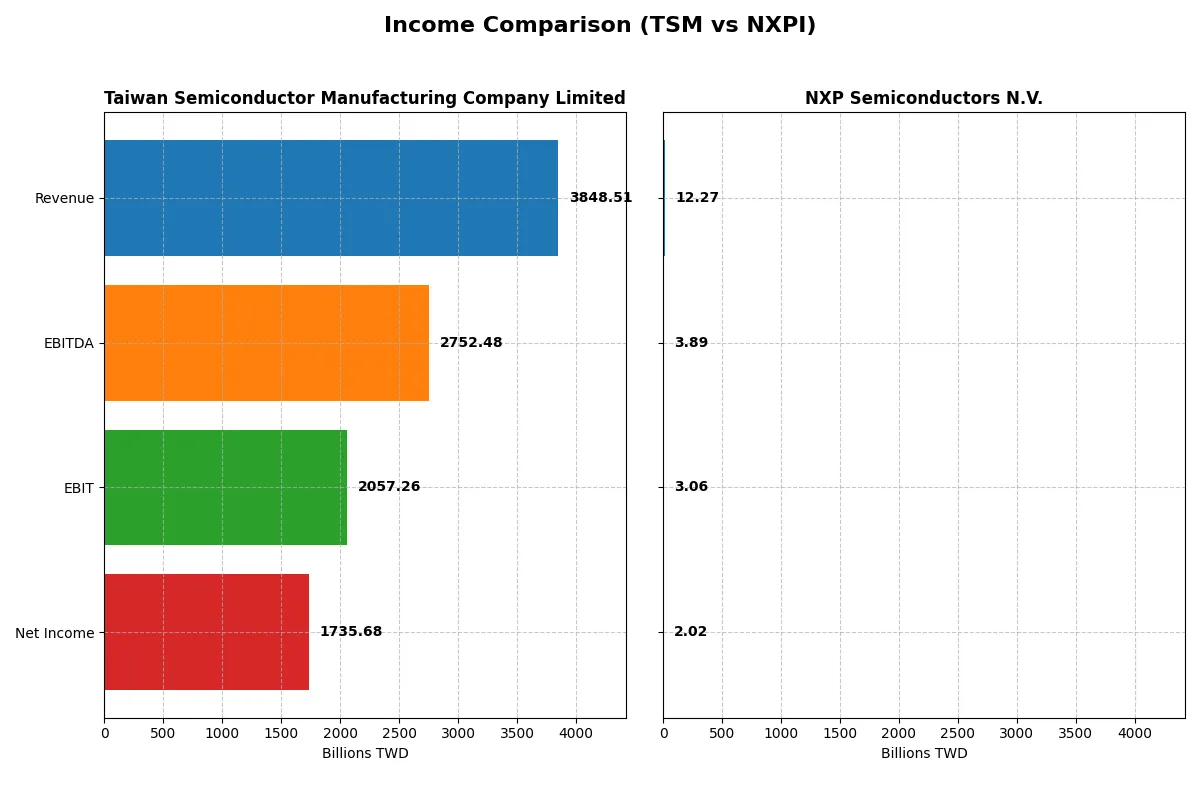
Income Statement Comparison
This data dissects the core profitability and scalability of both corporate engines to reveal who dominates the bottom line:
| Metric | Taiwan Semiconductor Manufacturing Company Limited (TSM) | NXP Semiconductors N.V. (NXPI) |
|---|---|---|
| Revenue | 3.85T TWD | 12.27B USD |
| Cost of Revenue | 1.54T TWD | 5.59B USD |
| Operating Expenses | 349.2B TWD | 3.37B USD |
| Gross Profit | 2.30T TWD | 6.68B USD |
| EBITDA | 2.75T TWD | 3.89B USD |
| EBIT | 2.06T TWD | 3.06B USD |
| Interest Expense | 0 TWD | 384M USD |
| Net Income | 1.74T TWD | 2.02B USD |
| EPS | 334.6 TWD | 8.00 USD |
| Fiscal Year | 2025 | 2025 |
Income Statement Analysis: The Bottom-Line Duel
This income statement comparison reveals the core efficiency and profitability dynamics driving each company’s financial engine in 2025.
Taiwan Semiconductor Manufacturing Company Limited Analysis
TSM’s revenue surged 33% in 2025 to 3.85T TWD, with net income climbing 50% to 1.74T TWD, signaling robust growth momentum. Its gross margin stands near 60%, while net margin improved to 45%, reflecting exceptional cost control and operational efficiency. The company’s expanding EPS underscores strong capital allocation and market positioning.
NXP Semiconductors N.V. Analysis
NXPI experienced a 2.7% revenue decline to $12.3B in 2025, with net income dropping 18% to $2.02B, indicating recent headwinds. Despite a solid 54% gross margin, its net margin remains modest at 16%, pressured by higher interest expenses and lower operating leverage. The falling EPS signals challenges in sustaining profitability momentum amid market softness.
Margin Dominance vs. Scale Stability
TSM clearly dominates on margin strength and growth velocity, delivering nearly triple the net income with superior efficiency. NXPI’s scale is respectable but marred by recent contraction and margin pressure. For investors prioritizing resilient profitability and margin expansion, TSM’s profile stands out as the more compelling fundamental engine.
Financial Ratios Comparison
These vital ratios act as a diagnostic tool to expose the underlying fiscal health, valuation premiums, and capital efficiency of companies analyzed here:
| Ratios | Taiwan Semiconductor Manufacturing Company Limited (TSM) | NXP Semiconductors N.V. (NXPI) |
|---|---|---|
| ROE | 32.1% | 20.1% |
| ROIC | 24.9% | 11.0% |
| P/E | 28.5 | 27.1 |
| P/B | 9.14 | 5.45 |
| Current Ratio | 2.62 | 2.05 |
| Quick Ratio | 2.42 | 1.38 |
| D/E | 0.18 | 1.22 |
| Debt-to-Assets | 12.5% | 46.0% |
| Interest Coverage | 0 (unspecified) | 8.62 |
| Asset Turnover | 0.49 | 0.46 |
| Fixed Asset Turnover | 1.05 | 4.12 |
| Payout ratio | 27.2% | 50.7% |
| Dividend yield | 0.95% | 1.87% |
| Fiscal Year | 2025 | 2025 |
Efficiency & Valuation Duel: The Vital Signs
Financial ratios serve as a company’s DNA, uncovering hidden risks and revealing operational excellence behind headline figures.
Taiwan Semiconductor Manufacturing Company Limited
TSMC commands a robust ROE of 32.12% and a stellar 45.1% net margin, showcasing exceptional profitability. However, its P/E of 28.45 and P/B of 9.14 indicate a stretched valuation relative to earnings and book value. The company maintains a healthy dividend yield of 0.95%, balancing shareholder returns despite premium pricing.
NXP Semiconductors N.V.
NXP posts a solid ROE of 20.1% and a decent 16.47% net margin, reflecting efficient capital use but lower profitability than TSMC. Its P/E ratio of 27.14 and P/B of 5.45 suggest the stock is also expensive but less stretched than TSMC. NXP offers a 1.87% dividend yield, signaling a stronger direct return to shareholders amid moderate leverage.
Premium Valuation vs. Operational Safety
TSMC delivers superior profitability and a more favorable balance sheet, though at a higher valuation premium. NXP offers a better dividend yield and less stretched book value but carries more debt risk. Investors seeking operational strength may prefer TSMC, while those favoring income and moderate risk might lean toward NXP.
Which one offers the Superior Shareholder Reward?
I see Taiwan Semiconductor Manufacturing Company Limited (TSM) balances a modest 0.95% dividend yield with a 27% payout ratio, backed by strong free cash flow of 211TWD per share and consistent buybacks. NXP Semiconductors N.V. (NXPI) pays a slightly higher 1.87% yield but with a riskier 51% payout ratio, relying more on acquisitions and less on cash flow. TSM’s disciplined capital allocation and sustainable dividend plus buyback program offer a more reliable total return in 2026. I favor TSM for superior, long-term shareholder reward.
Comparative Score Analysis: The Strategic Profile
The radar chart reveals the fundamental DNA and trade-offs of Taiwan Semiconductor Manufacturing Company Limited and NXP Semiconductors N.V.:
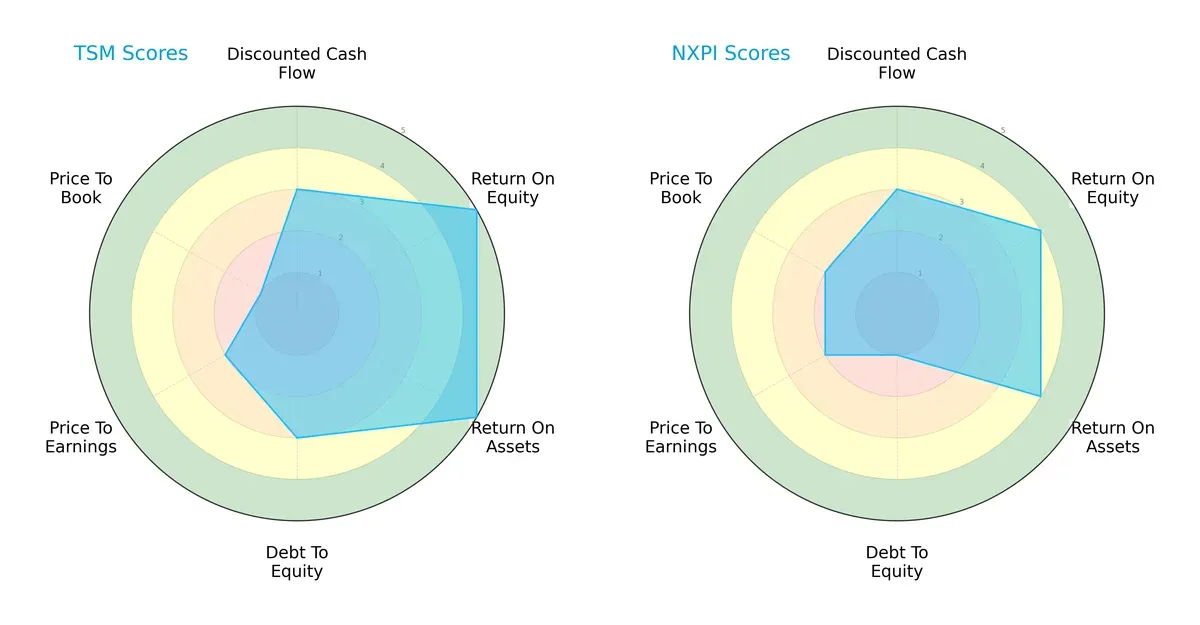
Taiwan Semiconductor Manufacturing Company Limited excels in profitability with top ROE and ROA scores (5 each), indicating superior asset and equity efficiency. NXP Semiconductors N.V. shows a weaker balance sheet, reflected in a very unfavorable debt-to-equity score (1). Both firms share moderate discounted cash flow and P/E scores, but Taiwan Semiconductor’s very unfavorable price-to-book score (1) signals possible overvaluation concerns. Overall, Taiwan Semiconductor presents a more balanced profile anchored in operational strength, while NXP leans on a lower valuation edge amid financial leverage risks.
Bankruptcy Risk: Solvency Showdown
Taiwan Semiconductor Manufacturing Company’s Altman Z-Score of 15.7 significantly outpaces NXP Semiconductors’ 3.1, confirming both firms sit in the safe zone but with a notable solvency margin:
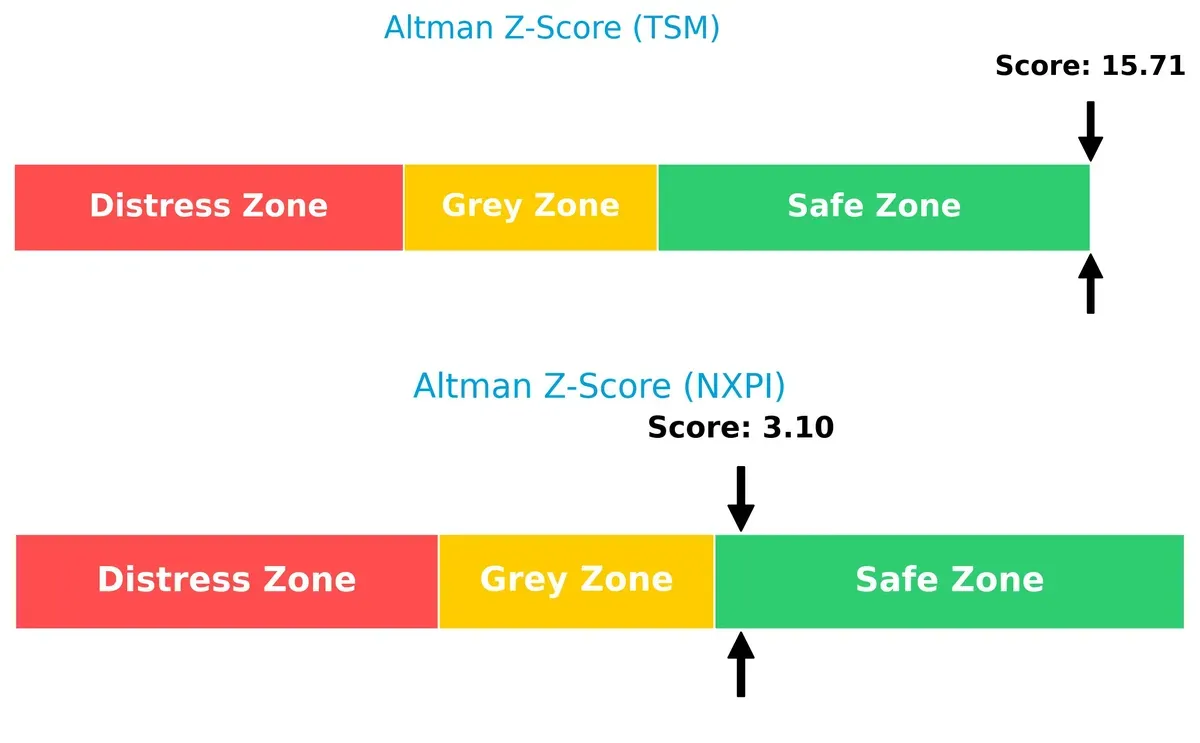
This wide delta signals Taiwan Semiconductor’s far superior financial resilience against economic downturns. NXP’s score near the lower safe zone boundary demands caution, especially in volatile semiconductor cycles.
Financial Health: Quality of Operations
Taiwan Semiconductor Manufacturing Company’s Piotroski F-Score of 8 starkly contrasts with NXP Semiconductors’ moderate score of 5, marking a clear difference in operational quality:
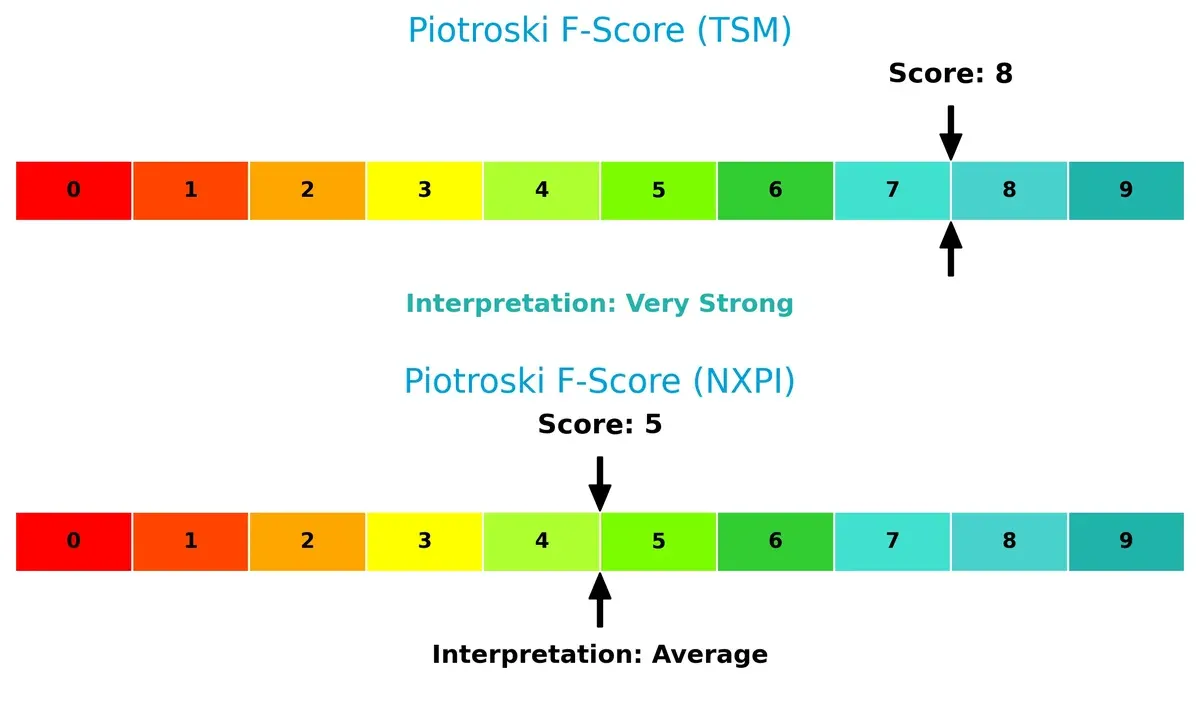
An 8 indicates Taiwan Semiconductor is in peak financial health, demonstrating robust profitability, liquidity, and efficiency. NXP’s average score highlights potential red flags in internal metrics that investors must monitor closely.
How are the two companies positioned?
This section dissects the operational DNA of TSM and NXPI by comparing their revenue distribution and internal dynamics. The goal is to confront their economic moats to identify which model offers the most resilient competitive advantage today.
Revenue Segmentation: The Strategic Mix
This visual comparison dissects how Taiwan Semiconductor Manufacturing Company Limited and NXP Semiconductors N.V. diversify their income streams and where their primary sector bets lie:
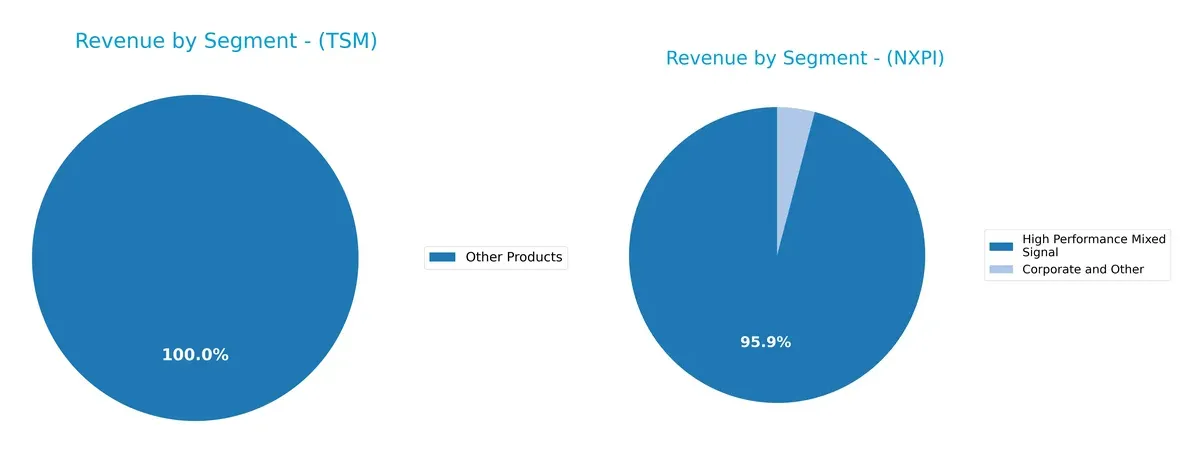
Taiwan Semiconductor anchors its revenue heavily on the Wafer segment, generating over 1.9T TWD in 2022, dwarfing its Other Products revenue of 272B TWD. In contrast, NXP Semiconductors shows a more balanced mix, with High Performance Mixed Signal dominating but Standard Products contributing significantly. TSM’s concentration signals infrastructure dominance but heightens segment risk. NXP’s diversification suggests resilience through mixed market exposure.
Strengths and Weaknesses Comparison
This table compares the Strengths and Weaknesses of Taiwan Semiconductor Manufacturing Company Limited (TSM) and NXP Semiconductors N.V. (NXPI):
TSM Strengths
- High profitability with 45.1% net margin
- Strong ROE at 32.12%
- Low debt-to-equity ratio at 0.18
- Robust current and quick ratios above 2.4
- Leading global presence, especially in the US and China
- Dominant wafer segment revenue
NXPI Strengths
- Favorable profitability with 16.47% net margin
- Solid ROE of 20.1%
- Strong interest coverage at 7.97
- High fixed asset turnover at 4.12
- Diversified geographic presence across Asia, Europe, and US
- Presence in high-performance mixed signal products
TSM Weaknesses
- Unfavorable valuation metrics, PE at 28.45 and PB at 9.14
- Unfavorable asset turnover at 0.49
- Low dividend yield below 1%
- Concentrated revenue in wafer products
- Moderate fixed asset turnover at 1.05
NXPI Weaknesses
- High debt-to-equity ratio at 1.22
- Unfavorable valuation metrics, PE at 27.14 and PB at 5.45
- Unfavorable asset turnover at 0.46
- Moderate dividend yield at 1.87%
- Limited product diversification outside core segments
TSM’s strengths lie in superior profitability and balance sheet strength, but it faces valuation and revenue concentration risks. NXPI shows solid diversification and asset utilization but carries higher debt and valuation pressures. Each company’s position reflects distinct strategic trade-offs in profitability, financial health, and market focus.
The Moat Duel: Analyzing Competitive Defensibility
A structural moat is the only reliable shield protecting long-term profits from relentless competitive pressures and market erosion:
Taiwan Semiconductor Manufacturing Company Limited: Scale-Driven Cost Advantage
TSMC’s moat stems from unmatched scale and advanced node technology, driving superior ROIC above WACC by 15%. This yields margin stability and robust profit growth. Expansion into cutting-edge 2nm and automotive markets in 2026 will deepen its cost leadership.
NXP Semiconductors N.V.: Niche Product Differentiation
NXP relies on specialized microcontrollers and connectivity solutions, but its ROIC barely exceeds WACC by 1.7%, with a declining trend. Unlike TSMC, NXP faces margin pressure. Growth hinges on IoT and automotive security, though competition threatens its narrower moat.
Cost Leadership vs. Product Specialization: The Moat Showdown
TSMC’s wider, scale-based moat outmatches NXP’s narrower niche focus. With growing ROIC and expanding market reach, TSMC stands better poised to defend and extend its dominant semiconductor position.
Which stock offers better returns?
The stock prices of Taiwan Semiconductor Manufacturing Company Limited and NXP Semiconductors N.V. show contrasting dynamics over the past year, with TSM demonstrating strong gains and NXPI facing declines followed by recent recovery.
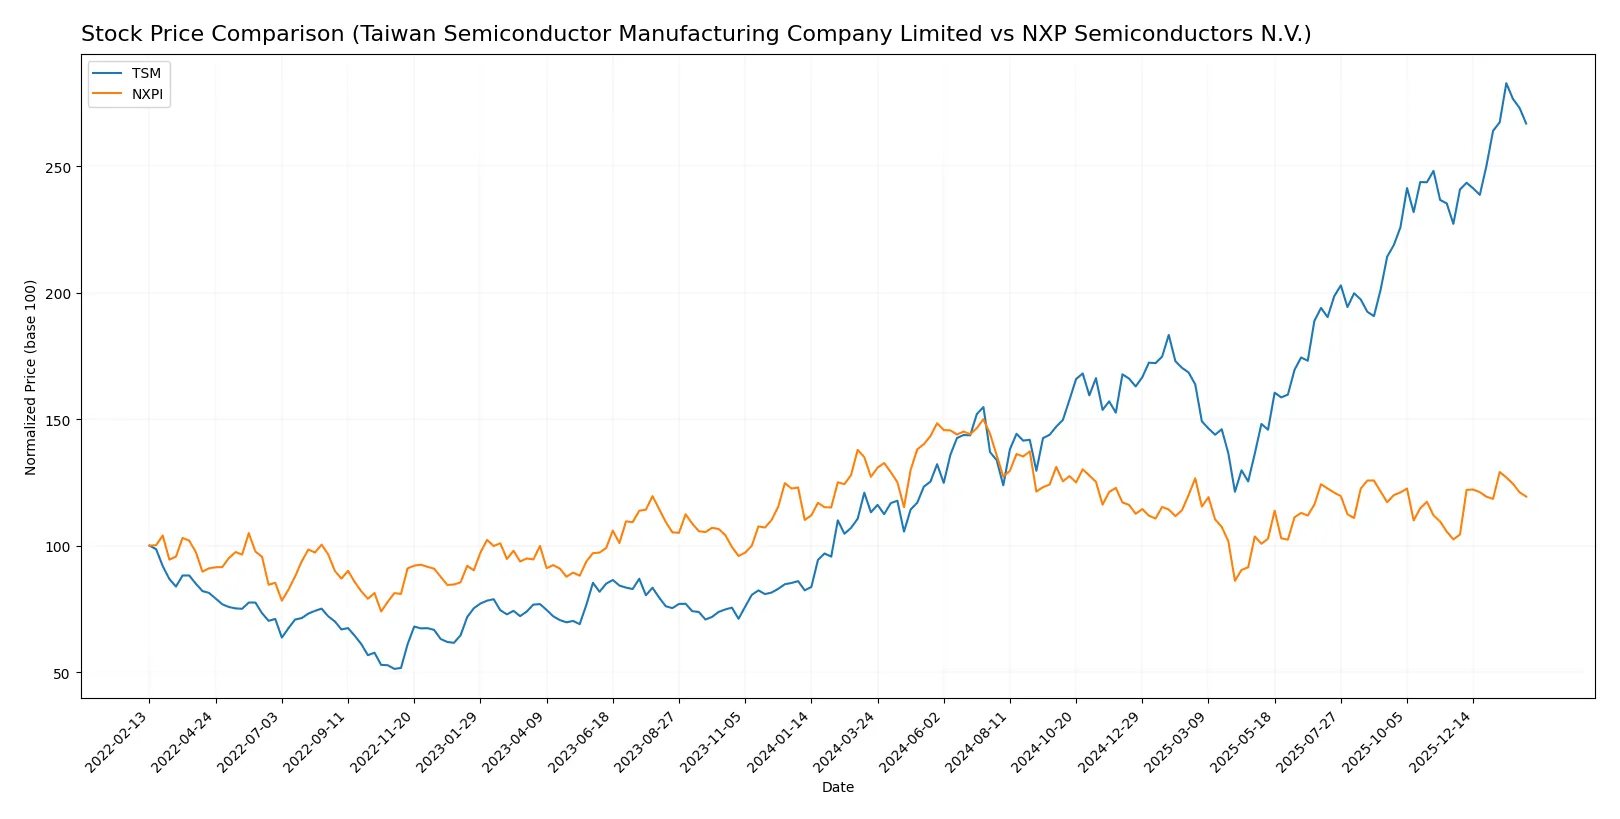
Trend Comparison
Taiwan Semiconductor (TSM) posts a bullish trend with a 135.85% gain over 12 months, accelerating upwards from a low of 127.7 to a high near 342.4. Recent weeks confirm positive momentum with a 17.46% rise.
NXP Semiconductors (NXPI) endures a bearish trend, losing 6.11% over the same period despite acceleration. The stock fluctuated between 160.81 and 280.19, recovering 16.55% recently but remaining below prior highs.
TSM outperforms NXPI, delivering the highest market return by a wide margin, reflecting stronger overall price appreciation and sustained bullish momentum.
Target Prices
Analysts show a bullish consensus for Taiwan Semiconductor Manufacturing Company Limited and NXP Semiconductors N.V.
| Company | Target Low | Target High | Consensus |
|---|---|---|---|
| Taiwan Semiconductor Manufacturing Company Limited | 330 | 450 | 397.5 |
| NXP Semiconductors N.V. | 215 | 280 | 250 |
The target consensus for TSM sits about 24% above its current price of 321 USD, signaling upside potential. NXPI’s consensus target is roughly 12% higher than its 223 USD share price, reflecting moderate optimism.

Don’t Let Luck Decide Your Entry Point
Optimize your entry points with our advanced ProRealTime indicators. You’ll get efficient buy signals with precise price targets for maximum performance. Start outperforming now!
How do institutions grade them?
Taiwan Semiconductor Manufacturing Company Limited Grades
The following table summarizes recent grades from major grading companies for TSM:
| Grading Company | Action | New Grade | Date |
|---|---|---|---|
| TD Cowen | Maintain | Hold | 2026-01-16 |
| Barclays | Maintain | Overweight | 2026-01-16 |
| Needham | Maintain | Buy | 2026-01-15 |
| Bernstein | Maintain | Outperform | 2025-12-08 |
| Needham | Maintain | Buy | 2025-10-27 |
| Barclays | Maintain | Overweight | 2025-10-17 |
| Needham | Maintain | Buy | 2025-10-16 |
| Susquehanna | Maintain | Positive | 2025-10-10 |
| Barclays | Maintain | Overweight | 2025-10-09 |
| Barclays | Maintain | Overweight | 2025-09-16 |
NXP Semiconductors N.V. Grades
Below is a summary of recent institutional grades for NXPI:
| Grading Company | Action | New Grade | Date |
|---|---|---|---|
| Evercore ISI Group | Maintain | Outperform | 2026-02-04 |
| B of A Securities | Maintain | Buy | 2026-02-04 |
| Truist Securities | Maintain | Buy | 2026-02-04 |
| Mizuho | Maintain | Outperform | 2026-02-04 |
| Citigroup | Maintain | Buy | 2026-02-04 |
| JP Morgan | Maintain | Neutral | 2026-02-04 |
| Needham | Maintain | Buy | 2026-02-03 |
| Citigroup | Maintain | Buy | 2026-01-15 |
| Wells Fargo | Maintain | Overweight | 2026-01-15 |
| Truist Securities | Maintain | Buy | 2025-12-19 |
Which company has the best grades?
NXPI consistently receives a higher concentration of “Buy” and “Outperform” ratings compared to TSM’s mix of “Buy,” “Overweight,” and “Hold.” This suggests stronger analyst conviction in NXPI’s near-term outlook. For investors, NXPI’s superior grades could signal greater institutional confidence and potential market momentum.
Risks specific to each company
The following categories identify the critical pressure points and systemic threats facing both firms in the 2026 market environment:
1. Market & Competition
Taiwan Semiconductor Manufacturing Company Limited
- Dominates high-performance and advanced node manufacturing but faces intense competition from emerging foundries.
NXP Semiconductors N.V.
- Strong in automotive and IoT chips but contends with larger competitors in communication processors and sensors.
2. Capital Structure & Debt
Taiwan Semiconductor Manufacturing Company Limited
- Maintains a conservative capital structure with low debt-to-equity (0.18), signaling financial strength.
NXP Semiconductors N.V.
- Carries high leverage (debt-to-equity 1.22), increasing financial risk and interest burden.
3. Stock Volatility
Taiwan Semiconductor Manufacturing Company Limited
- Beta at 1.27 reflects moderate market sensitivity typical for large cap semiconductors.
NXP Semiconductors N.V.
- Higher beta of 1.46 indicates greater stock price volatility and risk exposure.
4. Regulatory & Legal
Taiwan Semiconductor Manufacturing Company Limited
- Exposed to geopolitical tensions impacting Taiwan, with potential regulatory constraints on exports.
NXP Semiconductors N.V.
- Faces complex regulatory environments across multiple jurisdictions, including EU and US compliance demands.
5. Supply Chain & Operations
Taiwan Semiconductor Manufacturing Company Limited
- Benefits from scale but vulnerable to raw material scarcity and geopolitical disruptions in Asia.
NXP Semiconductors N.V.
- More diversified supply chain but sensitive to semiconductor shortages and logistics bottlenecks.
6. ESG & Climate Transition
Taiwan Semiconductor Manufacturing Company Limited
- Invests in sustainable manufacturing but must manage energy-intensive fabs amid global decarbonization pressure.
NXP Semiconductors N.V.
- Actively pushes ESG initiatives; however, semiconductor production remains energy and resource intensive.
7. Geopolitical Exposure
Taiwan Semiconductor Manufacturing Company Limited
- High exposure to Taiwan-China tensions poses significant geopolitical risk.
NXP Semiconductors N.V.
- Operates globally with exposure to US-China trade tensions but less concentrated risk than TSM.
Which company shows a better risk-adjusted profile?
Taiwan Semiconductor’s biggest risk lies in geopolitical tensions threatening its Taiwan-based operations. NXP’s largest risk stems from its high debt load, which heightens financial vulnerability. I see Taiwan Semiconductor offering a better risk-adjusted profile due to its strong balance sheet and dominant market position, offsetting geopolitical risks more effectively than NXP’s financial leverage concerns. Its Altman Z-score of 15.7 versus NXP’s 3.1 confirms superior financial safety despite operational risks.
Final Verdict: Which stock to choose?
Taiwan Semiconductor Manufacturing Company Limited (TSM) excels as a cash-generating powerhouse with a robust and expanding economic moat. Its efficient capital allocation and consistent value creation stand out. The point of vigilance remains its relatively high valuation multiples, which might temper upside. TSM suits portfolios targeting aggressive growth with quality.
NXP Semiconductors N.V. (NXPI) commands a strategic moat through its specialized R&D and recurring revenue streams, offering a level of resilience. Compared to TSM, it presents a more cautious risk profile but shows signs of declining profitability and elevated leverage. NXPI fits portfolios focused on growth at a reasonable price, balancing innovation and prudence.
If you prioritize sustainable competitive advantage and capital efficiency, TSM is the compelling choice due to its superior moat and expanding returns. However, if you seek exposure to niche innovation with a more moderate risk appetite, NXPI offers better stability despite its challenges. Each presents an analytical scenario tailored to distinct investor strategies.
Disclaimer: Investment carries a risk of loss of initial capital. The past performance is not a reliable indicator of future results. Be sure to understand risks before making an investment decision.
Go Further
I encourage you to read the complete analyses of Taiwan Semiconductor Manufacturing Company Limited and NXP Semiconductors N.V. to enhance your investment decisions: