Home > Comparison > Technology > NXPI vs STM
The strategic rivalry between NXP Semiconductors N.V. and STMicroelectronics N.V. shapes the semiconductor industry’s evolution. NXP operates as a diversified technology provider focused on microcontrollers and wireless connectivity. STMicroelectronics combines automotive and analog semiconductor solutions with a broad sensor and microcontroller portfolio. This analysis pits NXP’s innovation-driven model against ST’s integrated manufacturing scale to identify the superior risk-adjusted investment opportunity for a balanced portfolio.
Table of contents
Companies Overview
NXP Semiconductors and STMicroelectronics stand as pivotal forces in the global semiconductor landscape.
NXP Semiconductors N.V.: Leader in Connectivity Solutions
NXP dominates as a semiconductor innovator specializing in microcontrollers, application processors, and wireless connectivity. Its revenue hinges on supplying advanced chips for automotive, industrial IoT, and mobile sectors. In 2026, NXP sharpens its strategic focus on expanding secure wireless technologies and environmental sensing capabilities.
STMicroelectronics N.V.: Diverse Semiconductor Powerhouse
STMicroelectronics excels in designing and manufacturing a broad portfolio spanning automotive ICs, analog, MEMS sensors, and microcontrollers. The company generates revenue by serving automotive, industrial, and consumer electronics markets globally. Its 2026 strategy prioritizes integrating GaN power transistors and expanding analog and MEMS product lines.
Strategic Collision: Similarities & Divergences
Both companies emphasize automotive and industrial applications but diverge in approach: NXP pursues secure wireless ecosystems, while STMicroelectronics focuses on broad analog and sensor integration. They compete intensely in automotive semiconductors, a critical battleground for market share. Their distinct investment profiles reflect NXP’s connectivity specialization versus ST’s diversified semiconductor portfolio.
Income Statement Comparison
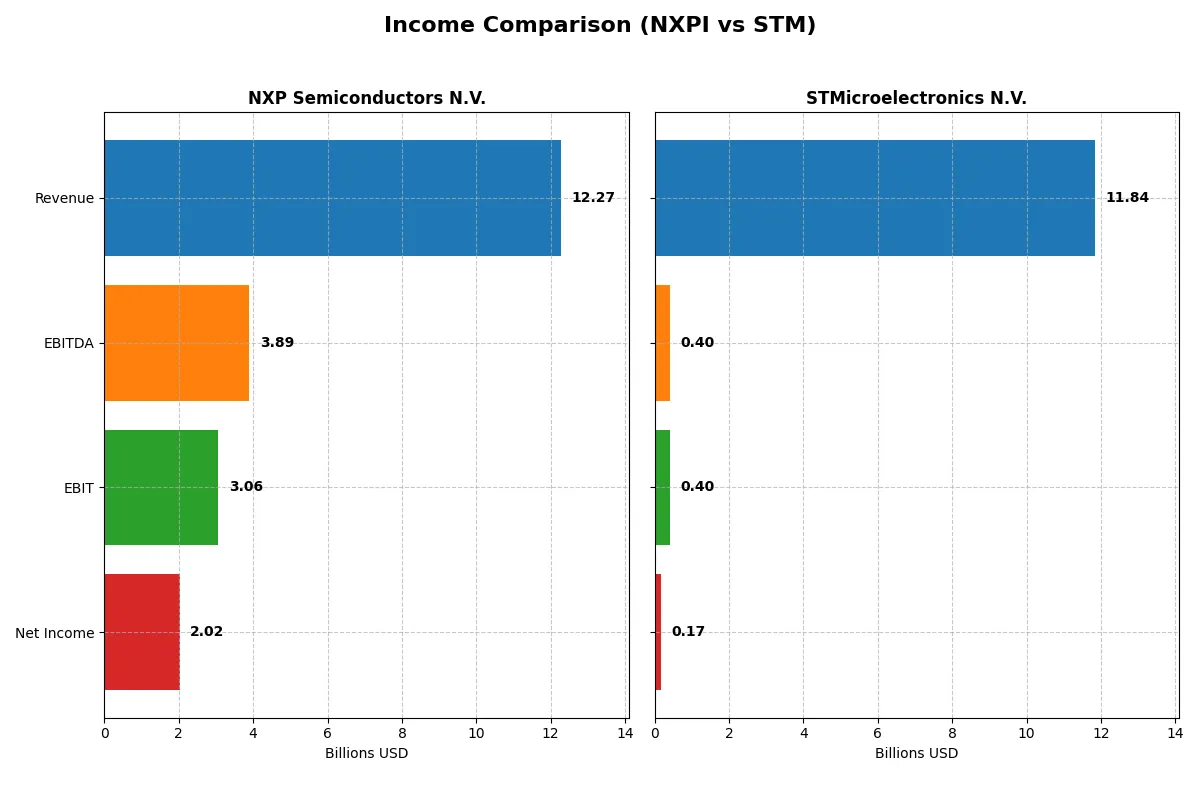
This data dissects the core profitability and scalability of both corporate engines to reveal who dominates the bottom line:
| Metric | NXP Semiconductors N.V. (NXPI) | STMicroelectronics N.V. (STM) |
|---|---|---|
| Revenue | 12.3B | 11.8B |
| Cost of Revenue | 5.6B | 7.8B |
| Operating Expenses | 3.4B | 3.7B |
| Gross Profit | 6.7B | 4.0B |
| EBITDA | 3.9B | 0.4B |
| EBIT | 3.1B | 0.4B |
| Interest Expense | 384M | 0 |
| Net Income | 2.0B | 0 |
| EPS | 8.00 | 0.19 |
| Fiscal Year | 2025 | 2025 |
Income Statement Analysis: The Bottom-Line Duel
This income statement comparison exposes how effectively each company converts sales into profit, revealing their operational efficiency and financial health.
NXP Semiconductors N.V. Analysis
NXP’s revenue grew 10.9% from 2021 to 2025 but slipped 2.7% in 2025 alone. Net income rose 8% overall despite a 17% decline last year. Its gross margin remains strong at 54.4%, and net margin holds at 16.5%, reflecting solid cost control though momentum slowed in 2025.
STMicroelectronics N.V. Analysis
STM’s revenue declined 7.2% over five years and dropped 10.8% in 2025. Net income fell drastically by 91.7% overall and 88% last year. Gross margin at 33.9% is respectable, but net margin is weak at 1.4%, signaling significant margin compression and operational challenges in recent periods.
Margin Strength vs. Shrinking Scale
NXP clearly outperforms STM in profitability and margin resilience, maintaining healthy returns despite slight recent revenue softness. STM struggles with steep declines in net income and margin erosion, undermining its earnings power. For investors, NXP’s profile offers stronger fundamental stability and efficiency amid sector headwinds.
Financial Ratios Comparison
These vital ratios act as a diagnostic tool to expose the underlying fiscal health, valuation premiums, and capital efficiency of the companies compared below:
| Ratios | NXP Semiconductors N.V. (NXPI) | STMicroelectronics N.V. (STM) |
|---|---|---|
| ROE | 20.1% | 0.9% |
| ROIC | 11.0% | 0.7% |
| P/E | 27.1 | N/A |
| P/B | 5.45 | N/A |
| Current Ratio | 2.05 | 3.36 |
| Quick Ratio | 1.38 | 2.43 |
| D/E | 1.22 | 0.12 |
| Debt-to-Assets | 46.0% | 8.6% |
| Interest Coverage | 8.62 | 0 |
| Asset Turnover | 0.46 | 0.48 |
| Fixed Asset Turnover | 4.12 | 1.07 |
| Payout ratio | 50.7% | 0% |
| Dividend yield | 1.87% | 0% |
| Fiscal Year | 2025 | 2025 |
Efficiency & Valuation Duel: The Vital Signs
Ratios act as a company’s DNA, exposing hidden risks and operational strengths crucial for informed investment decisions.
NXP Semiconductors N.V.
NXP Semiconductors shows robust profitability with a 20.1% ROE and a strong 16.47% net margin, signaling operational efficiency. Its valuation appears stretched, with a P/E of 27.14 and P/B of 5.45, above typical sector norms. The company balances shareholder returns with a 1.87% dividend yield, alongside significant reinvestment in R&D.
STMicroelectronics N.V.
STMicroelectronics posts weak profitability, marked by a 0.93% ROE and 1.41% net margin, reflecting operational challenges. Valuation metrics are favorable due to a low P/E and P/B, but the picture is clouded by a lack of dividends and modest returns on capital. The firm maintains a conservative balance sheet with low debt and a strong quick ratio.
Valuation Stretch vs. Operational Fragility
NXP delivers superior profitability and shareholder returns but trades at a premium, increasing valuation risk. STMicroelectronics offers a cheaper valuation and stronger liquidity but struggles with profitability and shareholder yield. Investors seeking growth and income may lean toward NXP, while risk-averse profiles might consider STMicroelectronics’ balance sheet strength.
Which one offers the Superior Shareholder Reward?
I see NXP Semiconductors (NXPI) delivers superior shareholder reward compared to STMicroelectronics (STM). NXPI offers a steady dividend yield near 1.9% with a sustainable payout ratio around 41-51%. It also maintains robust free cash flow coverage exceeding 70%, supporting ongoing dividends and reinvestment. NXPI’s aggressive buyback program enhances total returns, reflected in strong cash flow per share (around $9.6 in 2025) and disciplined capital allocation. In contrast, STM’s dividend yield lags at about 1.3% in 2024 and free cash flow turns negative or erratic, undermining payout sustainability. STM’s buyback activity is minimal, limiting capital return options. Given my experience, NXPI’s balanced distribution strategy combining dividends and buybacks, backed by solid margins and cash flows, offers a more attractive total return profile for 2026 investors.
Comparative Score Analysis: The Strategic Profile
The radar chart reveals the fundamental DNA and trade-offs of NXP Semiconductors N.V. and STMicroelectronics N.V., highlighting their financial strengths and valuation contrasts:
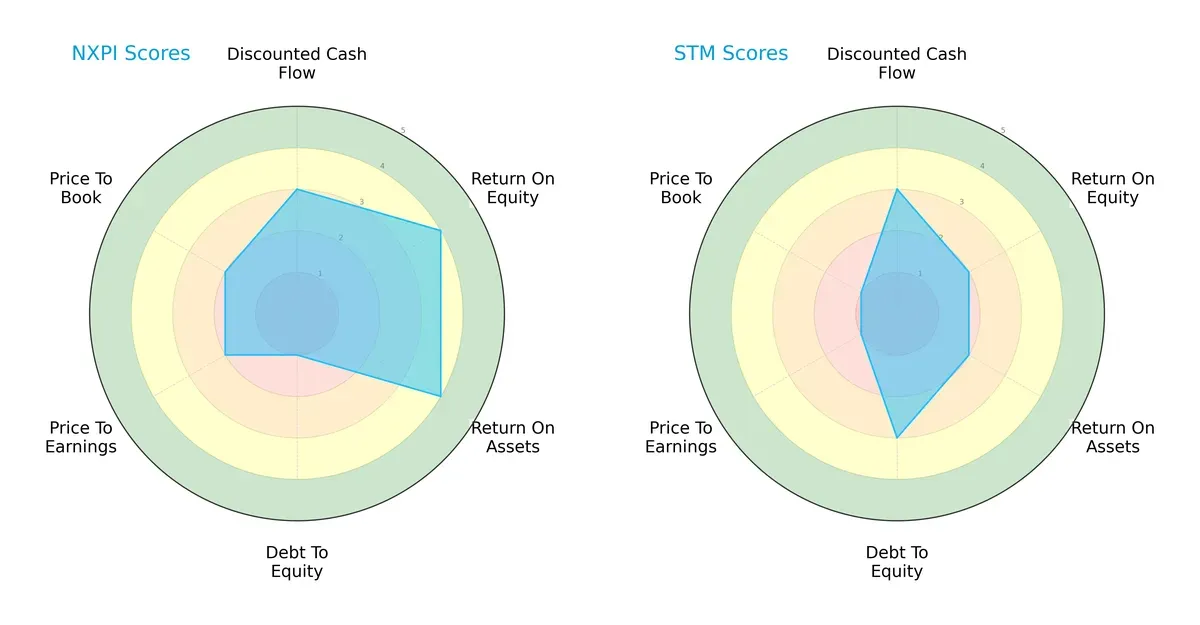
NXP Semiconductors displays superior profitability with ROE and ROA scores at 4 versus STM’s 2, indicating more efficient capital and asset use. However, NXPI’s debt-to-equity score of 1 signals heavy leverage risk, unlike STM’s moderate 3. Valuation metrics favor NXPI moderately, while STM suffers from very unfavorable P/E and P/B scores. Overall, NXPI has a more balanced profile driven by operational efficiency but carries financial risk. STM relies more on conservative leverage but lags in profitability and valuation.
Bankruptcy Risk: Solvency Showdown
The Altman Z-Scores place both firms comfortably in the safe zone, with STM at 3.91 and NXPI at 3.10, reflecting strong long-term solvency in this cycle:
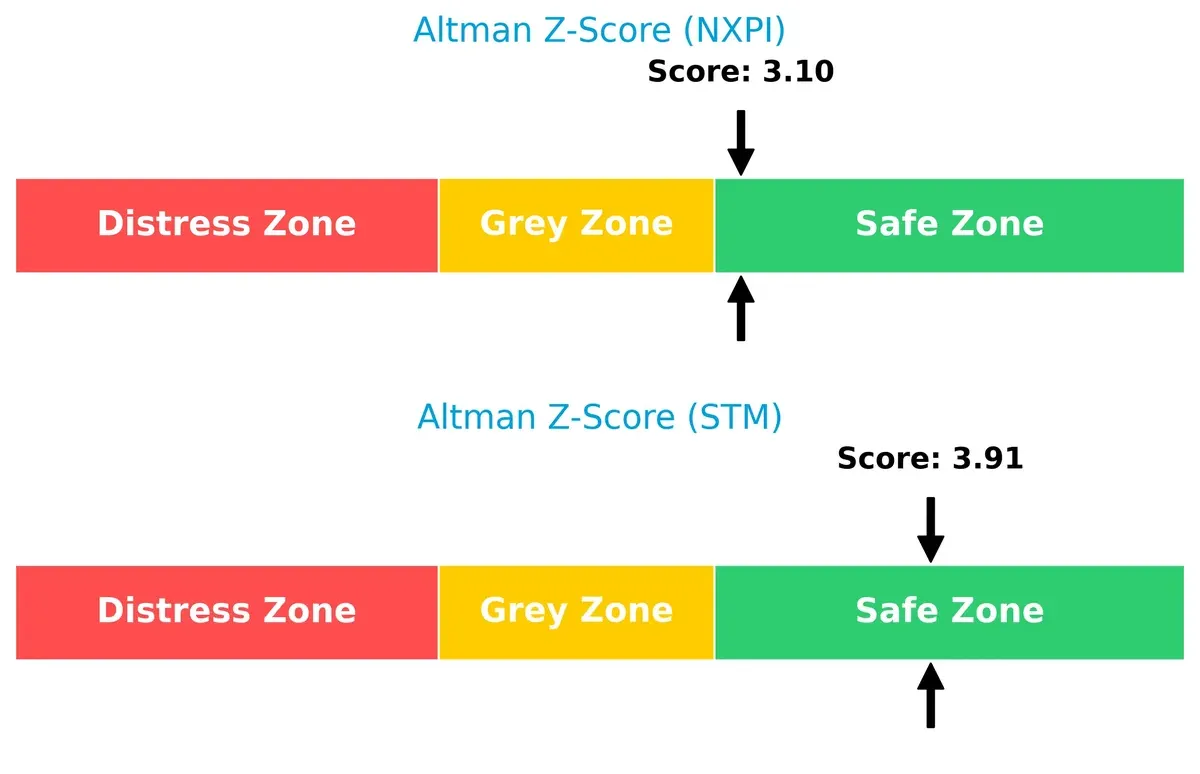
While both companies demonstrate resilience against bankruptcy, STM’s higher score suggests a more robust buffer against financial distress, reinforcing its conservative capital structure as a prudent advantage.
Financial Health: Quality of Operations
STMicroelectronics leads with a Piotroski F-Score of 8, indicating very strong financial health, compared to NXP’s average score of 5:
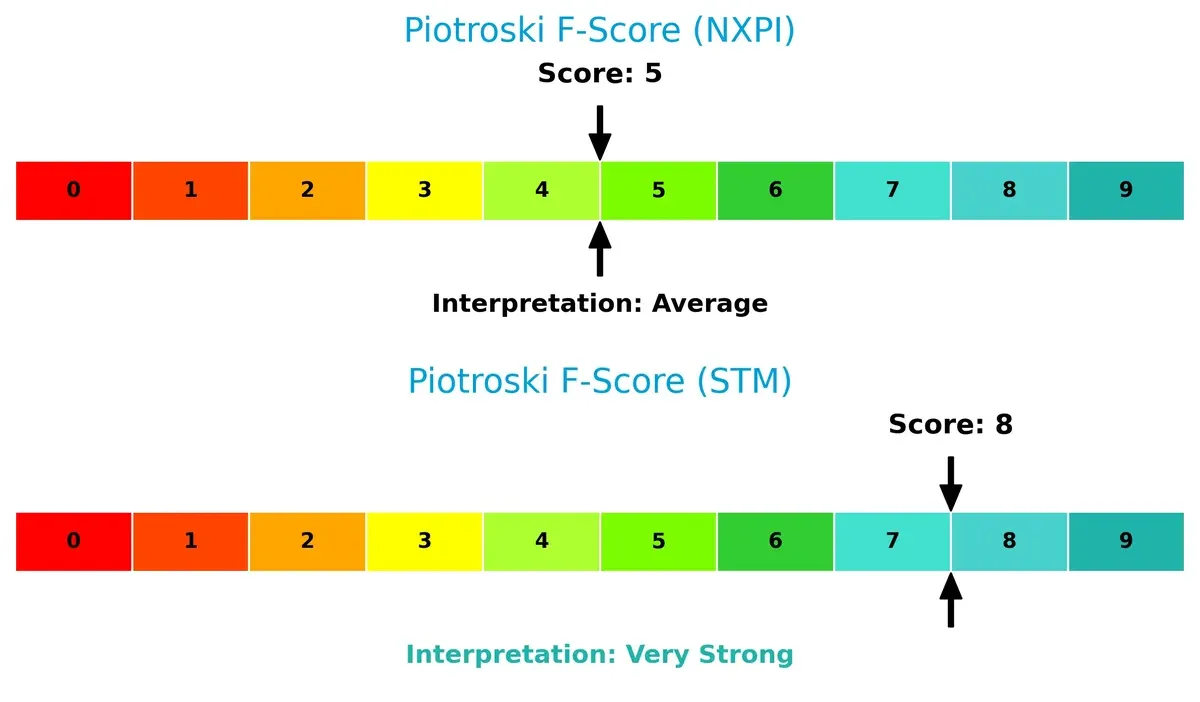
STM’s high score signals solid profitability, liquidity, and operational efficiency, whereas NXPI’s middling score raises caution about internal financial metrics. STM shows fewer red flags, suggesting superior quality of earnings and balance sheet strength.
How are the two companies positioned?
This section dissects the operational DNA of NXP Semiconductors and STMicroelectronics by comparing their revenue distribution and internal dynamics. The goal is to confront their economic moats and identify which model delivers the most resilient competitive advantage today.
Revenue Segmentation: The Strategic Mix
This visual comparison dissects how NXP Semiconductors and STMicroelectronics diversify their income streams and where their primary sector bets lie:
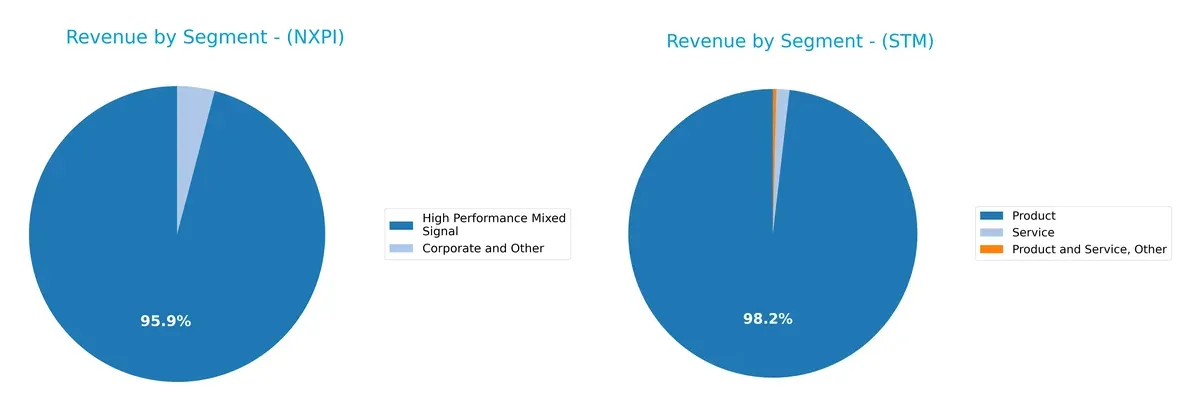
NXP Semiconductors anchors revenue in High Performance Mixed Signal, generating $9B in 2018, dwarfing Corporate and Other at $385M. This signals a focused, high-margin niche dominance. In contrast, STMicroelectronics presents a broader revenue mix, with $13.2B from Products and $52M from Other segments in 2024, illustrating diversification across products and services. NXP’s concentration risks contrast with ST’s strategic spread, supporting resilience amid market cycles.
Strengths and Weaknesses Comparison
This table compares the Strengths and Weaknesses of NXP Semiconductors N.V. and STMicroelectronics N.V.:
NXP Semiconductors N.V. Strengths
- Strong profitability with 16.5% net margin
- High ROE at 20.1%
- Favorable quick ratio at 1.38
- Global revenue spread includes China, US, Europe
- High fixed asset turnover at 4.12
STMicroelectronics N.V. Strengths
- Low debt-to-equity at 0.12
- Favorable interest coverage with infinite ratio
- Favorable price metrics (PE and PB)
- Diversified geographic revenue with strong Singapore and US sales
- Favorable quick ratio at 2.43
NXP Semiconductors N.V. Weaknesses
- Elevated debt-to-equity at 1.22
- Unfavorable PE and PB ratios
- Moderate asset turnover at 0.46
- Dividend yield only neutral at 1.87%
- Net margin and ROIC outperform STM but asset efficiency lags
STMicroelectronics N.V. Weaknesses
- Weak profitability with 1.4% net margin
- Very low ROE and ROIC below 1%
- Unfavorable current ratio at 3.36 suggests possible working capital inefficiency
- Zero dividend yield
- Asset turnover slightly better than NXPI but still unfavorable
Overall, NXP demonstrates stronger profitability and capital efficiency but carries higher financial leverage. STMicroelectronics shows prudent debt management and favorable valuation metrics but faces significant profitability challenges. These profiles suggest contrasting strategic priorities between growth through efficient capital use and conservative balance sheet management.
The Moat Duel: Analyzing Competitive Defensibility
A structural moat is the only defense protecting long-term profits from relentless competition and market commoditization:
NXP Semiconductors N.V.: Innovation-Driven Switching Costs
NXP’s moat stems from proprietary microcontrollers and wireless connectivity solutions creating strong switching costs. High ROIC near 12% until 2025 reflects this edge. Yet, a declining ROIC trend and recent margin pressure warn risks as new entrants target IoT and automotive markets in 2026.
STMicroelectronics N.V.: Broad Product Portfolio and Scale Advantage
STM’s moat lies in diversified semiconductor segments and scale economies, contrasting NXP’s focused innovation moat. However, a negative ROIC gap exceeding WACC by nearly 9% signals value destruction. Its wide footprint in analog and MEMS chips offers expansion, but shrinking margins threaten competitive positioning.
Moat Battle: Innovation Switching Costs vs. Scale Diversification
NXP holds a deeper moat with positive excess returns, despite erosion signs. STM’s scale advantage fails to translate into value creation, showing a wider but weaker moat. NXP is better equipped to defend market share amid intensifying competition in 2026.
Which stock offers better returns?
Over the past year, NXP Semiconductors N.V. and STMicroelectronics N.V. both experienced significant price declines followed by recent sharp rallies, revealing dynamic trading patterns and shifting investor sentiment.
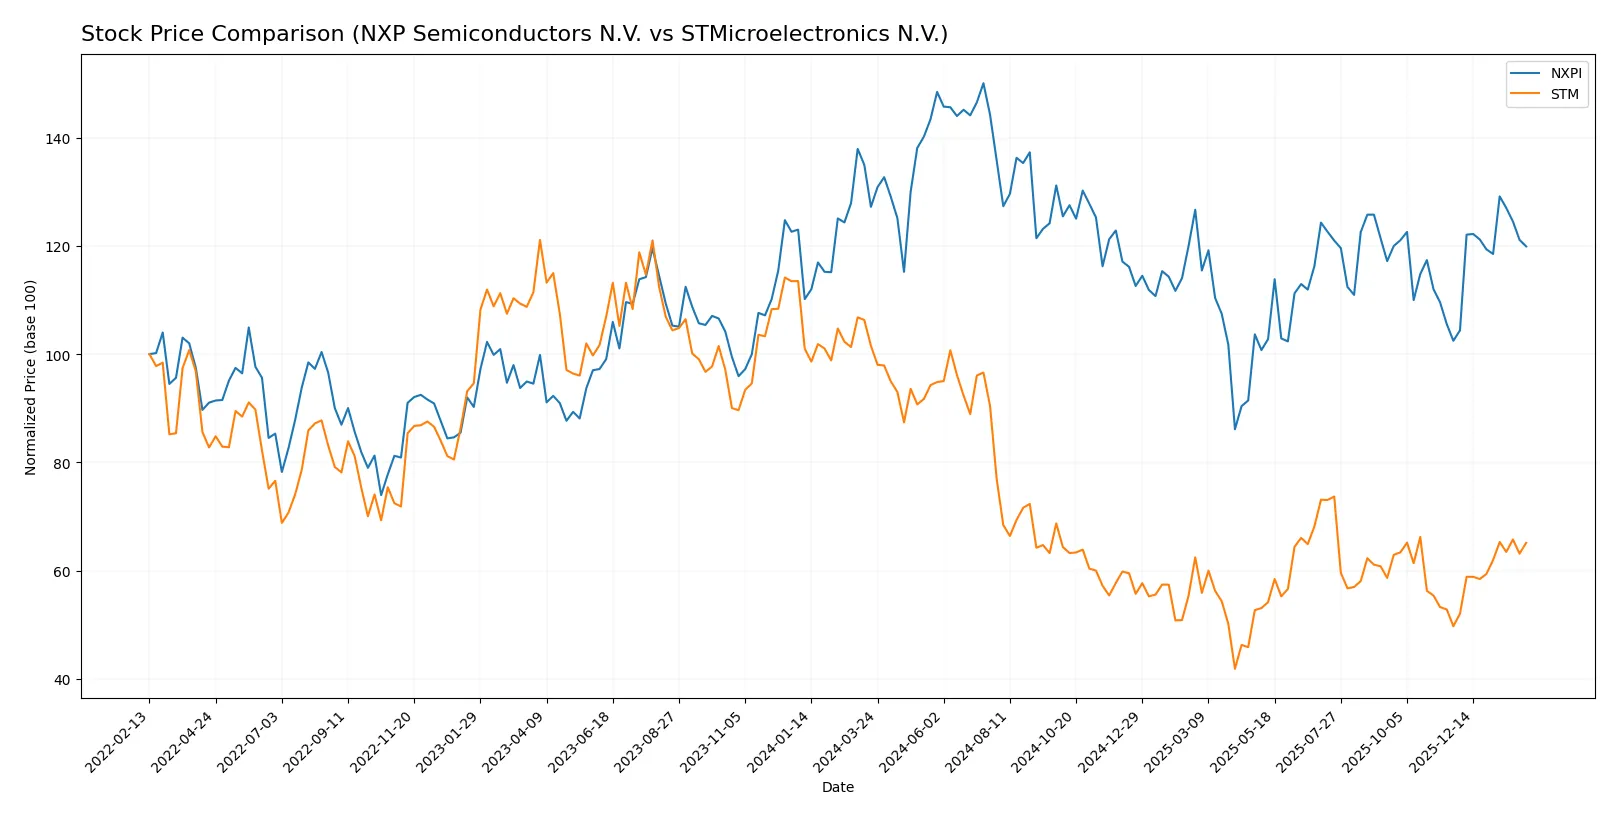
Trend Comparison
NXP Semiconductors N.V. shows a 5.75% price decline over the past 12 months, confirming a bearish trend with accelerating downward momentum. The stock ranged from a high of 280.19 to a low of 160.81, reflecting high volatility (std deviation 24.1).
STMicroelectronics N.V. declined 35.84% over the same period, also bearish with accelerating losses. It traded between 44.85 and 18.49, exhibiting lower volatility (std deviation 6.54) than NXPI.
Recent trends reveal NXPI rebounded 17.01% sharply, while STM gained 30.97%. STM’s larger overall loss contrasts with stronger recent recovery. STM delivered the highest market performance in the latest months.
Target Prices
Analysts present a cautiously optimistic target consensus for these semiconductor leaders.
| Company | Target Low | Target High | Consensus |
|---|---|---|---|
| NXP Semiconductors N.V. | 215 | 280 | 250 |
| STMicroelectronics N.V. | 28 | 45 | 37.67 |
NXP’s consensus target of 250 exceeds its current price of 223, suggesting moderate upside. STMicroelectronics’ target consensus at 37.67 also signals potential growth from the current 28.83.

Don’t Let Luck Decide Your Entry Point
Optimize your entry points with our advanced ProRealTime indicators. You’ll get efficient buy signals with precise price targets for maximum performance. Start outperforming now!
How do institutions grade them?
NXP Semiconductors N.V. Grades
The table below shows recent grades provided by reputable institutions for NXP Semiconductors N.V.:
| Grading Company | Action | New Grade | Date |
|---|---|---|---|
| Evercore ISI Group | maintain | Outperform | 2026-02-04 |
| B of A Securities | maintain | Buy | 2026-02-04 |
| Truist Securities | maintain | Buy | 2026-02-04 |
| Mizuho | maintain | Outperform | 2026-02-04 |
| Citigroup | maintain | Buy | 2026-02-04 |
| JP Morgan | maintain | Neutral | 2026-02-04 |
| Needham | maintain | Buy | 2026-02-03 |
| Citigroup | maintain | Buy | 2026-01-15 |
| Wells Fargo | maintain | Overweight | 2026-01-15 |
| Truist Securities | maintain | Buy | 2025-12-19 |
STMicroelectronics N.V. Grades
The table below presents recent grades from credible grading firms for STMicroelectronics N.V.:
| Grading Company | Action | New Grade | Date |
|---|---|---|---|
| TD Cowen | maintain | Buy | 2025-10-24 |
| Susquehanna | maintain | Positive | 2025-10-22 |
| Susquehanna | maintain | Positive | 2025-07-25 |
| Baird | upgrade | Outperform | 2025-07-22 |
| Susquehanna | maintain | Positive | 2025-07-22 |
| Jefferies | upgrade | Buy | 2025-02-19 |
| Bernstein | downgrade | Market Perform | 2025-02-05 |
| Susquehanna | maintain | Positive | 2025-01-31 |
| Barclays | downgrade | Underweight | 2025-01-22 |
| JP Morgan | downgrade | Neutral | 2024-12-09 |
Which company has the best grades?
NXP Semiconductors N.V. consistently receives Buy and Outperform grades, indicating strong institutional confidence. STMicroelectronics N.V. shows mixed ratings with upgrades and downgrades, reflecting more volatility in sentiment. Investors may interpret NXP’s steadier grades as a sign of relative stability.
Risks specific to each company
The following categories identify the critical pressure points and systemic threats facing both firms in the 2026 market environment:
1. Market & Competition
NXP Semiconductors N.V.
- Faces intense competition in automotive and IoT segments, leveraging strong product portfolio but pressured by innovation cycles.
STMicroelectronics N.V.
- Competes broadly in automotive and industrial markets with diverse products but struggles with lower profitability margins.
2. Capital Structure & Debt
NXP Semiconductors N.V.
- High debt-to-equity ratio (1.22) raises financial risk despite good interest coverage (7.97).
STMicroelectronics N.V.
- Maintains low leverage (debt-to-equity 0.12), signaling conservative capital structure and low financial risk.
3. Stock Volatility
NXP Semiconductors N.V.
- Higher beta (1.458) indicates more stock price volatility relative to the market.
STMicroelectronics N.V.
- Lower beta (1.322) suggests slightly less sensitivity to market swings.
4. Regulatory & Legal
NXP Semiconductors N.V.
- Operates globally with exposure to complex semiconductor export controls and IP regulations.
STMicroelectronics N.V.
- Also global, facing regulatory pressures especially in automotive safety and environmental standards.
5. Supply Chain & Operations
NXP Semiconductors N.V.
- Global supply chain vulnerable to geopolitical tensions, but diversified manufacturing footprint.
STMicroelectronics N.V.
- Similar exposure; large employee base supports operational scale but supply chain disruptions remain a risk.
6. ESG & Climate Transition
NXP Semiconductors N.V.
- Increasing pressure to meet climate goals; sustainability integration ongoing but not leading in ESG scores.
STMicroelectronics N.V.
- Strong focus on ESG; higher Piotroski score reflects better operational efficiency and governance practices.
7. Geopolitical Exposure
NXP Semiconductors N.V.
- Significant China and US market exposure heightens geopolitical risk amid trade tensions.
STMicroelectronics N.V.
- Also exposed to global trade risks but with a balanced presence across regions.
Which company shows a better risk-adjusted profile?
STMicroelectronics’ low leverage and superior Piotroski Score (8 vs. 5 for NXP) provide a stronger financial safety net. However, NXP’s higher profitability and returns come with greater financial risk due to high debt. Recent data shows NXP’s debt-to-equity ratio at 1.22, a red flag despite its solid operating metrics. Meanwhile, STM’s conservative capital structure and safer Altman Z-Score indicate a more resilient risk profile under current market conditions. I see STM as the better choice for cautious investors prioritizing risk management.
Final Verdict: Which stock to choose?
NXP Semiconductors N.V. (NXPI) shines as a cash-generating powerhouse with strong profitability and operational efficiency. Its main point of vigilance lies in a gradually declining return on invested capital, signaling caution on sustaining its competitive edge. NXPI suits investors targeting aggressive growth with a tolerance for valuation premiums.
STMicroelectronics N.V. (STM) offers a strategic moat through its conservative balance sheet and solid liquidity, presenting a safer profile relative to NXPI. However, persistent struggles with profitability and value creation temper its appeal. STM fits portfolios focused on growth at a reasonable price, favoring stability over rapid expansion.
If you prioritize aggressive growth and superior cash flow generation, NXPI is the compelling choice due to its operational strength and income quality despite valuation headwinds. However, if you seek a more conservative approach with emphasis on financial stability and lower leverage, STM offers better stability, albeit with weaker profitability and earnings momentum.
Disclaimer: Investment carries a risk of loss of initial capital. The past performance is not a reliable indicator of future results. Be sure to understand risks before making an investment decision.
Go Further
I encourage you to read the complete analyses of NXP Semiconductors N.V. and STMicroelectronics N.V. to enhance your investment decisions: