Home > Comparison > Technology > NXPI vs SWKS
The strategic rivalry between NXP Semiconductors N.V. and Skyworks Solutions, Inc. defines the current trajectory of the semiconductor sector. NXP operates as a broad-based technology innovator with a diversified product portfolio across automotive and IoT markets. In contrast, Skyworks focuses on specialized analog and mixed-signal components for wireless applications. This analysis evaluates which company’s operational model delivers superior risk-adjusted returns for a diversified portfolio in today’s technology landscape.
Table of contents
Companies Overview
NXP Semiconductors and Skyworks Solutions dominate key niches in the semiconductor industry, driving innovation in connectivity and analog technology.
NXP Semiconductors N.V.: Leader in Integrated Connectivity Solutions
NXP Semiconductors commands a market cap of 56B with a broad portfolio spanning microcontrollers, application processors, and wireless connectivity solutions. Its core revenue stems from supplying advanced semiconductor components for automotive, industrial IoT, and mobile markets. In 2026, NXP sharpens focus on expanding its security controllers and sensor technologies to capture growth in connected devices.
Skyworks Solutions, Inc.: Specialist in Analog and Mixed-Signal Semiconductors
Skyworks Solutions operates with a market cap near 8.7B, emphasizing proprietary semiconductor products like amplifiers, front-end modules, and filters. Its revenue largely depends on consumer electronics, aerospace, and automotive sectors. The company prioritizes innovation in wireless analog system-on-chip products, reinforcing its foothold in smartphone and broadband infrastructure markets this year.
Strategic Collision: Similarities & Divergences
Both firms excel in semiconductor innovation but diverge in business models: NXP pursues a broad integrated connectivity approach, while Skyworks hones in on analog and mixed-signal specialization. They compete fiercely in automotive and mobile device components, a high-growth battleground. NXP offers a diversified growth profile with heavier industrial exposure, whereas Skyworks presents a focused analog niche with steadier consumer demand.
Income Statement Comparison
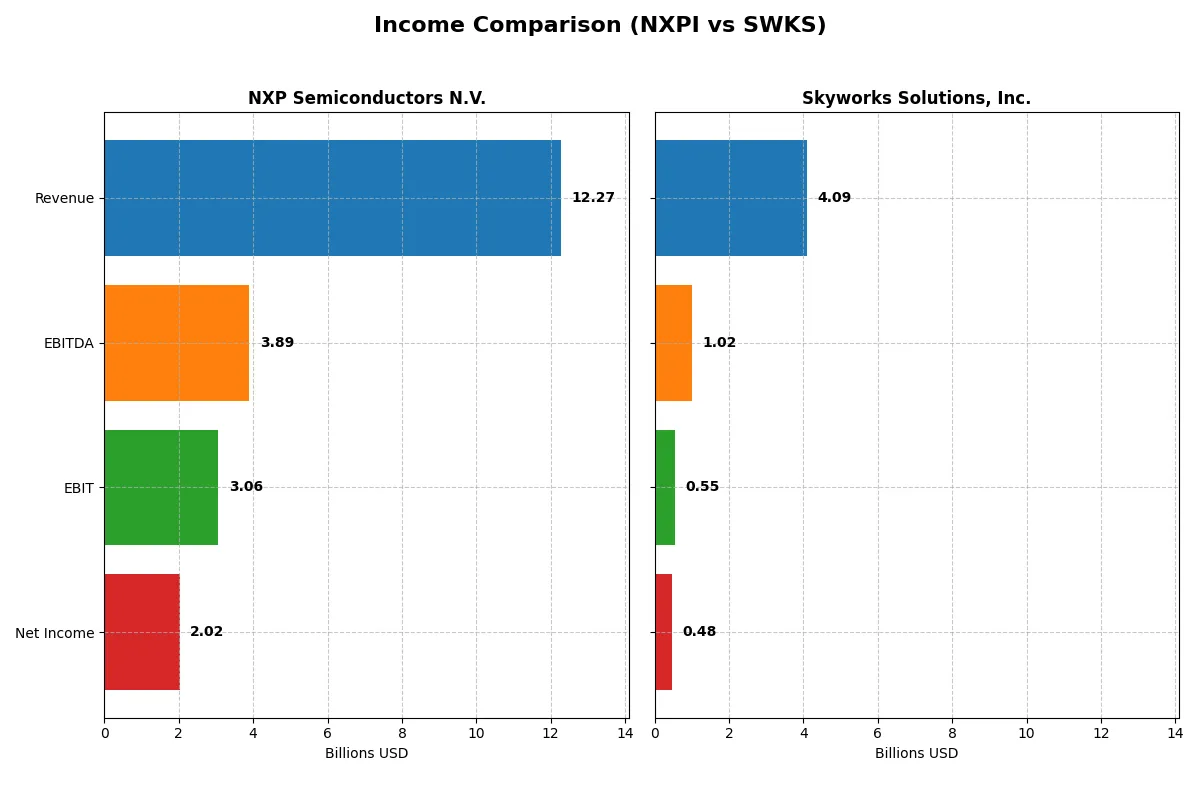
This data dissects the core profitability and scalability of both corporate engines to reveal who dominates the bottom line:
| Metric | NXP Semiconductors N.V. (NXPI) | Skyworks Solutions, Inc. (SWKS) |
|---|---|---|
| Revenue | 12.3B | 4.1B |
| Cost of Revenue | 5.6B | 2.4B |
| Operating Expenses | 3.4B | 1.2B |
| Gross Profit | 6.7B | 1.7B |
| EBITDA | 3.9B | 1.0B |
| EBIT | 3.1B | 554M |
| Interest Expense | 384M | 27M |
| Net Income | 2.0B | 477M |
| EPS | 8.00 | 3.09 |
| Fiscal Year | 2025 | 2025 |
Income Statement Analysis: The Bottom-Line Duel
This income statement comparison reveals how effectively each company converts revenue into profit, reflecting operational discipline and market positioning.
NXP Semiconductors N.V. Analysis
NXP Semiconductors shows a solid revenue growth of 10.9% over five years, despite a 2.7% dip in 2025. Net income rose 8%, though it fell 17% last year. Gross margin remains strong at 54.4%, while net margin holds at 16.5%. Recent declines signal margin pressures but overall performance stays favorable.
Skyworks Solutions, Inc. Analysis
Skyworks faces a tougher path, with revenue shrinking 20% over five years and a 2.2% dip in 2025. Net income plunged 68% overall and dropped 18% last year. Margins are thinner: gross margin at 41.2%, net margin at 11.7%. Efficiency waned in 2025, reflecting operational challenges and weaker profitability.
Margin Strength vs. Earnings Durability
NXP Semiconductors outperforms Skyworks with higher margins and steadier net income growth. While NXP’s recent margin erosion warrants caution, its revenue scale and profitability remain robust. Skyworks struggles with declining sales and profits, showing less resilience. For investors, NXP offers a more consistent earnings profile in a challenging sector.
Financial Ratios Comparison
These vital ratios act as a diagnostic tool to expose the underlying fiscal health, valuation premiums, and capital efficiency of the companies analyzed:
| Ratios | NXP Semiconductors N.V. (NXPI) | Skyworks Solutions, Inc. (SWKS) |
|---|---|---|
| ROE | 20.1% | 8.3% |
| ROIC | 11.0% | 6.4% |
| P/E | 27.1 | 24.95 |
| P/B | 5.45 | 2.07 |
| Current Ratio | 2.05 | 2.33 |
| Quick Ratio | 1.38 | 1.76 |
| D/E | 1.22 | 0.21 |
| Debt-to-Assets | 46.0% | 15.2% |
| Interest Coverage | 8.62 | 18.45 |
| Asset Turnover | 0.46 | 0.52 |
| Fixed Asset Turnover | 4.12 | 2.95 |
| Payout ratio | 50.7% | 90.7% |
| Dividend yield | 1.87% | 3.63% |
| Fiscal Year | 2025 | 2025 |
Efficiency & Valuation Duel: The Vital Signs
Financial ratios serve as a company’s DNA, unveiling hidden risks and operational strengths that shape investment decisions.
NXP Semiconductors N.V.
NXP posts a strong 20.1% ROE and a 16.47% net margin, signaling robust profitability. However, its P/E of 27.14 and P/B of 5.45 mark the stock as stretched. The company balances shareholder returns with a 1.87% dividend yield and hefty R&D reinvestment at 18.3% of revenue, fueling growth.
Skyworks Solutions, Inc.
Skyworks shows a modest 8.3% ROE and an 11.7% net margin, reflecting moderate profitability. Its P/E of 24.95 and P/B of 2.07 indicate a fairly valued stock. Skyworks rewards shareholders with a 3.63% dividend yield and maintains solid liquidity and low debt, supporting a stable financial profile.
Premium Valuation vs. Operational Safety
NXP offers superior profitability but trades at a premium with higher leverage. Skyworks provides a safer balance with lower valuation and stronger debt metrics. Investors seeking growth may favor NXP, while those prioritizing financial stability might prefer Skyworks.
Which one offers the Superior Shareholder Reward?
I compare NXP Semiconductors N.V. (NXPI) and Skyworks Solutions, Inc. (SWKS) on their 2025 shareholder distributions. NXPI yields about 1.87% with a moderate payout ratio near 51%. Its buybacks, while steady, are less intense, reflecting a balanced capital allocation between dividends and growth. SWKS offers a higher 3.63% dividend yield but with a hefty 91% payout ratio, signaling limited margin for dividend growth. Its aggressive buybacks complement this, boosting total returns. However, NXPI’s distribution is more sustainable given stronger free cash flow coverage and lower payout strain. For 2026 investors, NXPI provides a more stable and attractive total shareholder return profile, balancing income and long-term value creation better than SWKS.
Comparative Score Analysis: The Strategic Profile
The radar chart reveals the fundamental DNA and trade-offs of NXP Semiconductors and Skyworks Solutions, highlighting their strategic strengths and vulnerabilities:
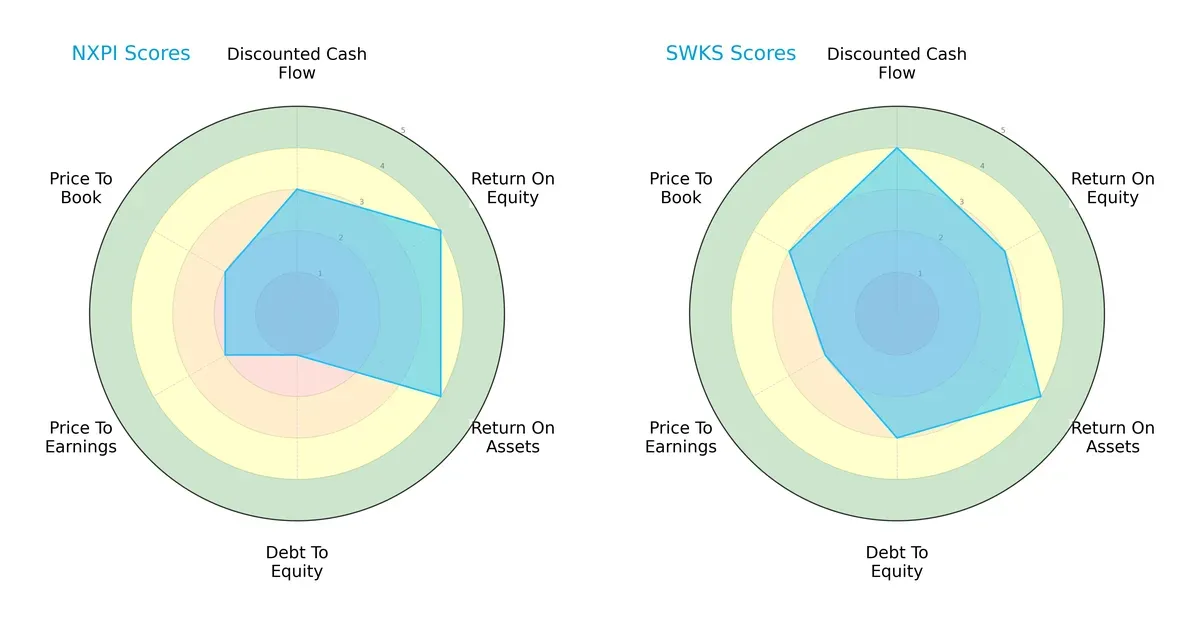
NXP shows strength in profitability with higher ROE (4) and ROA (4) scores but suffers from a very unfavorable debt-to-equity score (1). Skyworks offers a more balanced profile, scoring better in DCF (4) and debt-to-equity (3), indicating healthier financial leverage. Valuation metrics (PE/PB) are moderate for both, but Skyworks edges out slightly with a better price-to-book score.
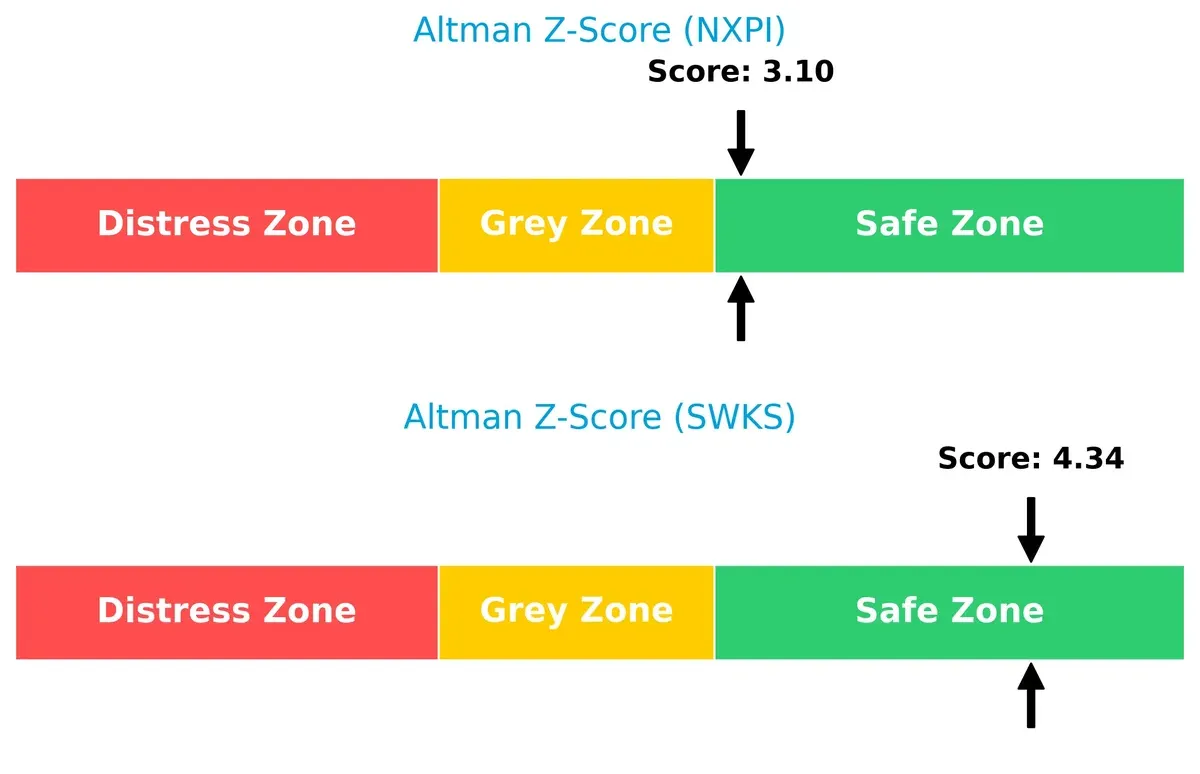
Bankruptcy Risk: Solvency Showdown
Skyworks’ Altman Z-Score of 4.34 surpasses NXP’s 3.10, both safely above the distress threshold, implying stronger long-term survival odds for Skyworks in this cycle:
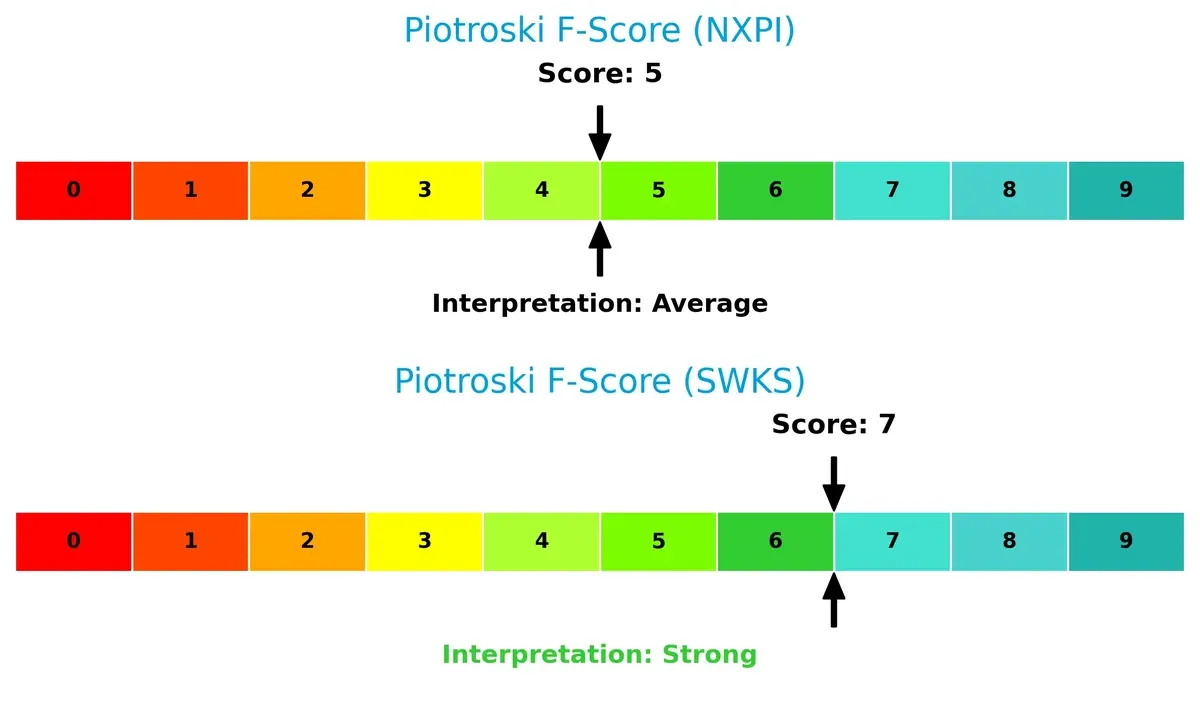
Financial Health: Quality of Operations
Skyworks leads with a Piotroski F-Score of 7, signaling strong financial health, while NXP’s 5 suggests average internal metrics and potential red flags in operational efficiency:
How are the two companies positioned?
This section dissects the operational DNA of NXP and Skyworks by comparing their revenue distribution and internal dynamics. The goal is to confront their economic moats and identify which model offers the most resilient competitive advantage today.
Revenue Segmentation: The Strategic Mix
This comparison dissects how NXP Semiconductors N.V. and Skyworks Solutions, Inc. diversify income streams and highlights their primary sector bets:
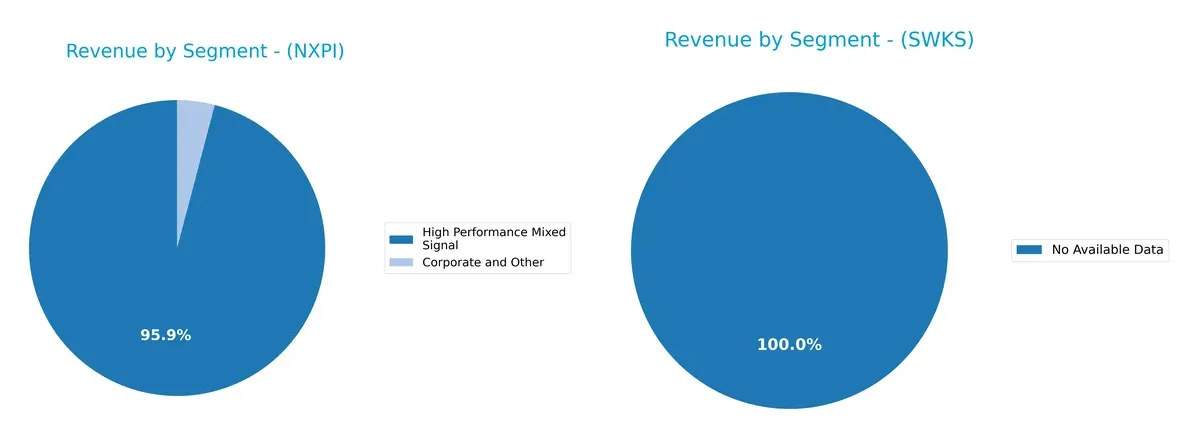
NXP Semiconductors leans heavily on High Performance Mixed Signal, with $9B in 2018 dominating its revenue. Corporate and Other segments lag far behind, showing limited diversification. Skyworks lacks sufficient data for evaluation. NXP’s reliance on one segment exposes concentration risk but also signals strong specialization and potential ecosystem lock-in in mixed signal semiconductors. Investors should weigh this focused strength against the vulnerability to market shifts in that niche.
Strengths and Weaknesses Comparison
This table compares the Strengths and Weaknesses of NXP Semiconductors and Skyworks Solutions:
NXP Semiconductors Strengths
- High profitability with 16.47% net margin
- Strong ROE at 20.1%
- Favorable liquidity ratios above 1.3
- Solid global presence with diversified geographic revenue
- High fixed asset turnover indicating efficient asset use
Skyworks Solutions Strengths
- Favorable net margin of 11.67%
- Strong liquidity with current ratio above 2.3
- Low debt-to-equity ratio at 0.21, indicating low leverage
- High interest coverage ratio of 20.44
- Higher dividend yield at 3.63%
NXP Semiconductors Weaknesses
- Elevated debt-to-equity ratio at 1.22 signals higher leverage risk
- Unfavorable valuation with PE at 27.14 and PB at 5.45
- Asset turnover is low at 0.46, indicating less efficient revenue generation
Skyworks Solutions Weaknesses
- Lower ROE at 8.29%, below sector average
- ROIC of 6.35% only neutral versus WACC
- Neutral asset turnover and fixed asset turnover ratios
Both companies show slightly favorable overall financial health but differ in capital structure and efficiency metrics. NXP excels in profitability and asset efficiency but carries more leverage risk. Skyworks demonstrates conservative leverage and liquidity but lags in return on equity and capital efficiency. These contrasts shape their strategic financial positioning in the semiconductor sector.
The Moat Duel: Analyzing Competitive Defensibility
A structural moat is the only true defense against profit erosion from competition over the long term. Let’s dissect how these two semiconductor players fare:
NXP Semiconductors N.V.: Intangible Assets & Diversified End Markets
NXP’s moat stems from proprietary microcontrollers and wireless connectivity tech. This shows in stable 54% gross margins and 16% net margins, despite recent revenue softness. Expansion into automotive and IoT markets in 2026 could deepen its competitive edge.
Skyworks Solutions, Inc.: Cost Advantage & Focused Wireless Solutions
Skyworks relies on cost-effective manufacturing and specialized analog chips, mainly for wireless communications in the U.S. Its 41% gross margin and declining revenue signal pressure. Opportunities in 5G and automotive could disrupt or boost its position.
Moat Strength: Intangible Assets vs. Cost Discipline
NXP holds a wider moat with superior margin stability and diverse markets. Skyworks’ narrower moat faces sharper profitability declines. I see NXP better equipped to defend and grow its market share in 2026.
Which stock offers better returns?
Over the past year, both NXP Semiconductors and Skyworks Solutions faced significant price declines, with notable volatility and shifting buyer-seller dynamics in recent months.
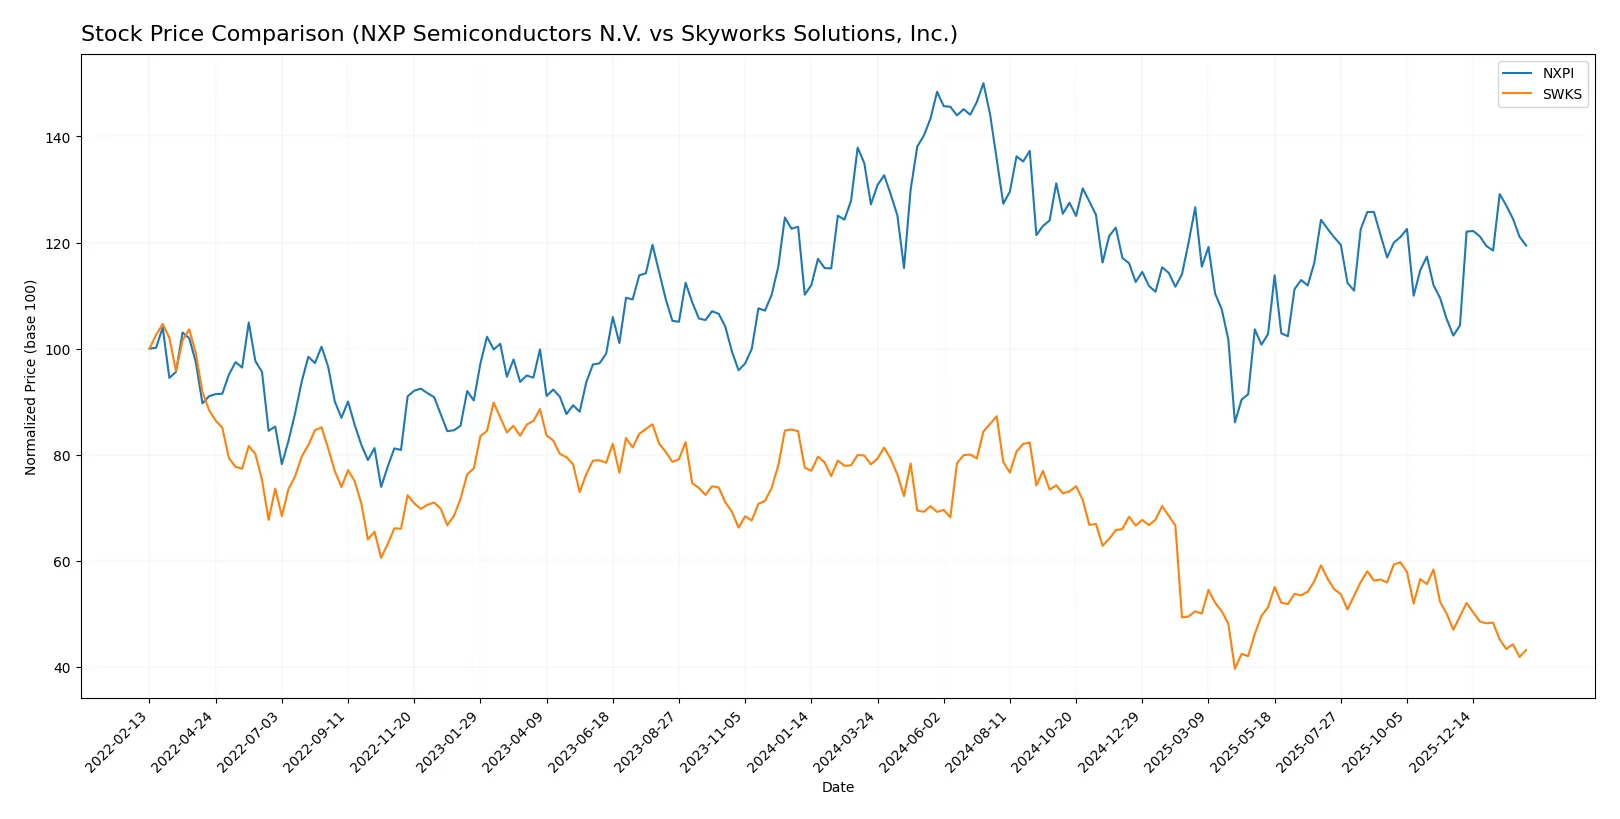
Trend Comparison
NXP Semiconductors shows a 6.11% price decline over the past 12 months, marking a bearish trend with accelerating downward momentum and high volatility. Recent months reversed this with a 16.55% gain.
Skyworks Solutions experienced a steep 44.72% price drop over 12 months, indicating a bearish trend but decelerating loss. The recent trend worsened with an 8.11% decline.
NXP’s recent recovery contrasts with Skyworks’ persistent decline, making NXP the stronger performer over the past year despite both stocks’ overall bearish trends.
Target Prices
Analysts present mixed but generally optimistic target prices for NXP Semiconductors and Skyworks Solutions.
| Company | Target Low | Target High | Consensus |
|---|---|---|---|
| NXP Semiconductors N.V. | 215 | 280 | 250 |
| Skyworks Solutions, Inc. | 58 | 140 | 77.36 |
NXP’s consensus target of 250 exceeds its current 223 price, suggesting upside potential. Skyworks’ target consensus at 77.36 also implies significant appreciation from its 57.68 price.

Don’t Let Luck Decide Your Entry Point
Optimize your entry points with our advanced ProRealTime indicators. You’ll get efficient buy signals with precise price targets for maximum performance. Start outperforming now!
How do institutions grade them?
NXP Semiconductors N.V. Grades
The following table shows recent grades from reputable institutions for NXP Semiconductors N.V.:
| Grading Company | Action | New Grade | Date |
|---|---|---|---|
| Evercore ISI Group | Maintain | Outperform | 2026-02-04 |
| B of A Securities | Maintain | Buy | 2026-02-04 |
| Truist Securities | Maintain | Buy | 2026-02-04 |
| Mizuho | Maintain | Outperform | 2026-02-04 |
| Citigroup | Maintain | Buy | 2026-02-04 |
| JP Morgan | Maintain | Neutral | 2026-02-04 |
| Needham | Maintain | Buy | 2026-02-03 |
| Citigroup | Maintain | Buy | 2026-01-15 |
| Wells Fargo | Maintain | Overweight | 2026-01-15 |
| Truist Securities | Maintain | Buy | 2025-12-19 |
Skyworks Solutions, Inc. Grades
Below are recent institutional grades for Skyworks Solutions, Inc.:
| Grading Company | Action | New Grade | Date |
|---|---|---|---|
| Stifel | Maintain | Hold | 2026-02-04 |
| Keybanc | Maintain | Overweight | 2026-02-04 |
| JP Morgan | Maintain | Neutral | 2026-02-04 |
| Benchmark | Maintain | Hold | 2026-02-04 |
| Morgan Stanley | Maintain | Equal Weight | 2026-02-02 |
| Mizuho | Maintain | Neutral | 2026-01-26 |
| B. Riley Securities | Maintain | Neutral | 2026-01-26 |
| Susquehanna | Maintain | Neutral | 2026-01-22 |
| UBS | Maintain | Neutral | 2026-01-20 |
| Mizuho | Upgrade | Neutral | 2025-11-11 |
Which company has the best grades?
NXP Semiconductors consistently receives buy and outperform ratings from multiple top firms. Skyworks Solutions holds mostly neutral to hold ratings. Investors may view NXP as more favorably positioned based on these grades.
Risks specific to each company
The following categories highlight critical pressure points and systemic threats facing NXP Semiconductors N.V. and Skyworks Solutions, Inc. in the 2026 market environment:
1. Market & Competition
NXP Semiconductors N.V.
- Faces intense competition in automotive and IoT markets, requiring constant innovation to maintain share.
Skyworks Solutions, Inc.
- Competes across diverse end markets including aerospace and mobile, needing broad product adaptability.
2. Capital Structure & Debt
NXP Semiconductors N.V.
- High debt-to-equity ratio (1.22) raises financial risk despite solid interest coverage.
Skyworks Solutions, Inc.
- Low debt-to-equity (0.21) supports financial flexibility and reduces refinancing risk.
3. Stock Volatility
NXP Semiconductors N.V.
- Beta of 1.46 indicates higher volatility, increasing market risk exposure.
Skyworks Solutions, Inc.
- Beta of 1.32 suggests moderately lower volatility, offering relative stability.
4. Regulatory & Legal
NXP Semiconductors N.V.
- Global operations expose it to complex regulations, especially in China and EU markets.
Skyworks Solutions, Inc.
- U.S.-based with significant international sales, subject to export controls and compliance risks.
5. Supply Chain & Operations
NXP Semiconductors N.V.
- Complex global supply chain vulnerable to semiconductor shortages and geopolitical disruptions.
Skyworks Solutions, Inc.
- Diverse manufacturing footprint mitigates localized supply risks but remains subject to global chip demand swings.
6. ESG & Climate Transition
NXP Semiconductors N.V.
- Increasing pressure to align with EU climate policies may raise compliance costs.
Skyworks Solutions, Inc.
- Faces rising ESG demands from US and global clients, impacting operational and reputational risk.
7. Geopolitical Exposure
NXP Semiconductors N.V.
- Significant China exposure heightens vulnerability to trade tensions and sanctions risks.
Skyworks Solutions, Inc.
- U.S. headquarters and supply chains face risks from evolving trade policies and international conflicts.
Which company shows a better risk-adjusted profile?
NXP’s most impactful risk is its elevated debt load, which contrasts with Skyworks’ stronger balance sheet. Both face geopolitical and regulatory challenges, but Skyworks’ lower leverage and higher Altman Z-Score (4.34 vs. 3.10) suggest superior financial resilience. Notably, Skyworks’ Piotroski Score of 7 indicates stronger operational health, reinforcing its better risk-adjusted stance.
Final Verdict: Which stock to choose?
NXP Semiconductors N.V. (NXPI) stands out as a cash-generating powerhouse with solid returns on equity and invested capital. Its main point of vigilance is a relatively high debt load that could pressure financial flexibility. NXPI fits well in aggressive growth portfolios seeking exposure to efficient capital deployment.
Skyworks Solutions, Inc. (SWKS) leverages a strategic moat built on recurring revenue and a strong balance sheet with low leverage. It offers better financial safety than NXPI but struggles with declining profitability. SWKS suits investors favoring GARP (Growth at a Reasonable Price) profiles who value stability alongside growth potential.
If you prioritize robust capital efficiency and higher returns, NXPI is the compelling choice due to its superior cash flow generation despite leverage concerns. However, if you seek a more conservative approach with a quality moat and balance sheet strength, SWKS offers better stability at a more reasonable valuation. Both carry risks amid sector headwinds, so align your pick with your risk tolerance and investment horizon.
Disclaimer: Investment carries a risk of loss of initial capital. The past performance is not a reliable indicator of future results. Be sure to understand risks before making an investment decision.
Go Further
I encourage you to read the complete analyses of NXP Semiconductors N.V. and Skyworks Solutions, Inc. to enhance your investment decisions: