Home > Comparison > Technology > NXPI vs SKYT
The strategic rivalry between NXP Semiconductors N.V. and SkyWater Technology, Inc. shapes the semiconductor sector’s evolution. NXP operates as a global technology leader with a broad portfolio spanning microcontrollers and wireless solutions, while SkyWater focuses on specialized semiconductor manufacturing services. This contrast highlights a battle between scale-driven innovation and agile contract manufacturing. This analysis will clarify which approach delivers superior risk-adjusted returns for a diversified technology portfolio.
Table of contents
Companies Overview
NXP Semiconductors and SkyWater Technology dominate distinct segments of the semiconductor industry with contrasting scales and strategies.
NXP Semiconductors N.V.: Global Semiconductor Powerhouse
NXP Semiconductors commands a leading position in automotive, industrial, and IoT chips. Its core revenue derives from microcontrollers, processors, and wireless connectivity solutions. In 2026, NXP focuses on expanding its product portfolio in secure and high-performance applications to meet growing demand across automotive and communication infrastructure.
SkyWater Technology, Inc.: Specialized Semiconductor Manufacturer
SkyWater Technology operates as a niche semiconductor foundry offering development and manufacturing services. It generates revenue by co-creating technologies and producing analog, mixed-signal, and rad-hard integrated circuits. Its strategic priority centers on deepening customer collaboration in aerospace, defense, and bio-health sectors to carve specialized market positions.
Strategic Collision: Similarities & Divergences
While both serve semiconductor markets, NXP pursues a broad product strategy with a closed ecosystem focus, contrasting with SkyWater’s open, service-driven foundry model. Their competition primarily unfolds in specialized chip applications, where innovation and customization are critical. This creates distinct investment profiles: NXP as a mature tech giant with scale advantages, SkyWater as a high-beta, growth-oriented foundry player.
Income Statement Comparison
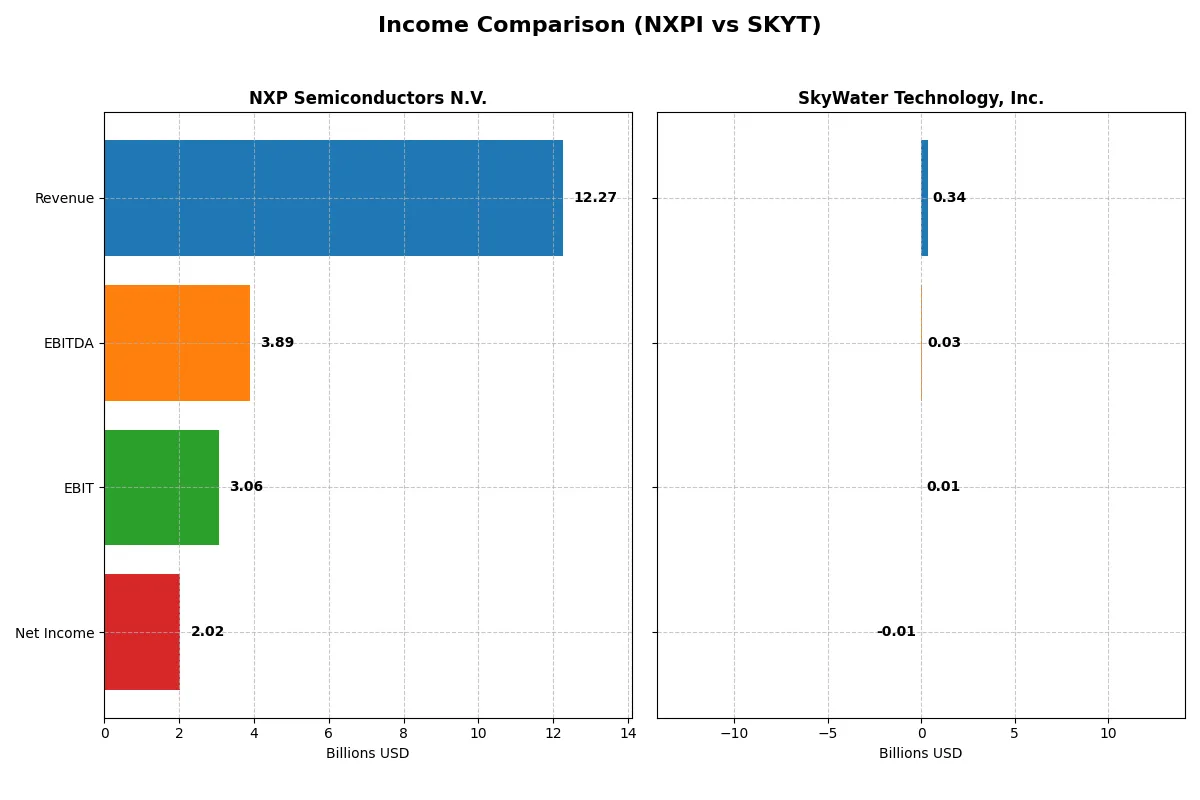
This data dissects the core profitability and scalability of both corporate engines to reveal who dominates the bottom line:
| Metric | NXP Semiconductors N.V. (NXPI) | SkyWater Technology, Inc. (SKYT) |
|---|---|---|
| Revenue | 12.3B | 342M |
| Cost of Revenue | 5.6B | 273M |
| Operating Expenses | 3.4B | 63M |
| Gross Profit | 6.7B | 70M |
| EBITDA | 3.9B | 25M |
| EBIT | 3.1B | 7M |
| Interest Expense | 384M | 9M |
| Net Income | 2.0B | -7M |
| EPS | 8.00 | -0.14 |
| Fiscal Year | 2025 | 2024 |
Income Statement Analysis: The Bottom-Line Duel
This income statement comparison uncovers which company drives superior operational efficiency and bottom-line profitability.
NXP Semiconductors N.V. Analysis
NXP’s revenue shows a modest 10.9% growth over five years but declined 2.74% in 2025, signaling recent headwinds. Net income rose 8.02% overall but fell 17.22% last year to $2B. The company posts a robust 54.4% gross margin and 16.5% net margin, underscoring strong cost control despite a slight margin contraction.
SkyWater Technology, Inc. Analysis
SkyWater’s revenue surged 143.7% over five years, with a 19.4% increase in 2024, reflecting rapid expansion. Despite posting a small gross margin of 20.3%, it improved EBIT margin to just under 2% and narrowed net losses to -$6.8M. SkyWater’s accelerated earnings growth signals improving operational leverage but still posts negative net income.
Margin Strength vs. Growth Momentum
NXP delivers superior profitability and margin stability, generating large, positive net income with healthy returns on sales. SkyWater exhibits remarkable top-line momentum and margin improvement but remains unprofitable. For investors prioritizing consistent earnings and margin quality, NXP stands out. SkyWater appeals more to those willing to tolerate losses for high growth potential.
Financial Ratios Comparison
These vital ratios act as a diagnostic tool to expose the underlying fiscal health, valuation premiums, and capital efficiency of the companies compared below:
| Ratios | NXP Semiconductors N.V. (NXPI) | SkyWater Technology, Inc. (SKYT) |
|---|---|---|
| ROE | 20.1% | -11.8% |
| ROIC | 11.0% | 3.4% |
| P/E | 27.1 | -100.3 |
| P/B | 5.45 | 11.82 |
| Current Ratio | 2.05 | 0.86 |
| Quick Ratio | 1.38 | 0.76 |
| D/E (Debt to Equity) | 1.22 | 1.33 |
| Debt-to-Assets | 46.0% | 24.5% |
| Interest Coverage | 8.62 | 0.74 |
| Asset Turnover | 0.46 | 1.09 |
| Fixed Asset Turnover | 4.12 | 2.07 |
| Payout ratio | 50.7% | 0% |
| Dividend yield | 1.87% | 0% |
| Fiscal Year | 2025 | 2024 |
Efficiency & Valuation Duel: The Vital Signs
Financial ratios serve as a company’s DNA, uncovering hidden risks and operational strengths that influence investment decisions.
NXP Semiconductors N.V.
NXP Semiconductors delivers robust profitability with a 20.1% ROE and 16.47% net margin, showcasing operational efficiency. The stock trades at a stretched 27.14 P/E and 5.45 P/B, indicating premium valuation. Shareholders benefit from a 1.87% dividend yield, reflecting a balanced capital allocation between returns and R&D investments.
SkyWater Technology, Inc.
SkyWater struggles with negative profitability metrics: -11.79% ROE and -1.98% net margin reveal operational challenges. The P/E ratio is negative but flagged favorable due to losses. Low current and quick ratios (0.86, 0.76) signal liquidity risks. SkyWater reinvests heavily in growth, lacking dividends or buybacks, which increases risk but targets long-term expansion.
Premium Valuation vs. Operational Struggles
NXP stands out with strong profitability and a moderate dividend, despite a premium valuation. SkyWater’s metrics highlight operational and liquidity weaknesses, with a focus on reinvestment over shareholder returns. Investors seeking stable income and efficiency may prefer NXP, while risk-tolerant growth seekers might consider SkyWater’s profile.
Which one offers the Superior Shareholder Reward?
I compare NXP Semiconductors (NXPI) and SkyWater Technology (SKYT) on dividends, payout ratios, and buybacks. NXPI yields 1.9% with a sustainable 50.7% payout ratio, backed by strong free cash flow of 9.6B. SKYT pays no dividend, focusing on reinvestment amid losses. NXPI’s steady buyback program supports total returns; SKYT lacks buybacks, reflecting riskier capital allocation. NXPI’s disciplined distribution and robust margins offer superior, sustainable shareholder rewards in 2026.
Comparative Score Analysis: The Strategic Profile
The radar chart reveals the fundamental DNA and trade-offs of NXP Semiconductors N.V. and SkyWater Technology, Inc., highlighting their strategic strengths and vulnerabilities:
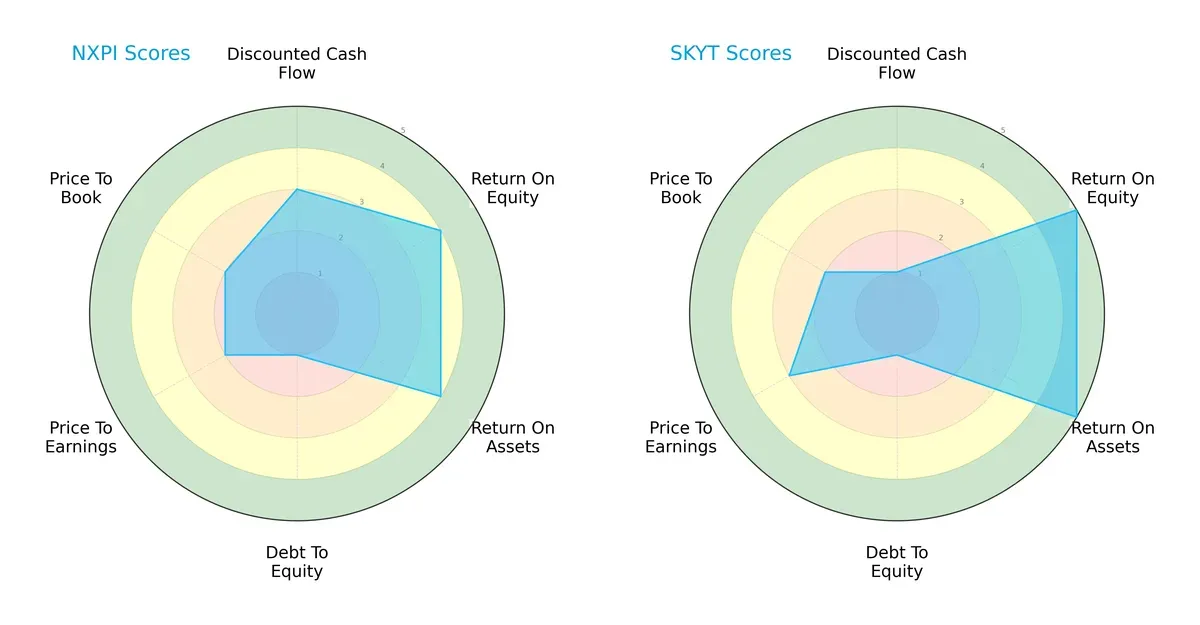
NXP shows balanced strength in ROE (4) and ROA (4), signaling efficient asset and equity use. SkyWater leads in profitability metrics with ROE (5) and ROA (5) but lags in discounted cash flow (1). Both share weak debt-to-equity scores (1), indicating financial leverage risk. NXP’s valuation scores (P/E 2, P/B 2) suggest moderate market pricing, while SkyWater’s P/E score (3) hints at slightly better valuation. NXP’s profile is balanced; SkyWater relies on operational efficiency as its edge.
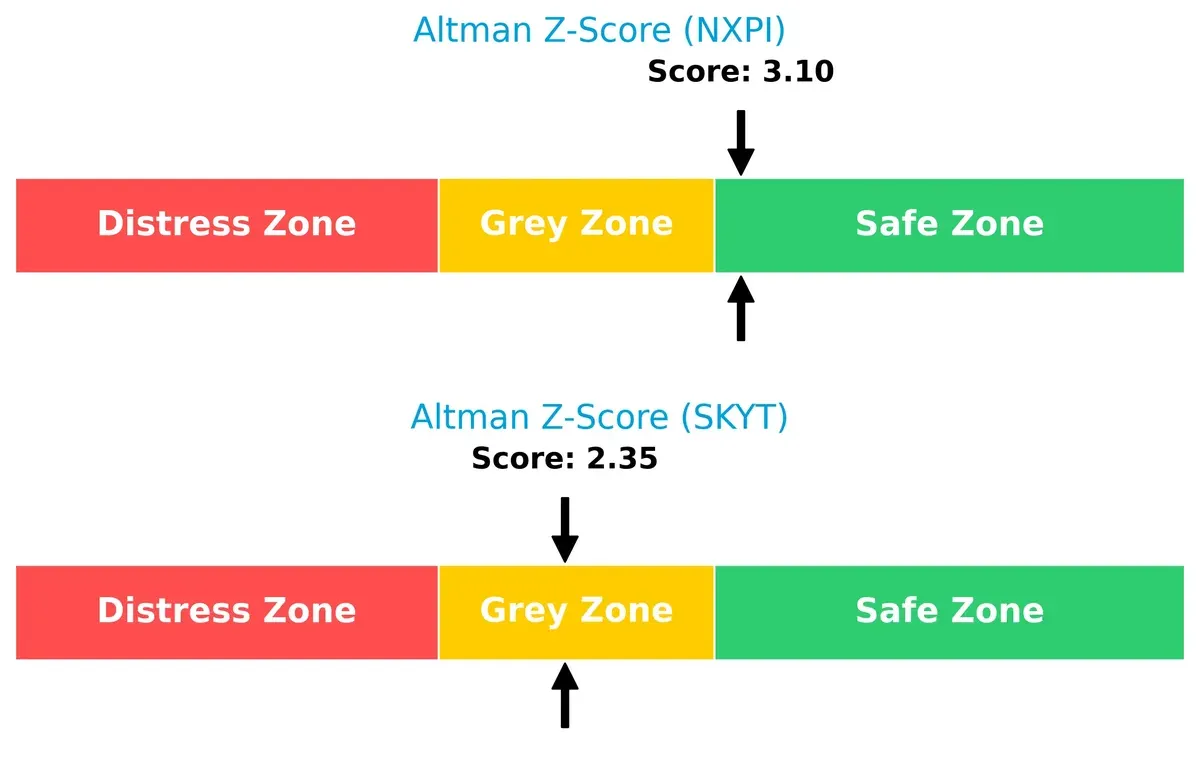
Bankruptcy Risk: Solvency Showdown
NXP’s Altman Z-Score of 3.10 places it safely above bankruptcy risk, while SkyWater’s 2.35 signals moderate distress risk in this cycle:
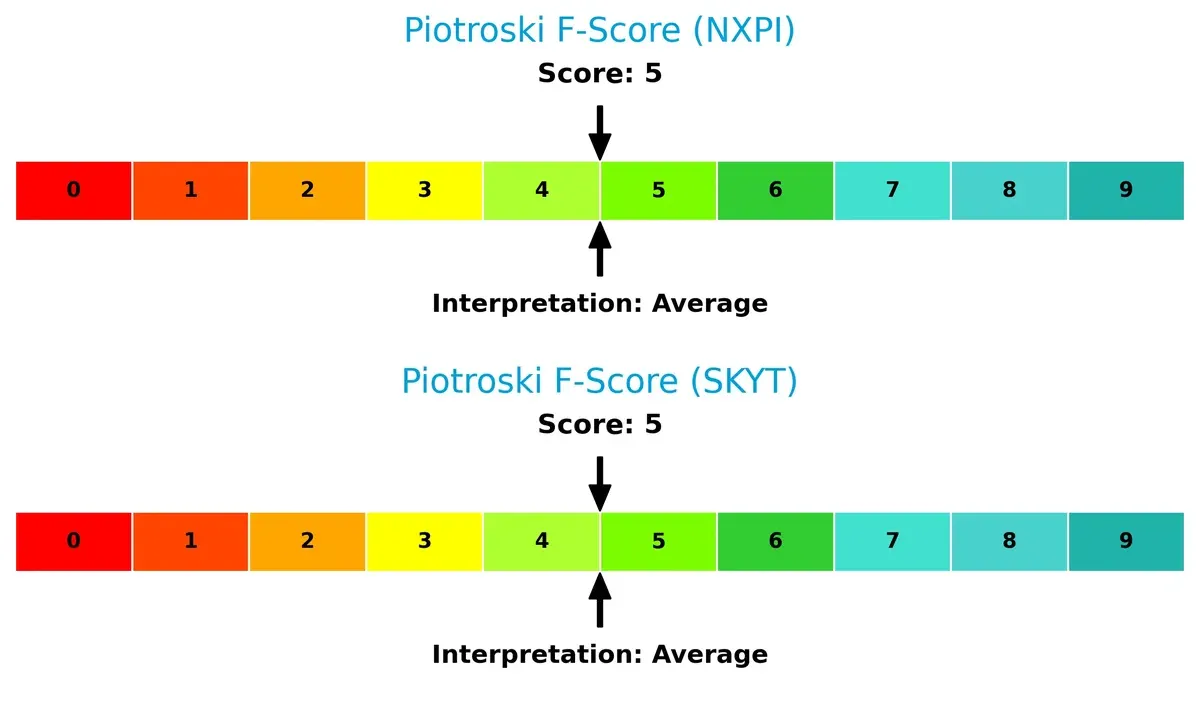
Financial Health: Quality of Operations
Both firms share a Piotroski F-Score of 5, reflecting average financial health with no clear red flags in internal metrics:
How are the two companies positioned?
This section dissects the operational DNA of NXPI and SKYT by comparing their revenue distribution and internal dynamics. The goal is to confront their economic moats to identify the more resilient competitive advantage.
Revenue Segmentation: The Strategic Mix
This side-by-side comparison dissects how NXP Semiconductors N.V. and SkyWater Technology, Inc. diversify their income streams and where their primary sector bets lie:
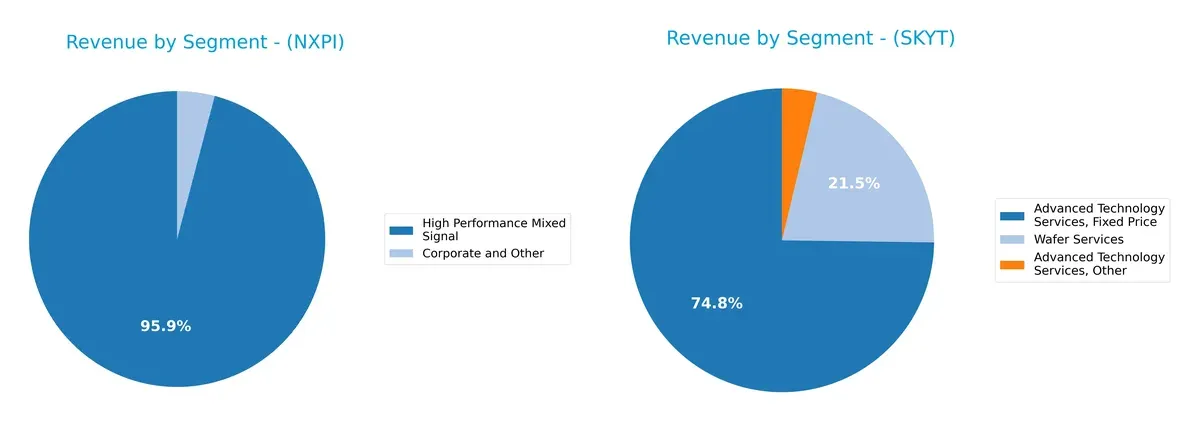
NXP Semiconductors anchors its revenue on High Performance Mixed Signal, generating $9B in 2018 and dwarfing other segments like Corporate and Other at $385M. SkyWater shows a more diversified mix, splitting revenue between Advanced Technology Services and Wafer Services, with no single segment dominating overwhelmingly. NXP’s concentration signals strong ecosystem lock-in but also higher concentration risk, while SkyWater’s spread suggests flexibility but less scale dominance.
Strengths and Weaknesses Comparison
This table compares the Strengths and Weaknesses of NXP Semiconductors N.V. and SkyWater Technology, Inc.:
NXP Semiconductors N.V. Strengths
- Strong profitability with 16.47% net margin and 20.1% ROE
- Favorable liquidity ratios: current ratio 2.05, quick ratio 1.38
- High fixed asset turnover at 4.12
- Global presence with diversified geographic revenue including China, US, and Europe
SkyWater Technology, Inc. Strengths
- Favorable asset turnover at 1.09 supports efficient use of assets
- Low debt-to-assets ratio at 24.46% indicates conservative leverage
- Favorable P/E ratio reflecting market valuation
- Geographic focus on US market with growing revenue
NXP Semiconductors N.V. Weaknesses
- Elevated debt-to-equity at 1.22 and high P/B ratio of 5.45 pose valuation and leverage concerns
- Unfavorable asset turnover at 0.46 suggests room for operational efficiency improvement
- P/E ratio at 27.14 considered high relative to earnings
- Significant exposure to China market could add geopolitical risk
SkyWater Technology, Inc. Weaknesses
- Negative profitability metrics: net margin -1.98%, ROE -11.79%, and low ROIC at 3.4%
- Weak liquidity with current ratio 0.86 and quick ratio 0.76
- High WACC at 19.94% increases capital cost
- Low interest coverage at 0.74 signals financial stress
- Lack of dividend yield limits income appeal
The assessment highlights NXP’s strong profitability and global reach balanced against leverage and valuation concerns. SkyWater’s strengths in asset use and conservative debt are overshadowed by profitability and liquidity weaknesses. Both companies face strategic challenges tied to their financial health and market positioning.
The Moat Duel: Analyzing Competitive Defensibility
A structural moat is the only reliable shield protecting long-term profits from relentless competitive erosion. Let’s dissect these companies’ moats:
NXP Semiconductors N.V.: Intangible Assets and Scale Moat
NXP leverages strong intangible assets and global scale, reflected in stable margins near 25% EBIT. Yet, declining ROIC signals rising competitive pressures in 2026.
SkyWater Technology, Inc.: Niche Cost Advantage and Innovation
SkyWater’s moat stems from specialized manufacturing capabilities with a rising ROIC trend, contrasting NXP’s decline. Its growth trajectory suggests expanding market footholds in 2026.
Scale and Innovation: The Moat Showdown
NXP’s wider moat benefits from scale and brand, but shrinking returns raise caution. SkyWater’s narrower, innovation-driven moat deepens with improving profitability. I see SkyWater better positioned to defend and grow its niche share.
Which stock offers better returns?
The past year reveals stark contrasts: NXP Semiconductors N.V. retreats with accelerating losses, while SkyWater Technology, Inc. surges on strong gains and buyer dominance.
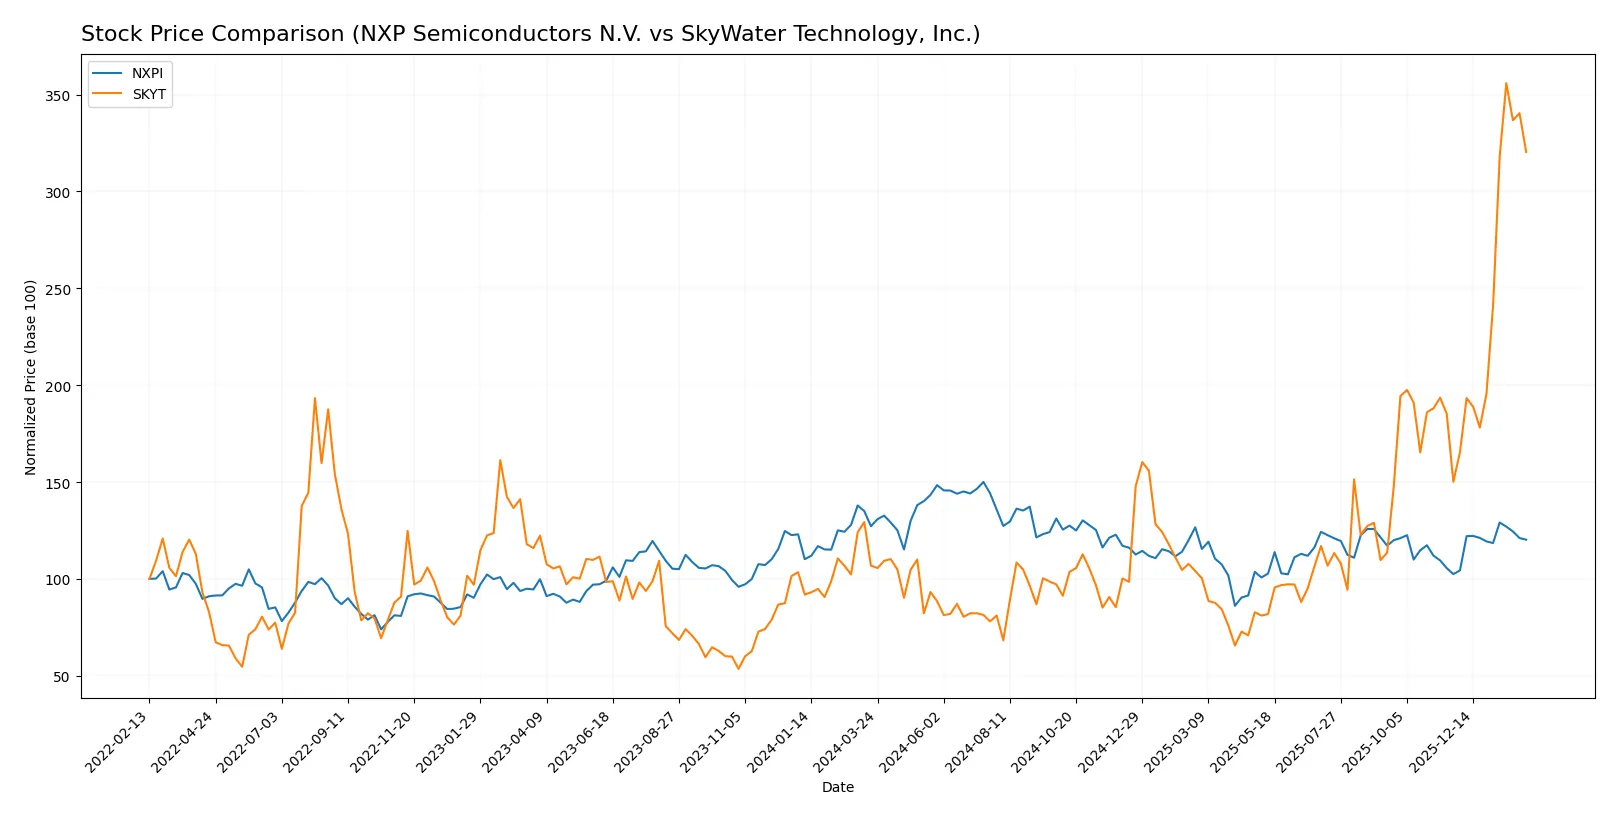
Trend Comparison
NXP Semiconductors N.V. shows a bearish trend with a -5.46% price decline over 12 months, hitting a low of 160.81 and accelerating downward despite recent short-term gains. SkyWater Technology, Inc. displays a robust bullish trend, rising 199.8% over the same period with steady acceleration and low volatility, peaking at 33.1. Comparing both, SkyWater Technology, Inc. outperforms clearly, delivering significantly higher market returns throughout the year.
Target Prices
Analysts present a positive target consensus for NXP Semiconductors N.V. and SkyWater Technology, Inc.
| Company | Target Low | Target High | Consensus |
|---|---|---|---|
| NXP Semiconductors N.V. | 215 | 280 | 250 |
| SkyWater Technology, Inc. | 35 | 35 | 35 |
The consensus target for NXP at 250 suggests upside from the current 224 price, reflecting confidence in its semiconductor leadership. SkyWater’s flat 35 target implies limited near-term growth expectations versus its 29.8 price.

Don’t Let Luck Decide Your Entry Point
Optimize your entry points with our advanced ProRealTime indicators. You’ll get efficient buy signals with precise price targets for maximum performance. Start outperforming now!
How do institutions grade them?
NXP Semiconductors N.V. Grades
The following table summarizes recent institutional grades for NXP Semiconductors N.V.:
| Grading Company | Action | New Grade | Date |
|---|---|---|---|
| Evercore ISI Group | maintain | Outperform | 2026-02-04 |
| B of A Securities | maintain | Buy | 2026-02-04 |
| Truist Securities | maintain | Buy | 2026-02-04 |
| Mizuho | maintain | Outperform | 2026-02-04 |
| Citigroup | maintain | Buy | 2026-02-04 |
| JP Morgan | maintain | Neutral | 2026-02-04 |
| Needham | maintain | Buy | 2026-02-03 |
| Citigroup | maintain | Buy | 2026-01-15 |
| Wells Fargo | maintain | Overweight | 2026-01-15 |
| Truist Securities | maintain | Buy | 2025-12-19 |
SkyWater Technology, Inc. Grades
The following table summarizes recent institutional grades for SkyWater Technology, Inc.:
| Grading Company | Action | New Grade | Date |
|---|---|---|---|
| TD Cowen | downgrade | Hold | 2026-01-27 |
| Piper Sandler | downgrade | Neutral | 2026-01-27 |
| Needham | downgrade | Hold | 2026-01-27 |
| TD Cowen | maintain | Buy | 2025-11-06 |
| Needham | maintain | Buy | 2025-11-06 |
| Piper Sandler | maintain | Overweight | 2025-11-06 |
| Needham | maintain | Buy | 2025-08-07 |
| Needham | maintain | Buy | 2025-05-08 |
| Needham | maintain | Buy | 2025-02-27 |
| Needham | maintain | Buy | 2024-11-11 |
Which company has the best grades?
NXP Semiconductors consistently holds higher grades such as Outperform and Buy, while SkyWater Technology recently faced downgrades to Hold and Neutral. This divergence signals stronger institutional confidence in NXP, potentially impacting investor sentiment and portfolio positioning.
Risks specific to each company
The following categories identify the critical pressure points and systemic threats facing both firms in the 2026 market environment:
1. Market & Competition
NXP Semiconductors N.V.
- Established global player with diversified product portfolio faces intense semiconductor rivalry.
SkyWater Technology, Inc.
- Smaller, niche manufacturer struggles against dominant industry incumbents and rapid innovation cycles.
2. Capital Structure & Debt
NXP Semiconductors N.V.
- Moderate debt-to-equity ratio (1.22) signals manageable leverage but warrants monitoring.
SkyWater Technology, Inc.
- High debt-to-equity (1.33) and weak interest coverage (0.74) pose significant refinancing risks.
3. Stock Volatility
NXP Semiconductors N.V.
- Beta of 1.46 implies above-market volatility but aligns with sector norms.
SkyWater Technology, Inc.
- Beta of 3.51 indicates extreme price swings, increasing investment risk.
4. Regulatory & Legal
NXP Semiconductors N.V.
- Operates globally, exposed to diverse regulatory regimes increasing compliance complexity.
SkyWater Technology, Inc.
- Primarily US-focused but faces stringent aerospace and defense regulations.
5. Supply Chain & Operations
NXP Semiconductors N.V.
- Large, diversified supply chain benefits from scale but remains vulnerable to geopolitical disruptions.
SkyWater Technology, Inc.
- Smaller footprint heightens operational risk and supplier dependency.
6. ESG & Climate Transition
NXP Semiconductors N.V.
- Advanced ESG programs but semiconductor sector faces scrutiny over energy consumption.
SkyWater Technology, Inc.
- Early-stage ESG efforts with higher exposure to regulatory shifts on sustainability.
7. Geopolitical Exposure
NXP Semiconductors N.V.
- Significant China and Asia-Pacific exposure risks amid ongoing trade tensions.
SkyWater Technology, Inc.
- US-centric operations reduce global geopolitical risk but limit market diversification.
Which company shows a better risk-adjusted profile?
NXP Semiconductors’ main risk lies in geopolitical exposure and elevated valuation multiples, yet it maintains financial stability and operational scale. SkyWater’s critical threat is its fragile capital structure combined with extreme stock volatility, limiting resilience. I see NXP offering a superior risk-adjusted profile supported by a safe Altman Z-score (3.1) versus SkyWater’s grey zone (2.35). This margin underscores NXP’s relative stability amid industry cyclicality.
Final Verdict: Which stock to choose?
NXP Semiconductors N.V. (NXPI) excels as a mature cash generator with a solid balance sheet and reliable profitability. Its main point of vigilance lies in a gradually declining return on invested capital, hinting at emerging competitive pressures. NXPI fits well in a portfolio seeking steady income with moderate growth exposure.
SkyWater Technology, Inc. (SKYT) offers a compelling growth story fueled by improving profitability and accelerating revenue expansion. Its strategic moat is nascent but emerging through operational scale and niche manufacturing capabilities. Compared to NXPI, SKYT carries higher risk but might appeal to growth investors seeking early-stage opportunities.
If you prioritize stable cash flow and a proven track record, NXPI outshines as the compelling choice due to its financial resilience and dividend profile. However, if you seek aggressive growth and can tolerate volatility, SKYT offers better upside potential with its accelerating operating metrics. Both present analytical scenarios for distinct investor profiles focused on either safety or growth.
Disclaimer: Investment carries a risk of loss of initial capital. The past performance is not a reliable indicator of future results. Be sure to understand risks before making an investment decision.
Go Further
I encourage you to read the complete analyses of NXP Semiconductors N.V. and SkyWater Technology, Inc. to enhance your investment decisions: