Home > Comparison > Technology > NXPI vs SLAB
The strategic rivalry between NXP Semiconductors N.V. and Silicon Laboratories Inc. shapes the semiconductor sector’s innovation frontier. NXP operates as a diversified, capital-intensive semiconductor giant with a broad product portfolio spanning automotive to IoT. Silicon Labs, a nimble fabless player, focuses on analog-intensive mixed-signal solutions for industrial and consumer IoT. This analysis will determine which company’s operational model offers superior risk-adjusted returns for a diversified technology portfolio.
Table of contents
Companies Overview
NXP Semiconductors and Silicon Laboratories dominate key niches within the semiconductor industry, shaping IoT and automotive tech evolution.
NXP Semiconductors N.V.: Global Leader in Automotive and IoT Chips
NXP Semiconductors thrives as a major semiconductor manufacturer with a diverse product portfolio. Its revenue stems from microcontrollers, application processors, and wireless connectivity solutions. In 2026, NXP prioritizes expanding automotive and industrial IoT markets, leveraging advanced sensor and security controller technologies to solidify its competitive advantage.
Silicon Laboratories Inc.: Specialist in Analog Mixed-Signal Solutions
Silicon Laboratories excels as a fabless semiconductor innovator, focusing on analog-intensive mixed-signal products. Its core revenue comes from wireless microcontrollers and sensors tailored for IoT applications. In 2026, Silicon Labs advances its strategy to enhance product integration for smart home, industrial automation, and medical markets, aiming to broaden its direct sales and distribution footprint.
Strategic Collision: Similarities & Divergences
Both companies emphasize IoT but diverge in scope: NXP pursues a broad hardware ecosystem while Silicon Labs targets niche analog integration. The battleground lies in connected devices for industrial and consumer applications. NXP offers scale and diversification; Silicon Labs delivers specialized solutions. Their distinct investment profiles reflect a choice between robust market presence and focused innovation.
Income Statement Comparison
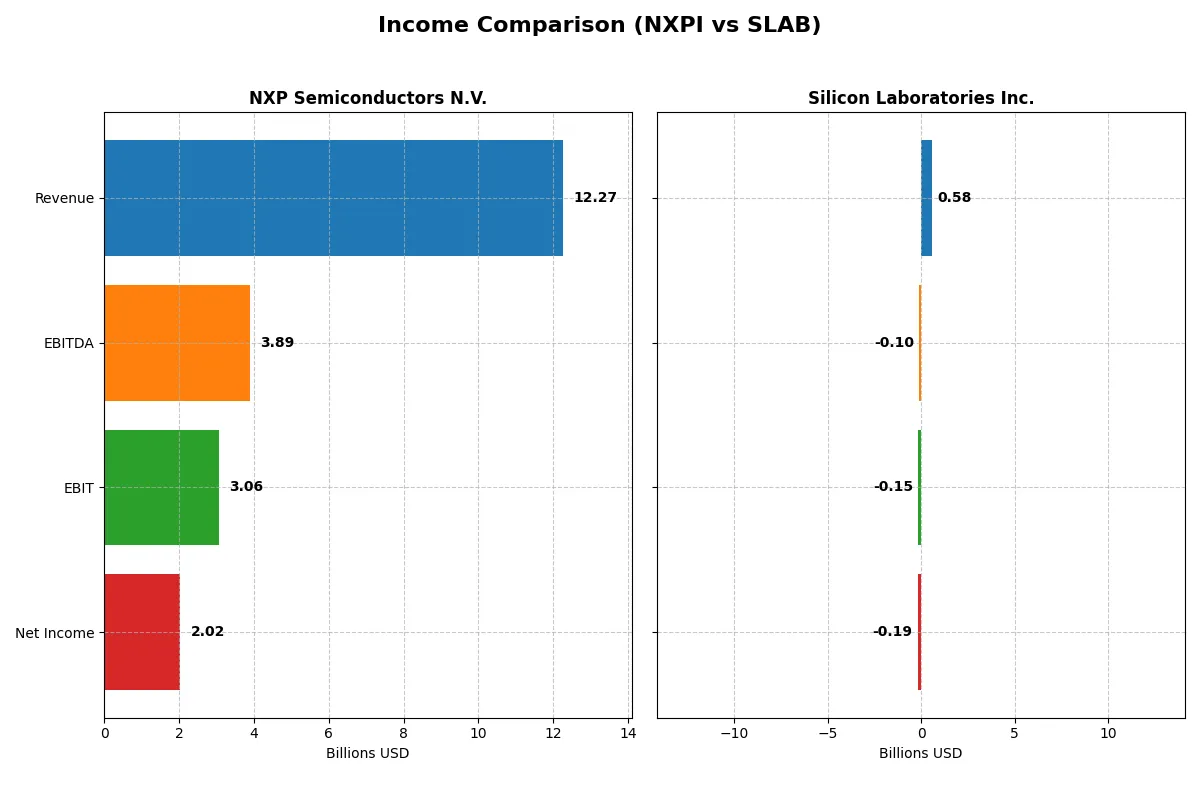
This data dissects the core profitability and scalability of both corporate engines to reveal who dominates the bottom line:
| Metric | NXP Semiconductors N.V. (NXPI) | Silicon Laboratories Inc. (SLAB) |
|---|---|---|
| Revenue | 12.3B | 584M |
| Cost of Revenue | 5.6B | 272M |
| Operating Expenses | 3.4B | 478M |
| Gross Profit | 6.7B | 312M |
| EBITDA | 3.9B | -105M |
| EBIT | 3.1B | -154M |
| Interest Expense | 384M | 1.3M |
| Net Income | 2.0B | -191M |
| EPS | 8.00 | -5.93 |
| Fiscal Year | 2025 | 2024 |
Income Statement Analysis: The Bottom-Line Duel
This income statement comparison reveals the true operational efficiency and profitability trends of two semiconductor firms over recent years.
NXP Semiconductors N.V. Analysis
NXP shows stable revenue growth of 10.9% over five years despite a 2.7% revenue decline in 2025. Gross margin remains strong at 54.4%, supporting an efficient 16.5% net margin. In 2025, net income slipped to 2B from 2.51B, reflecting margin pressure but solid operational discipline.
Silicon Laboratories Inc. Analysis
Silicon Labs faces a steeper challenge with a 25.3% revenue drop in 2024 after earlier growth. Gross margin is decent at 53.4%, but operating losses deepen, producing a -26.3% EBIT margin and -32.7% net margin in 2024. Net income turned negative at -191M, signaling operational inefficiency and margin erosion.
Margin Strength vs. Revenue Scale
NXP Semiconductors delivers consistent profitability and margin resilience, outpacing Silicon Labs’ volatile revenue and deepening losses. NXP’s disciplined expense control and positive net income growth mark it as the fundamentally stronger performer. Investors typically prefer NXP’s profile, reflecting stable margins and sustainable earnings over Silicon Labs’ current operational struggles.
Financial Ratios Comparison
These vital ratios act as a diagnostic tool to expose the underlying fiscal health, valuation premiums, and capital efficiency of the companies compared below:
| Ratios | NXP Semiconductors N.V. (NXPI) | Silicon Laboratories Inc. (SLAB) |
|---|---|---|
| ROE | 20.1% | -17.7% |
| ROIC | 11.0% | -14.7% |
| P/E | 27.1 | -21.5 |
| P/B | 5.45 | 3.81 |
| Current Ratio | 2.05 | 6.15 |
| Quick Ratio | 1.38 | 5.07 |
| D/E (Debt-to-Equity) | 1.22 | 0.014 |
| Debt-to-Assets | 46.0% | 1.27% |
| Interest Coverage | 8.62 | -126.33 |
| Asset Turnover | 0.46 | 0.48 |
| Fixed Asset Turnover | 4.12 | 4.42 |
| Payout Ratio | 50.7% | 0 |
| Dividend Yield | 1.87% | 0 |
| Fiscal Year | 2025 | 2024 |
Efficiency & Valuation Duel: The Vital Signs
Ratios serve as a company’s financial DNA, exposing hidden risks and operational strengths that shape investment decisions.
NXP Semiconductors N.V.
NXP Semiconductors posts a strong 20.1% ROE and a healthy 16.47% net margin, signaling robust profitability. However, its P/E of 27.14 and P/B of 5.45 indicate a stretched valuation. The company balances shareholder returns with a modest 1.87% dividend yield, reflecting steady income alongside reinvestment in R&D for growth.
Silicon Laboratories Inc.
Silicon Laboratories displays negative profitability with a -17.69% ROE and -32.69% net margin, underscoring operational challenges. Its P/E is negative, which technically favors valuation but indicates losses. The lack of dividends highlights reliance on heavy R&D spending (over 56% of revenue) aimed at future growth, despite current financial weakness.
Premium Valuation vs. Operational Struggles
NXP Semiconductors offers a better balance of profitability and operational efficiency, despite a premium valuation. Silicon Laboratories faces critical profitability deficits and higher risk. Investors favoring stable returns and proven execution may lean toward NXP, while risk-tolerant growth seekers might consider Silicon Laboratories’ aggressive reinvestment.
Which one offers the Superior Shareholder Reward?
I compare NXP Semiconductors (NXPI) and Silicon Laboratories (SLAB) on distribution approaches, yields, payout ratios, and buybacks. NXPI pays a 1.87% dividend with a sustainable 51% payout, backed by strong FCF of $9.6/share. It also conducts meaningful buybacks, enhancing total return. SLAB pays no dividend, reflecting its losses and negative FCF. SLAB reinvests in growth but struggles with profitability and cash flow. NXPI’s balanced dividend and buyback strategy delivers more reliable, sustainable shareholder rewards. I conclude NXPI offers a superior total return profile in 2026.
Comparative Score Analysis: The Strategic Profile
The radar chart reveals the fundamental DNA and trade-offs of NXP Semiconductors and Silicon Laboratories, highlighting their core financial strengths and vulnerabilities:
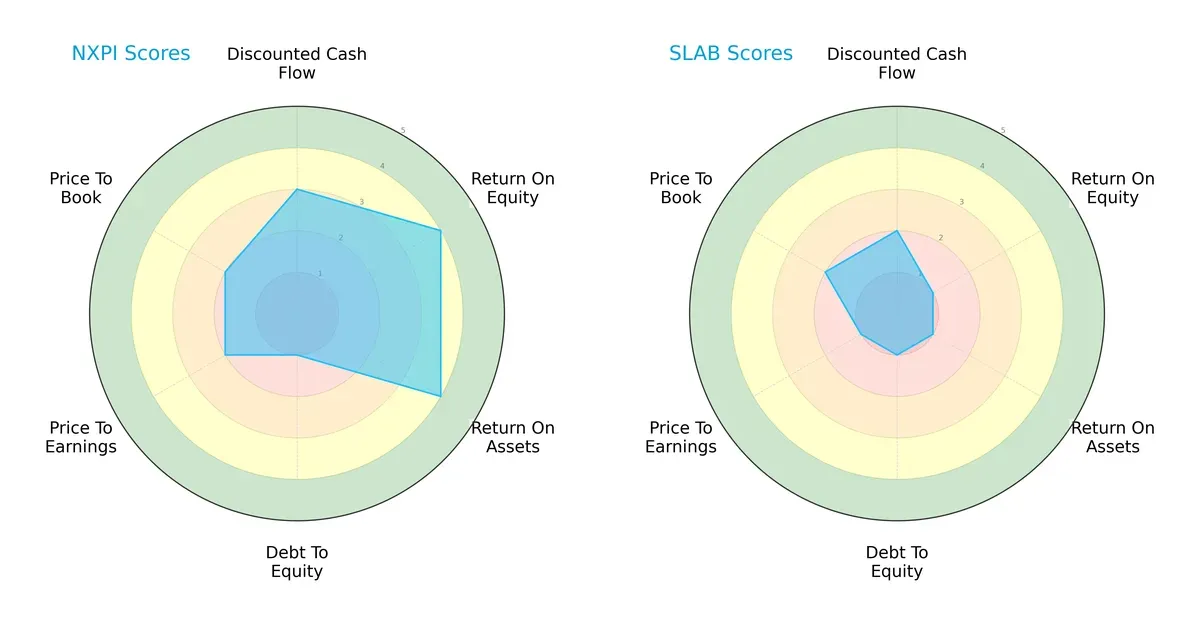
NXP Semiconductors boasts superior profitability with ROE and ROA scores of 4 each, versus Silicon Laboratories’ low scores of 1. However, NXP’s very unfavorable debt-to-equity score of 1 signals high leverage risk. Silicon Labs shows uniformly weak profitability and valuation scores but maintains a moderate price-to-book score. NXP offers a more balanced profile anchored by operational efficiency, while Silicon Labs leans on modest valuation appeal.
Bankruptcy Risk: Solvency Showdown
The Altman Z-Score gap indicates a stark contrast in financial safety:
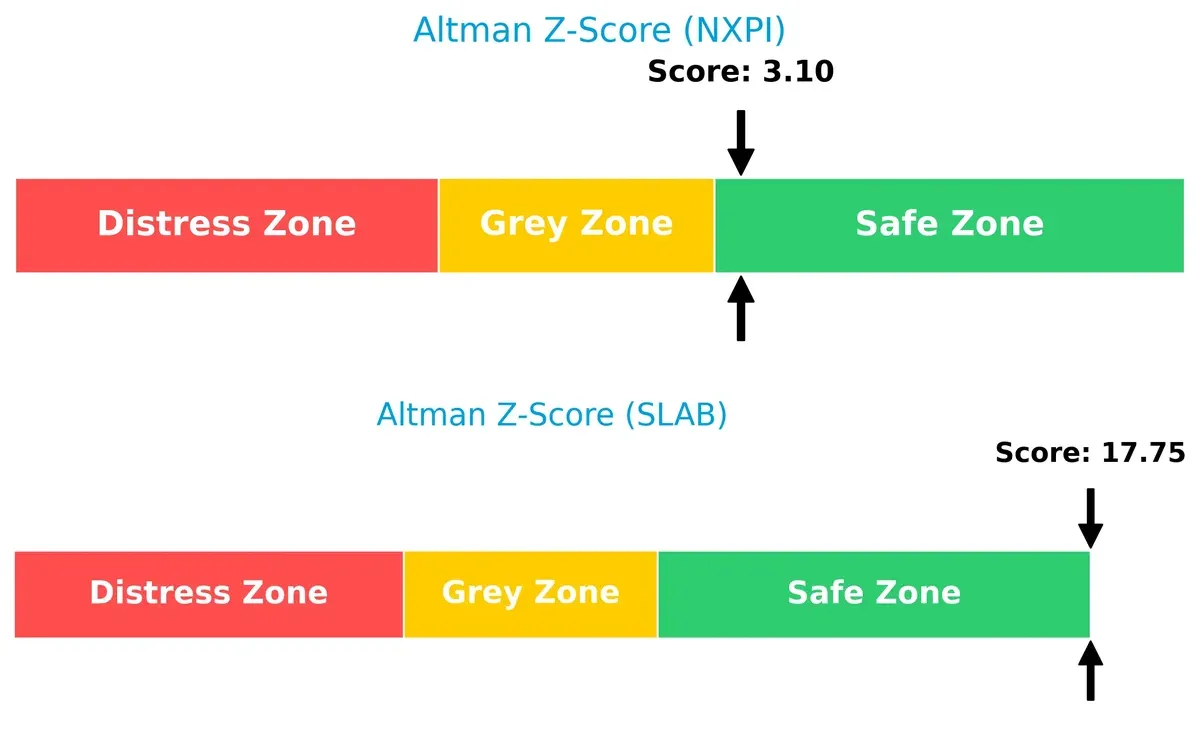
Silicon Laboratories scores an exceptionally high 17.75, signaling robust solvency and minimal bankruptcy risk. NXP Semiconductors’ 3.10 still places it safely above distress but closer to the grey zone threshold. This suggests Silicon Labs commands a stronger cushion for long-term survival amid market cycles.
Financial Health: Quality of Operations
Piotroski F-Scores highlight internal financial quality differences:
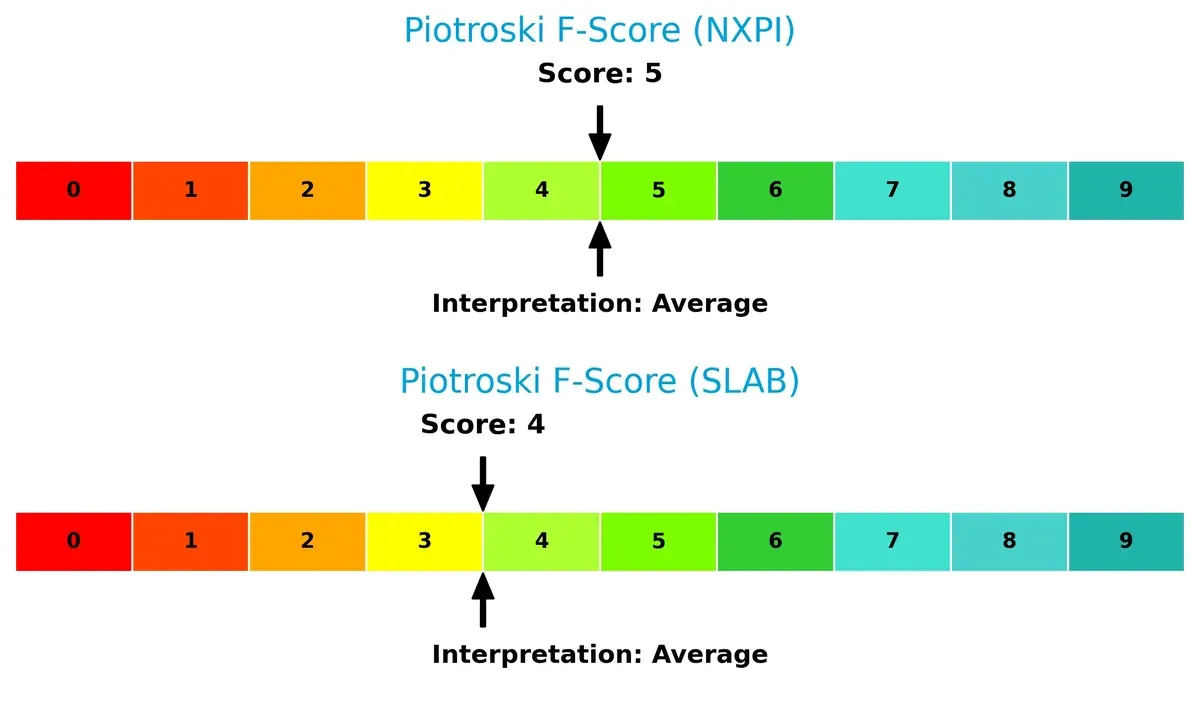
NXP Semiconductors scores 5, reflecting average financial health with room for improvement. Silicon Laboratories scores slightly lower at 4, indicating marginally weaker operational fundamentals. Neither firm shows acute red flags, but NXP holds a modest edge in quality metrics critical for sustainable value creation.
How are the two companies positioned?
This section dissects the operational DNA of NXP Semiconductors and Silicon Laboratories by comparing their revenue distribution and internal dynamics. The goal is to confront their economic moats and identify which model offers the most resilient, sustainable competitive advantage today.
Revenue Segmentation: The Strategic Mix
This visual comparison dissects how NXP Semiconductors and Silicon Laboratories diversify their income streams and where their primary sector bets lie:
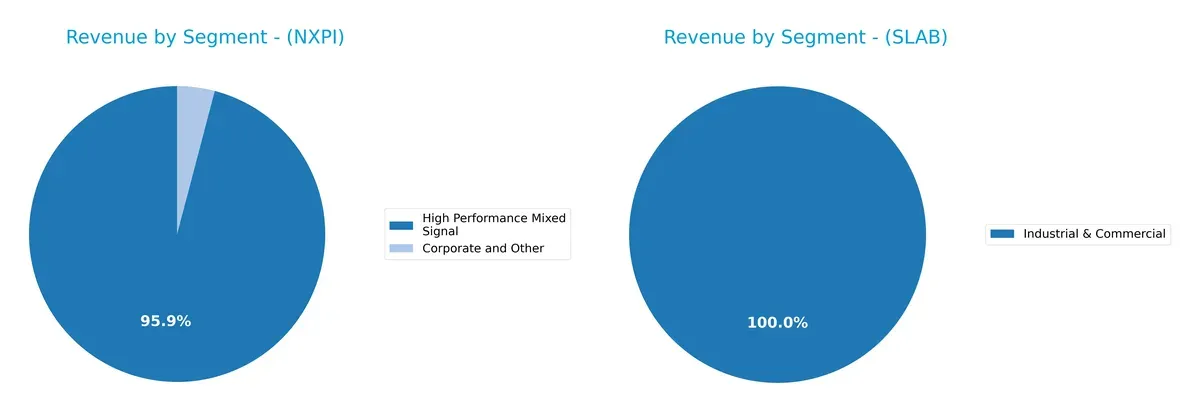
NXP Semiconductors anchors revenue in High Performance Mixed Signal, generating $9B in 2018, dwarfing its Corporate and Other segment at $385M. Its focus reveals a strong infrastructure dominance with minimal diversification. Conversely, Silicon Laboratories displays a more diversified mix across Industrial & Commercial, Infrastructure, IoT, and Access segments. This broad exposure reduces concentration risk but may dilute ecosystem lock-in benefits seen in NXP’s concentrated strategy.
Strengths and Weaknesses Comparison
This table compares the Strengths and Weaknesses of NXP Semiconductors N.V. and Silicon Laboratories Inc.:
NXP Semiconductors N.V. Strengths
- Favorable net margin (16.47%) and ROE (20.1%)
- Strong global presence across Asia, Europe, and the US
- Diversified revenue with high performance mixed signal products
- Solid current and quick ratios indicating liquidity
- Favorable fixed asset turnover ratio (4.12)
Silicon Laboratories Inc. Strengths
- Favorable quick ratio (5.07) and very low debt-to-equity (0.01)
- Favorable fixed asset turnover (4.42)
- Favorable P/E ratio due to negative earnings
- Exposure to industrial and commercial segments
- Low debt-to-assets ratio (1.27%)
NXP Semiconductors N.V. Weaknesses
- Unfavorable valuation ratios (P/E 27.14, P/B 5.45)
- High debt-to-equity (1.22) and moderate debt-to-assets (46%)
- Unfavorable asset turnover (0.46)
- Moderate interest coverage (7.97)
- Limited diversification beyond semiconductor segments
Silicon Laboratories Inc. Weaknesses
- Negative profitability ratios: net margin (-32.69%), ROE (-17.69%), ROIC (-14.71%)
- Unfavorable WACC (11.06%) and interest coverage (-117.18)
- Unfavorable current ratio (6.15) despite liquidity concerns
- No dividend yield
- Reliance on fewer segments and smaller global footprint
The comparison reveals NXP’s strength lies in profitability and global diversification, balanced by high leverage and valuation concerns. Silicon Laboratories shows strong liquidity and low leverage but faces significant profitability and operational challenges. Both firms must consider these factors in their strategic planning and capital allocation.
The Moat Duel: Analyzing Competitive Defensibility
A structural moat is the sole barrier protecting long-term profits from relentless competitive pressure and market disruption:
NXP Semiconductors N.V.: Diversified Application & Brand Moat
NXP leverages its broad product portfolio and brand strength, reflected in stable 54% gross margins and 16% net margins. However, its slightly declining ROIC signals pressure. Expansion into automotive and IoT markets in 2026 could reinforce its position if innovation accelerates.
Silicon Laboratories Inc.: Niche Focus with Operational Challenges
Silicon Labs relies on specialized analog and mixed-signal solutions, targeting IoT niches. Its moat is narrower, evident in negative EBIT and net margins, and steeply declining ROIC. Growth hinges on overcoming profitability issues and scaling new market segments.
Moat Resilience: Diversification vs. Niche Specialization
NXP’s wider moat combines scale, diverse end markets, and brand loyalty, despite recent margin pressures. Silicon Labs faces a very unfavorable moat with shrinking returns and operational losses. NXP remains better positioned to defend and grow its market share in 2026.
Which stock offers better returns?
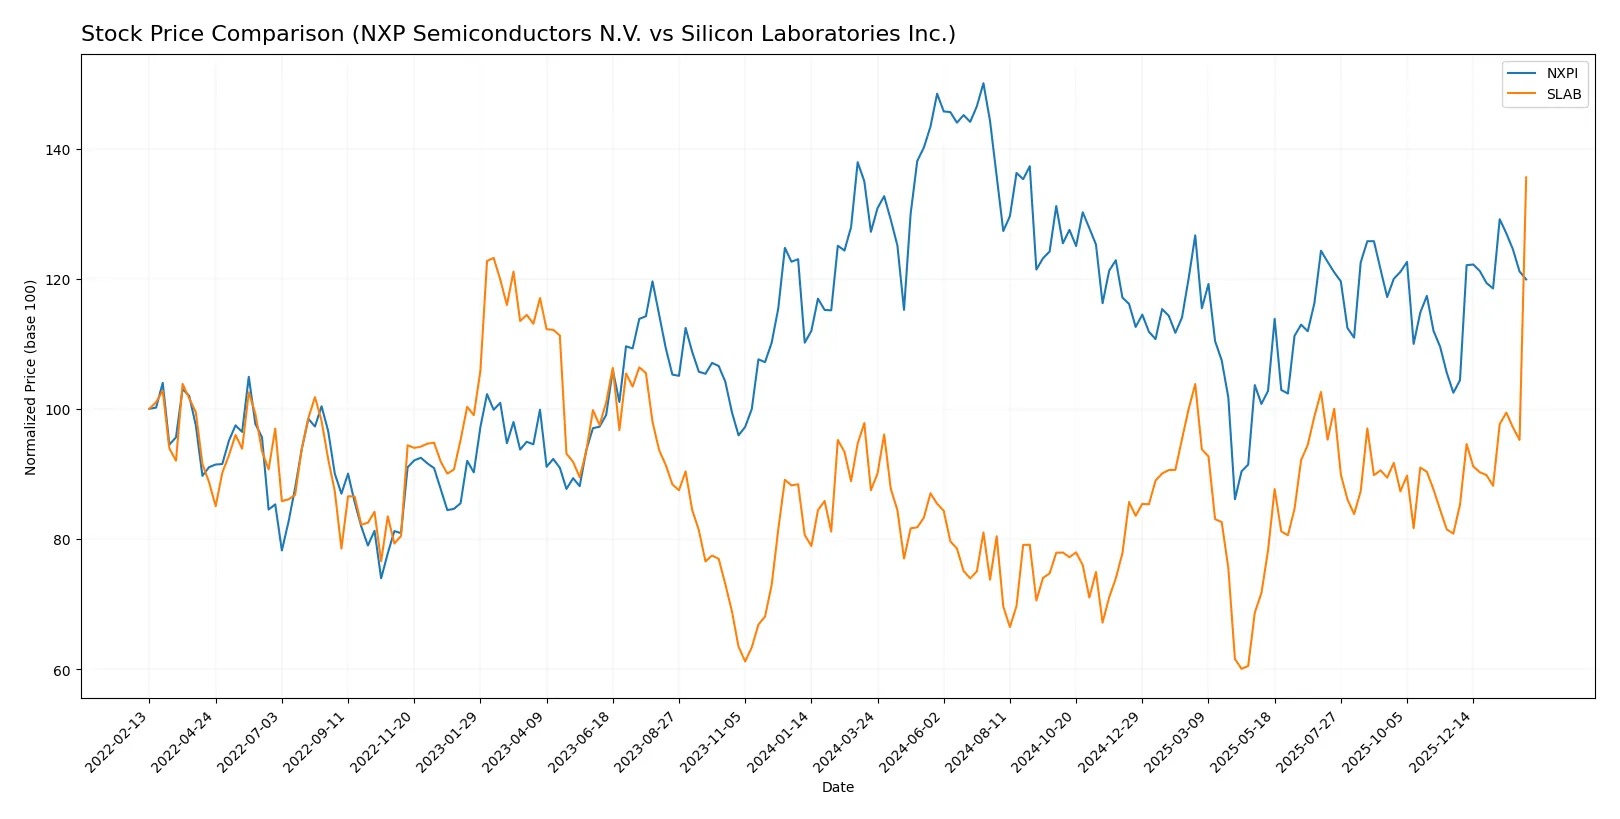
Over the past year, NXP Semiconductors N.V. and Silicon Laboratories Inc. exhibited contrasting price dynamics, with SLAB showing strong gains and NXPI facing pressure amid volatile trading patterns.
Trend Comparison
NXP Semiconductors N.V. recorded a bearish trend over the past 12 months, declining 5.75% with accelerating downward momentum and a volatility level of 24.1%. The stock hit a high of 280.19 and a low of 160.81, showing recent recovery with a 17.01% gain since November 2025.
Silicon Laboratories Inc. showed a robust bullish trend, surging 54.95% over the same period with accelerating momentum and lower volatility at 16.03%. Its price ranged between 89.82 and 202.84, with recent gains accelerating further to 67.74% since late 2025.
Comparing the two, SLAB has delivered the highest market performance with a clear, strong uptrend versus NXPI’s overall decline despite recent recovery signs.
Target Prices
Analysts present a moderate upside consensus for these semiconductor stocks, reflecting cautious optimism amid sector cyclicality.
| Company | Target Low | Target High | Consensus |
|---|---|---|---|
| NXP Semiconductors N.V. | 215 | 280 | 250 |
| Silicon Laboratories Inc. | 130 | 165 | 151.67 |
NXP’s consensus target at 250 implies roughly 12% upside from the current 223.5 price, signaling confidence in its diversified portfolio. Silicon Labs’ 151.67 target is well below its 202.8 price, suggesting potential overvaluation or profit-taking risk.

Don’t Let Luck Decide Your Entry Point
Optimize your entry points with our advanced ProRealTime indicators. You’ll get efficient buy signals with precise price targets for maximum performance. Start outperforming now!
How do institutions grade them?
NXP Semiconductors N.V. Grades
The following table lists recent institutional grades for NXP Semiconductors N.V.:
| Grading Company | Action | New Grade | Date |
|---|---|---|---|
| Evercore ISI Group | maintain | Outperform | 2026-02-04 |
| B of A Securities | maintain | Buy | 2026-02-04 |
| Truist Securities | maintain | Buy | 2026-02-04 |
| Mizuho | maintain | Outperform | 2026-02-04 |
| Citigroup | maintain | Buy | 2026-02-04 |
| JP Morgan | maintain | Neutral | 2026-02-04 |
| Needham | maintain | Buy | 2026-02-03 |
| Citigroup | maintain | Buy | 2026-01-15 |
| Wells Fargo | maintain | Overweight | 2026-01-15 |
| Truist Securities | maintain | Buy | 2025-12-19 |
Silicon Laboratories Inc. Grades
The following table lists recent institutional grades for Silicon Laboratories Inc.:
| Grading Company | Action | New Grade | Date |
|---|---|---|---|
| Morgan Stanley | maintain | Equal Weight | 2025-08-06 |
| Susquehanna | maintain | Neutral | 2025-08-06 |
| Barclays | maintain | Equal Weight | 2025-08-05 |
| Susquehanna | maintain | Neutral | 2025-07-22 |
| Stifel | maintain | Buy | 2025-07-18 |
| Keybanc | maintain | Overweight | 2025-07-08 |
| Benchmark | maintain | Buy | 2025-05-27 |
| Benchmark | maintain | Buy | 2025-05-14 |
| Needham | maintain | Buy | 2025-05-14 |
| Susquehanna | maintain | Neutral | 2025-05-14 |
Which company has the best grades?
NXP Semiconductors N.V. consistently receives higher ratings, including multiple “Buy” and “Outperform” grades. Silicon Laboratories Inc. shows a mix of “Buy,” “Overweight,” and “Neutral” ratings. Investors may perceive NXP as having stronger institutional support.
Risks specific to each company
The following categories identify critical pressure points and systemic threats facing both firms in the 2026 market environment:
1. Market & Competition
NXP Semiconductors N.V.
- Dominates automotive and industrial IoT with broad product portfolio; faces intense global semiconductor competition.
Silicon Laboratories Inc.
- Focuses on mixed-signal and wireless IoT niches; smaller scale limits competitive reach but allows specialization.
2. Capital Structure & Debt
NXP Semiconductors N.V.
- High debt-to-equity ratio (1.22) signals leverage risk; interest coverage solid at 7.97 times.
Silicon Laboratories Inc.
- Minimal debt load (0.01 ratio) lowers financial risk; negative interest coverage indicates operational cash flow stress.
3. Stock Volatility
NXP Semiconductors N.V.
- Beta 1.458 shows moderate sensitivity to market swings; stable volume supports liquidity.
Silicon Laboratories Inc.
- Beta 1.536 indicates higher volatility; recent surge (+48.4%) suggests speculative trading activity.
4. Regulatory & Legal
NXP Semiconductors N.V.
- Operates globally with exposure to evolving semiconductor export controls and IP lawsuits.
Silicon Laboratories Inc.
- U.S.-centric but international sales expose it to complex regulations and potential trade restrictions.
5. Supply Chain & Operations
NXP Semiconductors N.V.
- Extensive global supply chain can face geopolitical disruptions; diversified manufacturing locations mitigate risk.
Silicon Laboratories Inc.
- Smaller scale and fabless model reduce capital intensity but increase reliance on third-party suppliers.
6. ESG & Climate Transition
NXP Semiconductors N.V.
- Increasing ESG demands in automotive and industrial sectors pressure innovation and compliance costs.
Silicon Laboratories Inc.
- Growing ESG focus in IoT markets requires strategic investment; fewer resources may limit rapid adaptation.
7. Geopolitical Exposure
NXP Semiconductors N.V.
- Significant operations in China and Europe expose it to U.S.-China tensions and EU regulations.
Silicon Laboratories Inc.
- Primarily U.S.-based but sells internationally; less direct exposure but vulnerable to global trade policies.
Which company shows a better risk-adjusted profile?
NXP’s most impactful risk is its elevated leverage amid global supply chain and geopolitical pressures. Silicon Labs faces critical operational cash flow risks reflected in its negative interest coverage despite low debt. NXP’s diversified global footprint and stronger financial ratios give it a better risk-adjusted profile. Silicon Labs’ sharp stock volatility and widening losses raise red flags for investors wary of financial distress.
Final Verdict: Which stock to choose?
NXP Semiconductors N.V. (NXPI) stands out as a powerhouse of operational efficiency and solid profitability within a challenging semiconductor cycle. Its ability to generate strong returns on equity and maintain robust cash flow is impressive. A point of vigilance remains its rising leverage, which may pressure financial flexibility. NXPI suits an Aggressive Growth portfolio focused on quality and scale.
Silicon Laboratories Inc. (SLAB) offers an intriguing strategic moat through its high R&D intensity and niche market positioning. However, it currently struggles with negative profitability and value destruction, signaling elevated risk. Its superior liquidity profile relative to NXPI reduces short-term financial stress. SLAB fits a GARP investor willing to balance growth potential with significant turnaround risk.
If you prioritize steady value creation and operational strength, NXPI outshines as the compelling choice due to its proven cash generation and market scale. However, if you seek high growth with a tolerance for volatility, SLAB offers better upside potential from its innovation-driven niche, despite its current financial headwinds. Both scenarios demand careful risk management and alignment with investor risk appetite.
Disclaimer: Investment carries a risk of loss of initial capital. The past performance is not a reliable indicator of future results. Be sure to understand risks before making an investment decision.
Go Further
I encourage you to read the complete analyses of NXP Semiconductors N.V. and Silicon Laboratories Inc. to enhance your investment decisions: