Home > Comparison > Technology > NXPI vs Q
The strategic rivalry between NXP Semiconductors N.V. and Qnity Electronics, Inc. defines the current trajectory of the semiconductor industry. NXP operates as a diversified semiconductor powerhouse with broad applications, while Qnity focuses on advanced electronic materials critical to chip manufacturing. This head-to-head pits established scale against niche specialization. This analysis aims to reveal which corporate path delivers superior risk-adjusted returns for a balanced portfolio in 2026.
Table of contents
Companies Overview
NXP Semiconductors and Qnity Electronics each hold distinct roles shaping the semiconductor industry in 2026.
NXP Semiconductors N.V.: Leading Edge Semiconductor Innovator
NXP Semiconductors dominates the semiconductor space with a broad product portfolio including microcontrollers, application processors, and wireless connectivity solutions. Its core revenue stems from supplying chips for automotive, industrial IoT, mobile, and communication infrastructure markets. In 2026, it strategically emphasizes expanding its presence in automotive and IoT segments to leverage growing demand for connected devices.
Qnity Electronics, Inc.: Advanced Materials Specialist
Qnity Electronics focuses on supplying electronic solutions and materials critical to semiconductor chip manufacturing. Its revenue engine relies on providing advanced materials that improve chip performance and production efficiency. The company’s 2026 strategy targets innovation in semiconductor materials, aiming to support next-generation chip fabrication technologies following its recent rebranding.
Strategic Collision: Similarities & Divergences
While both operate in semiconductors, NXP invests heavily in developing end-use integrated circuits, fostering a product-centric ecosystem. Qnity instead pursues a materials-driven, enabling role in chip manufacturing, reflecting an upstream supplier philosophy. Their main competitive battleground lies in the semiconductor value chain’s innovation pipeline. Investors should note NXP’s scale and market reach contrast with Qnity’s niche specialization and growth potential.
Income Statement Comparison
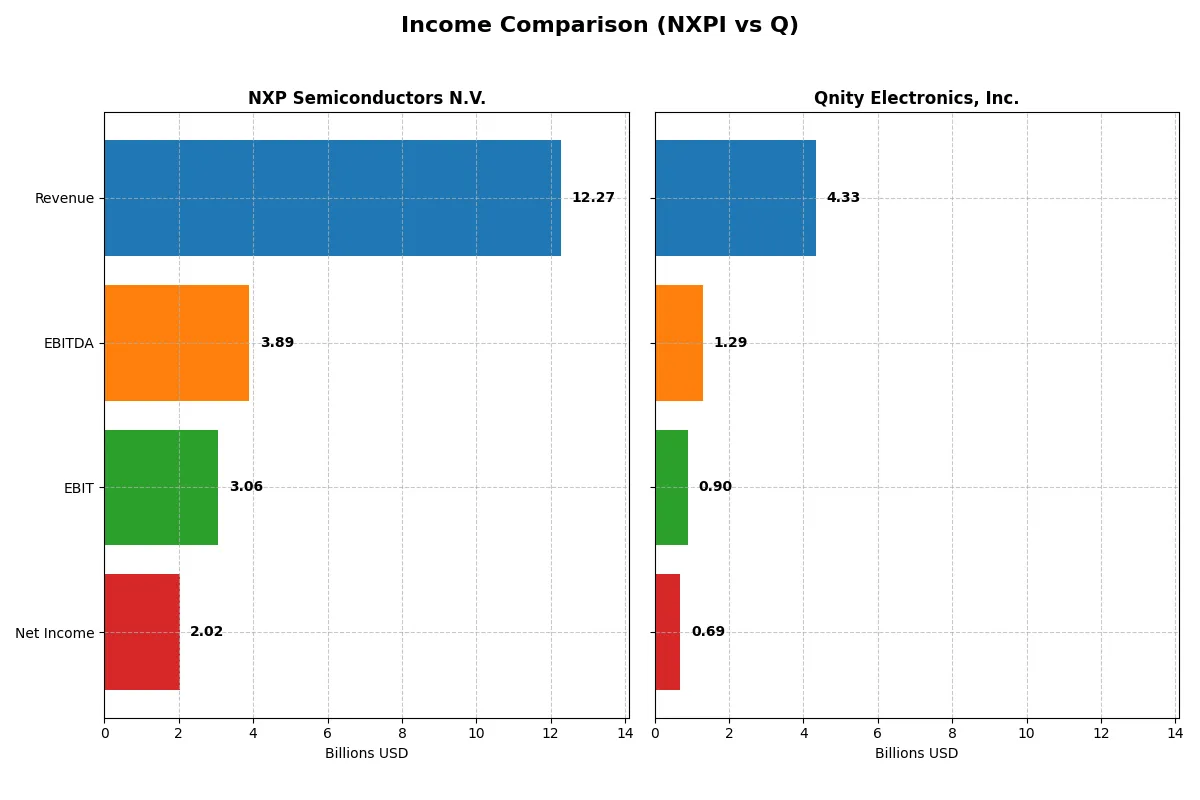
This data dissects the core profitability and scalability of both corporate engines to reveal who dominates the bottom line:
| Metric | NXP Semiconductors N.V. (NXPI) | Qnity Electronics, Inc. (Q) |
|---|---|---|
| Revenue | 12.3B | 4.34B |
| Cost of Revenue | 5.59B | 2.34B |
| Operating Expenses | 3.37B | 1.16B |
| Gross Profit | 6.68B | 1.99B |
| EBITDA | 3.89B | 1.29B |
| EBIT | 3.06B | 898M |
| Interest Expense | 384M | 280M |
| Net Income | 2.02B | 693M |
| EPS | 8.00 | 3.31 |
| Fiscal Year | 2025 | 2024 |
Income Statement Analysis: The Bottom-Line Duel
This income statement comparison reveals the true efficiency and momentum behind each company’s financial engine over recent years.
NXP Semiconductors N.V. Analysis
NXP’s revenue peaked at $13.3B in 2023 before declining to $12.3B in 2025, with net income following a similar downward trend to $2B in 2025. Gross and net margins remain robust at 54.4% and 16.5%, respectively, reflecting solid operational efficiency despite recent revenue softness. The slight margin contraction and EPS dip signal caution but highlight strong underlying profitability.
Qnity Electronics, Inc. Analysis
Qnity’s revenue grew steadily to $4.3B in 2024, with net income rising to $693M, showing clear momentum. Gross margin at 46.1% and net margin near 16% demonstrate healthy profitability for a smaller player. EBIT and net income surged over 30% year-on-year, indicating accelerating operational leverage and improving cost control in the most recent fiscal year.
Margin Strength vs. Growth Momentum
NXP commands superior scale and higher gross and EBIT margins, delivering strong absolute profits despite recent contraction. Qnity impresses with faster revenue and earnings growth, leveraging margin expansion effectively. For investors, NXP’s profile suits those prioritizing stable, high-margin cash flow, while Qnity appeals to growth-oriented portfolios seeking rising profitability.
Financial Ratios Comparison
These vital ratios serve as a diagnostic tool to expose the underlying fiscal health, valuation premiums, and capital efficiency of the companies compared below:
| Ratios | NXP Semiconductors N.V. (NXPI) | Qnity Electronics, Inc. (Q) |
|---|---|---|
| ROE | 20.10% | 6.51% |
| ROIC | 11.03% | 5.92% |
| P/E | 27.14 | 28.80 |
| P/B | 5.45 | 1.88 |
| Current Ratio | 2.05 | 1.77 |
| Quick Ratio | 1.38 | 1.06 |
| D/E (Debt-to-Equity) | 1.22 | 0.02 |
| Debt-to-Assets | 46.02% | 1.56% |
| Interest Coverage | 8.62 | 3.03 |
| Asset Turnover | 0.46 | 0.35 |
| Fixed Asset Turnover | 4.12 | 2.59 |
| Payout ratio | 50.72% | 0% |
| Dividend yield | 1.87% | 0% |
| Fiscal Year | 2025 | 2024 |
Efficiency & Valuation Duel: The Vital Signs
Financial ratios act as a company’s DNA, revealing hidden risks and operational excellence through profitability, valuation, and balance sheet strength.
NXP Semiconductors N.V.
NXP delivers strong profitability with a 20.1% ROE and a 16.47% net margin, signaling efficient operations. However, its P/E of 27.14 and P/B of 5.45 mark the stock as expensive. Shareholders receive a modest 1.87% dividend, balancing payout with robust R&D investment at 18.3% of revenue.
Qnity Electronics, Inc.
Qnity shows weaker profitability with a 6.51% ROE and a 15.99% net margin, indicating operational challenges. Its valuation appears stretched at a 28.8 P/E but a reasonable 1.88 P/B. The company pays no dividend, opting to reinvest in growth, supported by a lower debt load and solid current ratios.
Premium Valuation vs. Operational Safety
NXP offers superior profitability but trades at a premium, reflecting its tech moat and innovation edge. Qnity’s lower leverage and reinvestment focus provide operational safety but weaker returns. Investors seeking growth with risk tolerance may favor NXP, while conservative profiles might lean toward Qnity’s steadier balance sheet.
Which one offers the Superior Shareholder Reward?
I compare NXP Semiconductors (NXPI) and Qnity Electronics (Q) by their shareholder return strategies. NXPI pays a dividend yield near 1.9% with a payout ratio around 50%, well covered by free cash flow (FCF coverage ~2x), signaling a sustainable payout. Q pays no dividends, instead reinvesting FCF aggressively into R&D and growth initiatives. NXPI executes moderate buybacks, supporting total returns, while Q’s buyback activity remains minimal, focusing on balance sheet strength with negligible debt (debt/equity ~0.02). I find NXPI’s balanced model of dividends plus buybacks offers a more attractive and sustainable shareholder reward in 2026, combining income with capital return. Q’s growth reinvestment lacks immediate returns and higher risk, making NXPI superior for disciplined total return investors.
Comparative Score Analysis: The Strategic Profile
The radar chart reveals the fundamental DNA and trade-offs of NXP Semiconductors N.V. and Qnity Electronics, Inc., highlighting their strategic strengths and weaknesses:
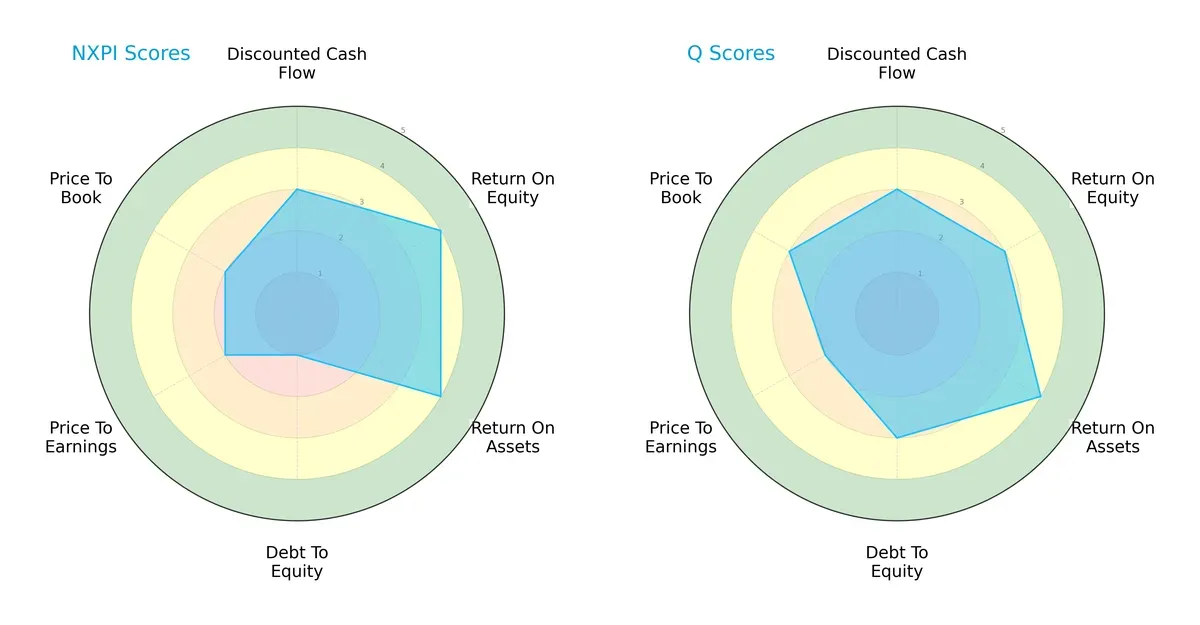
NXP Semiconductors excels in return on equity (4) and return on assets (4), demonstrating operational efficiency. However, its debt-to-equity score (1) signals heavy leverage, a red flag in volatile markets. Qnity Electronics shows a more balanced debt profile (3) and stronger valuation metrics (price-to-book 3 vs. 2). Yet, it lags slightly on return on equity (3). Overall, Qnity offers a steadier financial profile, while NXP relies on operational efficiency but carries higher financial risk.
How are the two companies positioned?
This section dissects the operational DNA of NXP Semiconductors and Qnity Electronics by comparing revenue distribution and internal strengths and weaknesses. The goal is to confront their economic moats to reveal which business model offers the most resilient competitive advantage today.
Revenue Segmentation: The Strategic Mix
This comparison dissects how NXP Semiconductors N.V. and Qnity Electronics, Inc. diversify their income streams and where their primary sector bets lie:
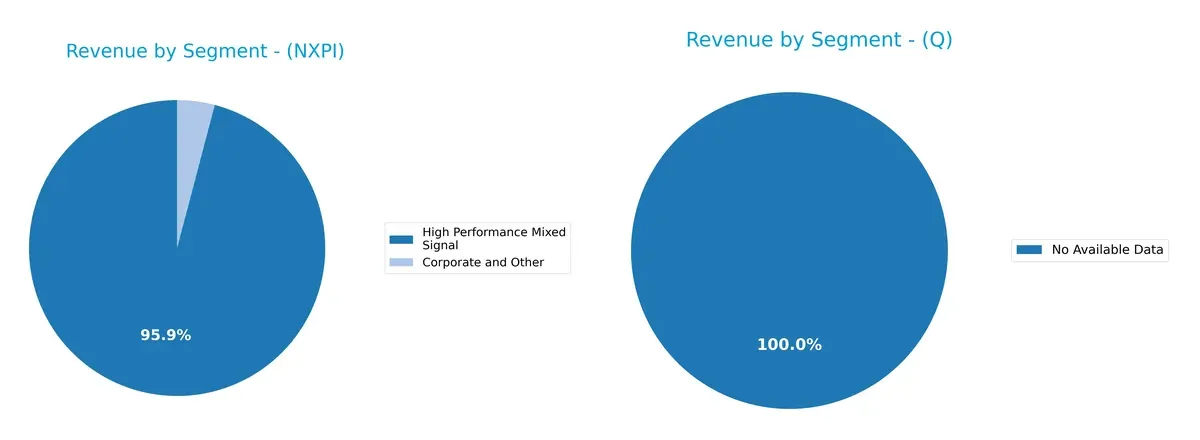
NXP Semiconductors heavily anchors its revenue in High Performance Mixed Signal, generating over 9B in 2018 and dwarfing its Corporate and Other segment at 385M. Standard Products contribute negligibly or zero in recent years. Qnity Electronics lacks available segmentation data, preventing direct comparison. NXP’s focus signals a deep specialization and potential infrastructure dominance, though it carries concentration risk by relying on one dominant segment.
Strengths and Weaknesses Comparison
This table compares the strengths and weaknesses of NXP Semiconductors N.V. and Qnity Electronics, Inc.:
NXP Semiconductors N.V. Strengths
- Favorable net margin (16.47%) and ROE (20.1%)
- Strong fixed asset turnover (4.12)
- Solid liquidity ratios (current 2.05, quick 1.38)
- Broad geographic revenue, including China, US, Europe
- Slightly favorable overall financial ratios
Qnity Electronics, Inc. Strengths
- Favorable net margin (15.99%)
- Very low debt-to-equity (0.02) and debt-to-assets (1.56%)
- Favorable WACC (5.83%) supports capital efficiency
- Favorable liquidity (current 1.77, quick 1.06)
- Slightly favorable overall financial ratios
NXP Semiconductors N.V. Weaknesses
- Unfavorable valuation metrics (PE 27.14, PB 5.45)
- High debt-to-equity (1.22) raises leverage risk
- Asset turnover is weak (0.46) despite strong fixed assets
- Moderate debt-to-assets (46.02%) could pressure solvency
- Market concentration in few product lines
Qnity Electronics, Inc. Weaknesses
- Low ROE (6.51%) indicates weak profitability
- Unfavorable PE (28.8) and zero dividend yield
- Neutral fixed asset turnover (2.59) limits efficiency
- Interest coverage ratio modest (3.21)
- Limited product and geographic diversification data
NXP Semiconductors shows robust profitability and liquidity but carries higher leverage and valuation risks. Qnity Electronics exhibits conservative leverage and capital costs but struggles with profitability and market breadth. These factors shape their strategic priorities and risk profiles.
The Moat Duel: Analyzing Competitive Defensibility
A structural moat is the only shield protecting long-term profits from relentless competitive erosion. Let’s dissect how each firm defends its turf:
NXP Semiconductors N.V.: Diversified Innovation Moat
NXP’s moat stems from its broad semiconductor portfolio and intangible assets in automotive and IoT markets. It delivers stable margins near 25% EBIT, but a declining ROIC signals pressure in 2026.
Qnity Electronics, Inc.: Niche Specialization Moat
Qnity relies on specialized electronic materials for chip manufacturing, a narrower moat than NXP’s. It shows stable ROIC but lacks value creation, though recent revenue growth hints at expansion potential.
Moat Strength: Diversified Innovation vs. Niche Specialization
NXP’s wider moat combines scale and innovation but faces margin and ROIC declines. Qnity’s niche moat is stable but limited in scope and value creation. NXP remains better positioned to defend market share long term.
Which stock offers better returns?
The stocks of NXP Semiconductors N.V. and Qnity Electronics, Inc. show contrasting price movements over the past year, with notable shifts in trend direction and trading dynamics.
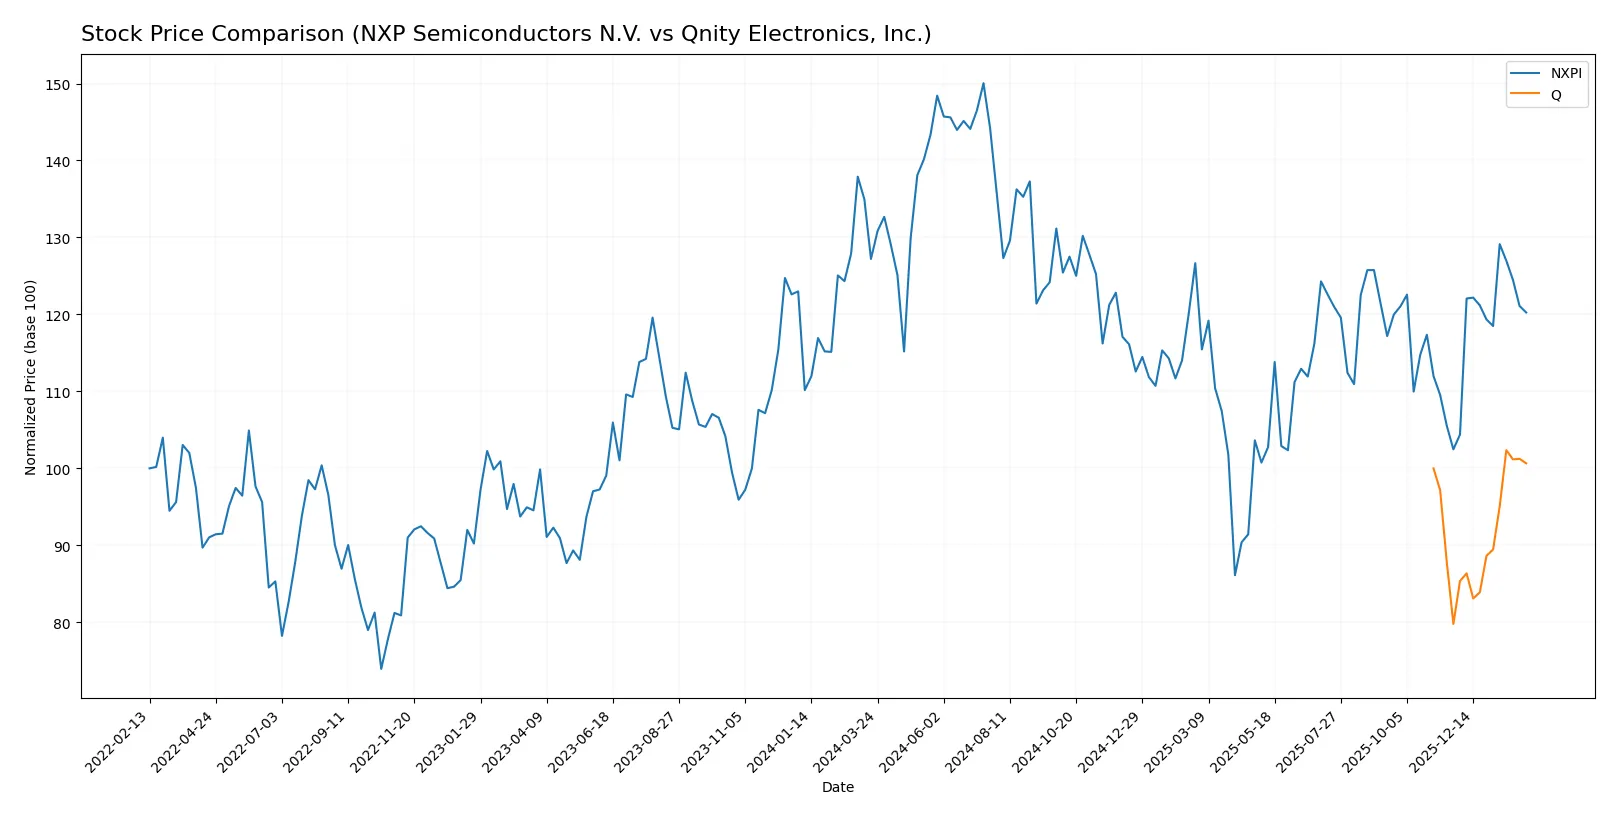
Trend Comparison
NXP Semiconductors exhibits a bearish trend over the past 12 months with a -5.46% price decline, accelerating downward volatility and a wide price range from 160.81 to 280.19.
Qnity Electronics shows a slight bullish trend over the same period, gaining 0.65% with accelerating momentum and lower volatility, maintaining prices between 75.8 and 97.25.
Qnity Electronics outperforms NXP Semiconductors overall, delivering positive returns while NXP’s stock declined, despite both showing recent acceleration in price gains.
Target Prices
The current analyst consensus reflects moderate upside potential for these semiconductor stocks.
| Company | Target Low | Target High | Consensus |
|---|---|---|---|
| NXP Semiconductors N.V. | 215 | 280 | 250 |
| Qnity Electronics, Inc. | 92 | 118 | 107 |
Analysts expect NXP Semiconductors to trade above its current price of $224, signaling confidence in its growth. Qnity Electronics also shows upside from $95, though with a slightly wider risk range.

Don’t Let Luck Decide Your Entry Point
Optimize your entry points with our advanced ProRealTime indicators. You’ll get efficient buy signals with precise price targets for maximum performance. Start outperforming now!
How do institutions grade them?
NXP Semiconductors N.V. Grades
The following table summarizes recent grades from reputable institutions for NXP Semiconductors N.V.:
| Grading Company | Action | New Grade | Date |
|---|---|---|---|
| Evercore ISI Group | Maintain | Outperform | 2026-02-04 |
| B of A Securities | Maintain | Buy | 2026-02-04 |
| Truist Securities | Maintain | Buy | 2026-02-04 |
| Mizuho | Maintain | Outperform | 2026-02-04 |
| Citigroup | Maintain | Buy | 2026-02-04 |
| JP Morgan | Maintain | Neutral | 2026-02-04 |
| Needham | Maintain | Buy | 2026-02-03 |
| Citigroup | Maintain | Buy | 2026-01-15 |
| Wells Fargo | Maintain | Overweight | 2026-01-15 |
| Truist Securities | Maintain | Buy | 2025-12-19 |
Qnity Electronics, Inc. Grades
Below are the recent institutional grades for Qnity Electronics, Inc.:
| Grading Company | Action | New Grade | Date |
|---|---|---|---|
| RBC Capital | Maintain | Outperform | 2025-11-25 |
| Mizuho | Maintain | Outperform | 2025-11-20 |
Which company has the best grades?
NXP Semiconductors N.V. commands a broader spectrum of mostly Buy and Outperform ratings from top firms, with only one Neutral. Qnity Electronics holds fewer grades but consistently Outperform. Investors may perceive NXP’s extensive coverage as a sign of market confidence and liquidity, while Qnity’s strong but limited ratings suggest more concentrated optimism.
Risks specific to each company
The following categories identify the critical pressure points and systemic threats facing both firms in the 2026 market environment:
1. Market & Competition
NXP Semiconductors N.V.
- Operates globally in a highly competitive semiconductor sector with strong incumbents.
Qnity Electronics, Inc.
- Newer market entrant focusing on semiconductor materials, facing intense competition and market penetration challenges.
2. Capital Structure & Debt
NXP Semiconductors N.V.
- Elevated debt-to-equity at 1.22 signals higher leverage risk despite solid interest coverage.
Qnity Electronics, Inc.
- Minimal debt exposure with a very low debt-to-equity ratio of 0.02, indicating strong balance sheet resilience.
3. Stock Volatility
NXP Semiconductors N.V.
- Beta of 1.458 implies above-market volatility, increasing investment risk.
Qnity Electronics, Inc.
- Beta of 0 suggests no measurable market volatility, possibly due to limited trading history.
4. Regulatory & Legal
NXP Semiconductors N.V.
- Operates in multiple jurisdictions, exposing it to complex regulatory scrutiny and compliance costs.
Qnity Electronics, Inc.
- As a newer US-based firm, regulatory risks remain but are less diversified internationally.
5. Supply Chain & Operations
NXP Semiconductors N.V.
- Large global footprint may face supply chain disruptions amid geopolitical tensions.
Qnity Electronics, Inc.
- Supply chain risk elevated by smaller scale and less established operational networks.
6. ESG & Climate Transition
NXP Semiconductors N.V.
- Increasing ESG pressures on semiconductor manufacturing and energy use require proactive adaptation.
Qnity Electronics, Inc.
- ESG frameworks still evolving; potential risks as regulations tighten in coming years.
7. Geopolitical Exposure
NXP Semiconductors N.V.
- Significant exposure to China and Europe heightens risks from trade conflicts and sanctions.
Qnity Electronics, Inc.
- Primarily US-focused, reducing but not eliminating geopolitical risk.
Which company shows a better risk-adjusted profile?
NXP faces its greatest risk from high leverage which could strain financial flexibility during market downturns. Qnity’s critical risk lies in market competition and operational scale. Despite higher volatility, NXP’s established global presence and diversified operations suggest a better risk-adjusted profile. Its Altman Z-score places it safely above bankruptcy risk, whereas Qnity’s short track record and smaller scale require caution. The sharp drop in Qnity’s recent stock price (-4.4%) signals market skepticism, underscoring competitive and operational vulnerabilities.
Final Verdict: Which stock to choose?
NXP Semiconductors N.V. (NXPI) stands out with its unmatched operational efficiency and strong profitability metrics, delivering solid returns on equity and capital. Its main point of vigilance is a relatively high debt-to-equity ratio, which could pressure financial flexibility. NXPI suits aggressive growth portfolios willing to embrace cyclical risks.
Qnity Electronics, Inc. (Q) offers a strategic moat through a conservative balance sheet and consistent free cash flow generation, ensuring better financial stability. Though its returns on equity trail NXPI, Q’s lower leverage and steady income growth make it appealing for GARP investors seeking measured growth with less risk.
If you prioritize high operational efficiency and superior profitability, NXPI is the compelling choice due to its ability to generate above-average returns despite leverage concerns. However, if you seek better stability and lower financial risk, Q offers a safer profile with steady cash flow and capital structure discipline. Each scenario reflects distinct investor priorities in a volatile semiconductor landscape.
Disclaimer: Investment carries a risk of loss of initial capital. The past performance is not a reliable indicator of future results. Be sure to understand risks before making an investment decision.
Go Further
I encourage you to read the complete analyses of NXP Semiconductors N.V. and Qnity Electronics, Inc. to enhance your investment decisions: