Home > Comparison > Technology > NXPI vs ONTO
The strategic rivalry between NXP Semiconductors N.V. and Onto Innovation Inc. shapes the semiconductor industry’s evolution. NXP operates as a diversified semiconductor powerhouse with a broad product portfolio spanning automotive to IoT. Onto Innovation specializes in precision process control tools, focusing on manufacturing efficiency in semiconductor production. This analysis pits broad-based innovation against niche technological mastery to identify which offers superior risk-adjusted returns for a balanced portfolio.
Table of contents
Companies Overview
NXP Semiconductors and Onto Innovation are pivotal players shaping the semiconductor industry landscape.
NXP Semiconductors N.V.: Global Semiconductor Powerhouse
NXP Semiconductors dominates as a leading semiconductor manufacturer specializing in microcontrollers and application processors. Its revenue engine revolves around delivering wireless connectivity solutions and sensors for automotive, industrial, and IoT applications. In 2026, the company sharpened its focus on expanding its ecosystem across communication infrastructure and automotive sectors to capitalize on emerging technology trends.
Onto Innovation Inc.: Precision Process Control Specialist
Onto Innovation excels in semiconductor process control tools, offering advanced lithography, defect inspection, and metrology systems. Its core revenue derives from selling standalone and integrated process control software and hardware to semiconductor and advanced packaging manufacturers. In 2026, Onto emphasized enhancing its device packaging and yield management solutions to improve manufacturing precision and efficiency.
Strategic Collision: Similarities & Divergences
Both companies operate in the semiconductor sector but diverge sharply in business philosophy: NXP focuses on broad semiconductor components within a diversified product portfolio, while Onto zeroes in on specialized process control equipment. Their primary battleground lies in serving semiconductor manufacturers—NXP as a component supplier, Onto as a manufacturing enabler. This distinction shapes their investment profiles: NXP embodies scale and product breadth; Onto represents niche precision and manufacturing innovation.
Income Statement Comparison
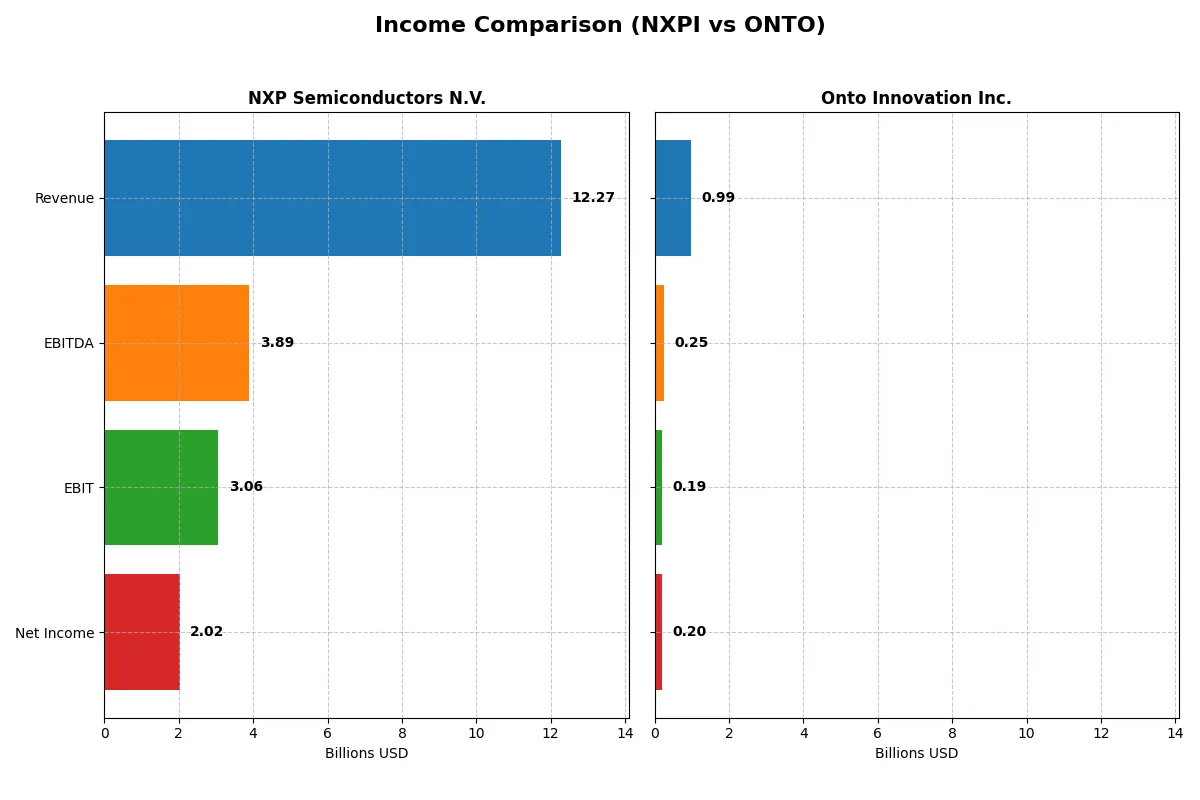
This data dissects the core profitability and scalability of both corporate engines to reveal who dominates the bottom line:
| Metric | NXP Semiconductors N.V. (NXPI) | Onto Innovation Inc. (ONTO) |
|---|---|---|
| Revenue | 12.27B | 987M |
| Cost of Revenue | 5.59B | 472M |
| Operating Expenses | 3.37B | 328M |
| Gross Profit | 6.68B | 515M |
| EBITDA | 3.89B | 249M |
| EBIT | 3.06B | 187M |
| Interest Expense | 384M | 0 |
| Net Income | 2.02B | 202M |
| EPS | 8.00 | 4.09 |
| Fiscal Year | 2025 | 2024 |
Income Statement Analysis: The Bottom-Line Duel
This income statement comparison reveals which company runs a more efficient and growth-oriented corporate engine through their revenue and profit dynamics.
NXP Semiconductors N.V. Analysis
NXP Semiconductors grew revenue modestly by 10.9% from 2021 to 2025 but saw a 2.74% revenue decline in 2025 alone. Gross margin remains robust at 54.4%, and net margin stands at 16.5%, signaling solid profitability despite a 17.2% net margin contraction last year. The 2025 net income of 2.0B reflects efficiency challenges as EPS dropped 18.3%.
Onto Innovation Inc. Analysis
Onto Innovation recorded strong revenue growth of 77.4% over 2020-2024 and surged 21.0% in 2024 alone. Its gross margin of 52.2% and net margin of 20.4% highlight excellent profitability and operational leverage. Net income jumped 550% over the period, reaching 202M in 2024, with a 65% EPS growth last year, underscoring solid momentum and margin expansion.
Growth Momentum vs. Scale Efficiency
Onto Innovation outpaces NXP with exceptional revenue and net income growth, paired with superior margin expansion. However, NXP’s larger scale delivers more absolute profit (2.0B vs. 202M) despite recent margin pressures. Investors seeking rapid growth and margin improvement may favor Onto, while those valuing established scale and stable margins may lean toward NXP.
Financial Ratios Comparison
These vital ratios act as a diagnostic tool to expose the underlying fiscal health, valuation premiums, and capital efficiency of the companies compared below:
| Ratios | NXP Semiconductors N.V. (NXPI) | Onto Innovation Inc. (ONTO) |
|---|---|---|
| ROE | 20.10% | 10.47% |
| ROIC | 11.03% | 8.77% |
| P/E | 27.14 | 41.76 |
| P/B | 5.45 | 4.37 |
| Current Ratio | 2.05 | 8.69 |
| Quick Ratio | 1.38 | 7.00 |
| D/E | 1.22 | 0.01 |
| Debt-to-Assets | 46.02% | 0.72% |
| Interest Coverage | 8.62 | 0 |
| Asset Turnover | 0.46 | 0.47 |
| Fixed Asset Turnover | 4.12 | 7.16 |
| Payout ratio | 50.72% | 0 |
| Dividend yield | 1.87% | 0 |
| Fiscal Year | 2025 | 2024 |
Efficiency & Valuation Duel: The Vital Signs
Ratios serve as a company’s financial DNA, unveiling hidden risks and operational excellence beneath headline figures.
NXP Semiconductors N.V.
NXP shows strong profitability with a 20.1% ROE and solid 16.5% net margin, signaling operational efficiency. However, its valuation is stretched, with a P/E of 27.1 and P/B at 5.45, both unfavorable. The company balances shareholder returns through a modest 1.87% dividend yield while investing heavily in R&D to sustain growth.
Onto Innovation Inc.
Onto Innovation posts a favorable 20.4% net margin but a lower 10.5% ROE, reflecting moderate profitability. Its valuation is expensive, with a P/E of 41.8 and P/B of 4.37, both flagged as unfavorable. Onto offers no dividends, instead directing capital into growth and R&D, maintaining a strong liquidity position with a quick ratio of 7.0.
Valuation Pressure Meets Profitability Trade-Off
NXP offers a better balance of profitability and valuation, despite its stretched multiples. Onto’s higher valuation and lower returns suggest greater risk. Investors seeking operational strength with steady dividends may prefer NXP, while those favoring aggressive growth might consider Onto’s profile.
Which one offers the Superior Shareholder Reward?
I see NXP Semiconductors (NXPI) offers a 1.87% dividend yield with a sustainable 51% payout ratio, backed by strong free cash flow coverage. NXPI combines dividends with substantial buybacks, enhancing total shareholder returns. Onto Innovation (ONTO) pays no dividends but reinvests heavily in growth, evidenced by low debt and high cash ratios. However, its elevated P/E ratios imply premium valuation risk. Historically, NXPI’s balanced distribution and capital allocation provide a more reliable and attractive total return profile for 2026 investors.
Comparative Score Analysis: The Strategic Profile
The radar chart reveals the fundamental DNA and trade-offs of NXP Semiconductors N.V. and Onto Innovation Inc., highlighting their distinct financial strengths and vulnerabilities:
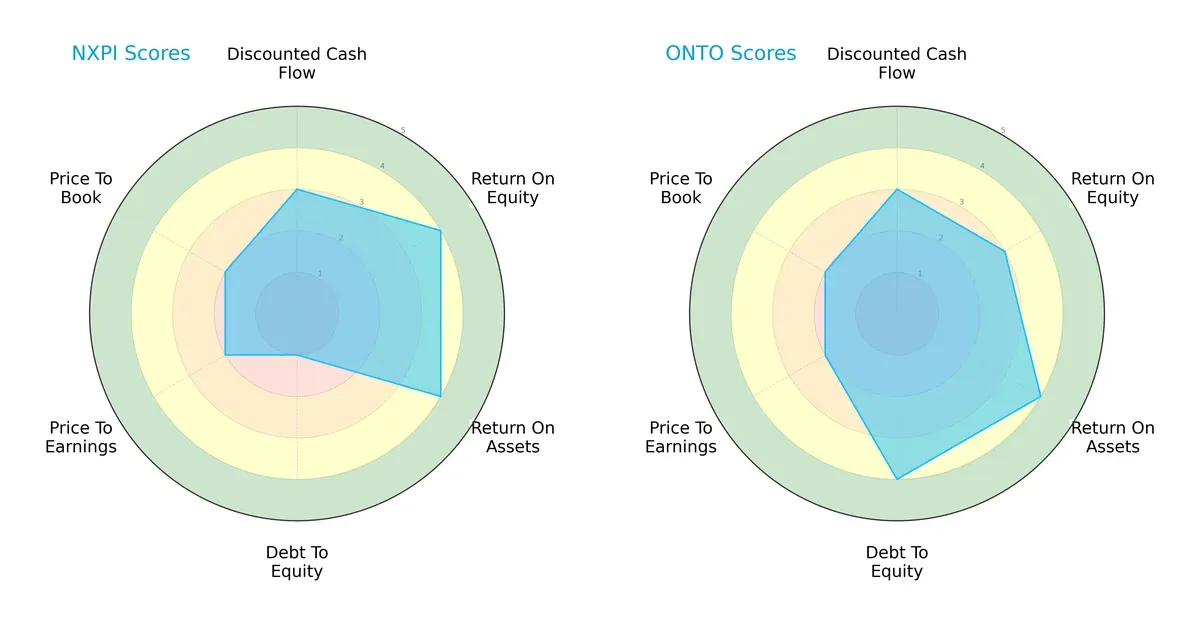
NXP Semiconductors shows strength in Return on Equity (4) and Return on Assets (4), signaling efficient profit generation and asset use. However, its debt-to-equity score (1) is a significant red flag, indicating high leverage risk. Onto Innovation balances its profile better, with a strong debt-to-equity score (4) reflecting low financial risk, but it trails in ROE (3). Both share moderate valuations (P/E and P/B scores at 2). NXP relies on operational efficiency, while Onto prioritizes financial stability.
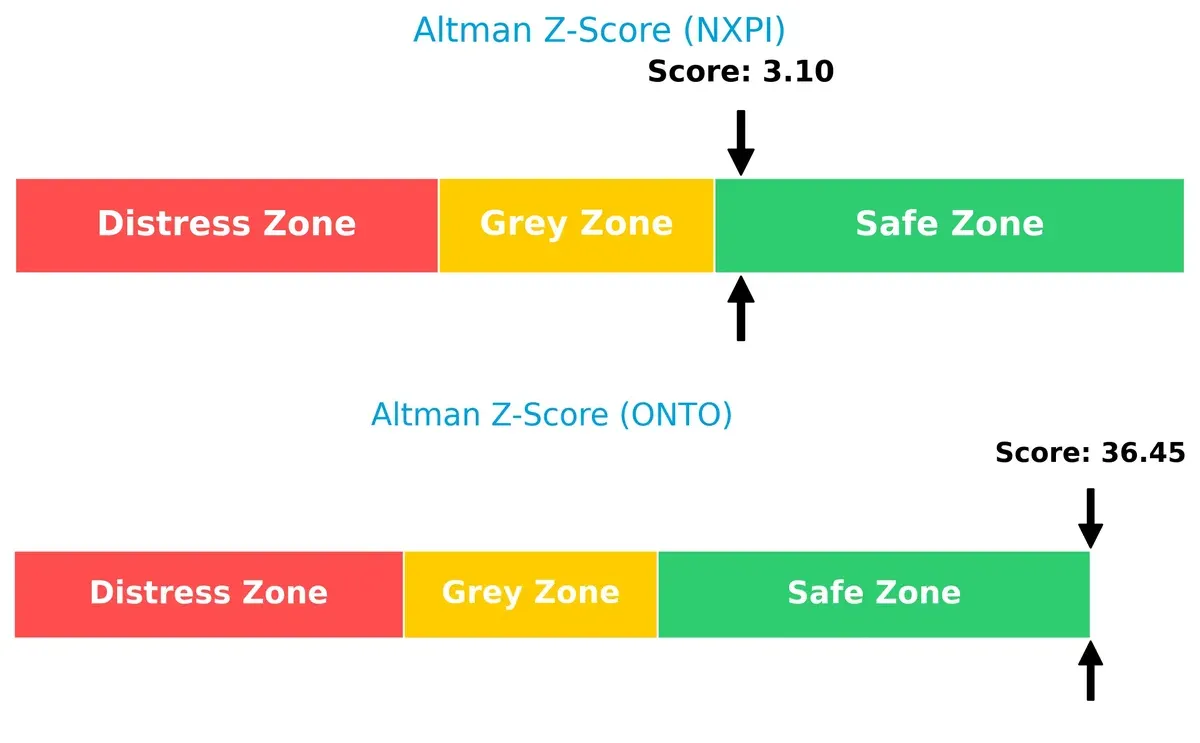
Bankruptcy Risk: Solvency Showdown
The Altman Z-Scores place both firms firmly in the safe zone, with Onto Innovation (36.45) vastly outperforming NXP Semiconductors (3.10), signaling superior long-term solvency and resilience in this cycle:
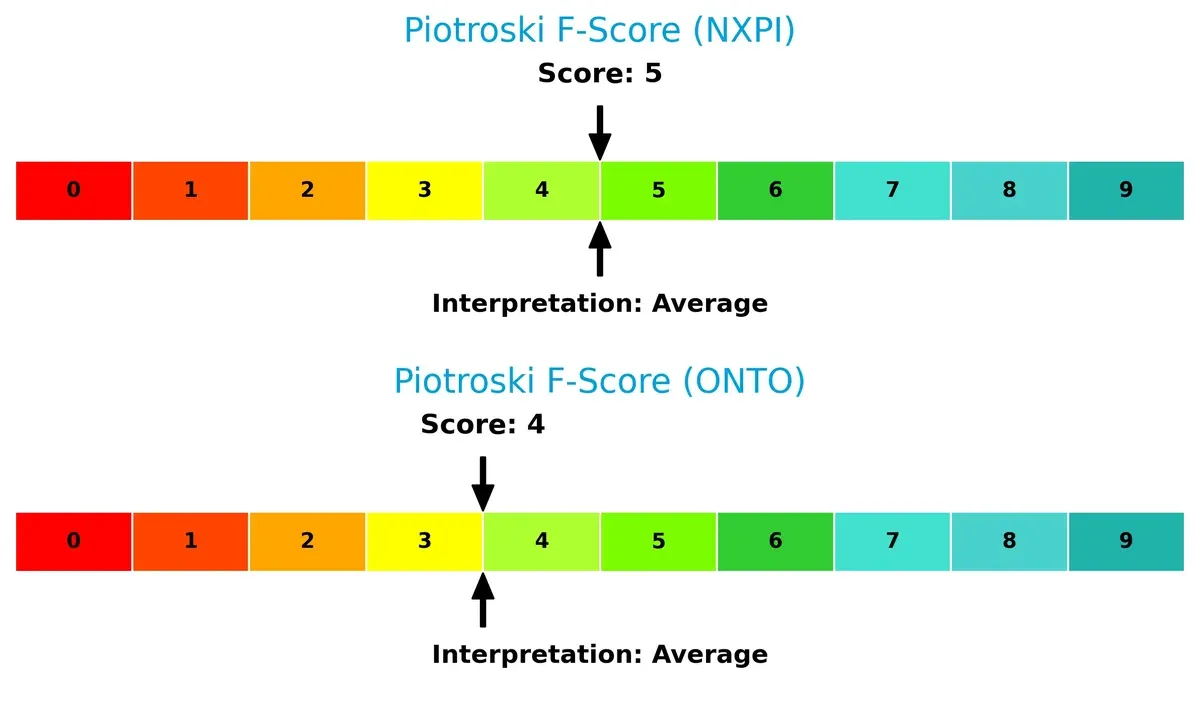
Financial Health: Quality of Operations
NXP Semiconductors holds a slight edge with a Piotroski F-Score of 5 versus Onto Innovation’s 4, both average but indicating moderate internal financial health. Neither exhibits critical red flags, yet neither stands out as exceptionally strong:
How are the two companies positioned?
This section dissects the operational DNA of NXP and Onto by comparing their revenue distribution and internal strengths and weaknesses. The goal is to confront their economic moats and identify which model delivers the most resilient competitive advantage today.
Revenue Segmentation: The Strategic Mix
The following visual comparison dissects how NXP Semiconductors N.V. and Onto Innovation Inc. diversify their income streams and where their primary sector bets lie:
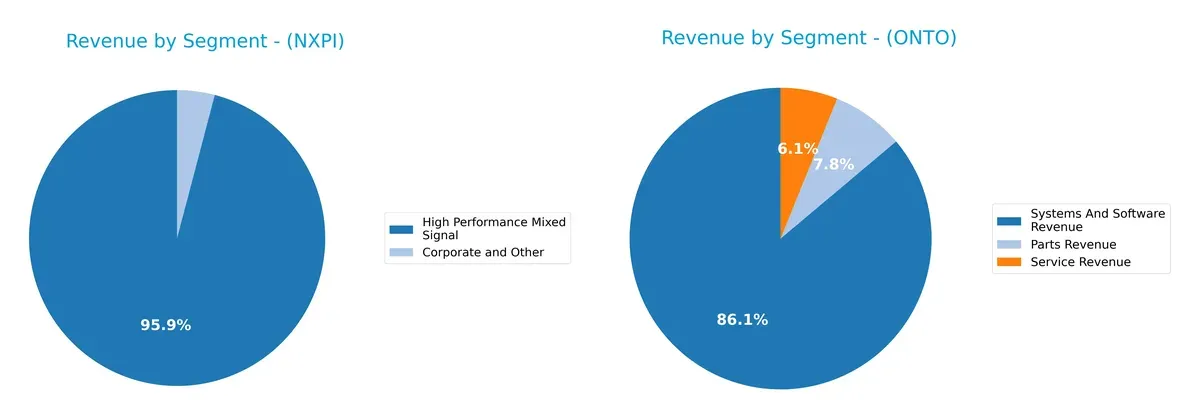
NXP Semiconductors anchors its revenue in High Performance Mixed Signal, generating $9B in 2018, dwarfing its Corporate and Other segment at $385M. This concentration signals a strong moat in specialized semiconductors but also a dependency risk. Onto Innovation displays a more diversified mix in 2024: Systems and Software leads at $850M, followed by Parts at $77M and Services at $60M. Onto’s spread reduces concentration risk and signals an ecosystem lock-in strategy through software and hardware integration.
Strengths and Weaknesses Comparison
This table compares the strengths and weaknesses of NXP Semiconductors N.V. and Onto Innovation Inc.:
NXP Semiconductors N.V. Strengths
- Strong profitability with 16.47% net margin and 20.1% ROE
- Solid liquidity ratios with current ratio 2.05 and quick ratio 1.38
- Favorable fixed asset turnover at 4.12
- Diverse global presence including China, US, Europe, and Asia
- Significant market share in high performance mixed signal products
Onto Innovation Inc. Strengths
- Highest net margin at 20.43% indicating efficient operations
- Very low debt-to-equity ratio (0.01) and debt-to-assets (0.72%)
- Excellent interest coverage ratio (∞)
- Strong fixed asset turnover of 7.16
- Global sales presence across Korea, Taiwan, US, China, and Japan
NXP Semiconductors N.V. Weaknesses
- High debt-to-equity ratio of 1.22 raises financial risk
- Unfavorable valuation metrics with PE 27.14 and PB 5.45
- Modest asset turnover ratio of 0.46 limits efficiency
- Elevated debt-to-assets at 46.02%
- No clear diversification outside semiconductor segments
Onto Innovation Inc. Weaknesses
- Unfavorable PE of 41.76 and PB 4.37 suggest overvaluation
- Current ratio extremely high at 8.69, may indicate inefficient asset use
- WACC at 10.8% exceeds ROIC of 8.77%, destroying value
- Zero dividend yield may deter income-focused investors
- Asset turnover at 0.47 indicates limited operational efficiency
NXP Semiconductors shows balanced strengths in profitability and liquidity with some financial leverage concerns. Onto Innovation excels in profitability and low leverage but faces valuation and efficiency challenges. Both companies exhibit global footprints supporting geographic diversification in their strategies.
The Moat Duel: Analyzing Competitive Defensibility
A structural moat is the sole shield preserving long-term profits from competitive erosion. Let’s dissect the moats of these two semiconductor players:
NXP Semiconductors N.V.: Intangible Assets and Broad Diversification
NXP’s moat hinges on its extensive product portfolio and global footprint, reflected in stable, though slightly declining, ROIC and healthy margins near 25% EBIT. In 2026, its push into automotive and IoT segments may deepen defensibility but faces margin pressure amid supply chain challenges.
Onto Innovation Inc.: Innovation-Driven Cost Advantage
Onto Innovation’s moat centers on proprietary process control tools and rapid ROIC growth, despite currently shedding value relative to WACC. Its focus on niche semiconductor metrology fuels accelerating revenue and margin expansion, positioning it well for market disruption in 2026.
Verdict: Diversification and Intangible Assets vs. Innovation-Driven Growth
NXP’s broader product base offers a wider moat but shows signs of margin compression and value erosion. Onto’s rapidly improving ROIC and focused innovation create a deeper, though narrower, moat. I see Onto better equipped to defend and expand its niche market share going forward.
Which stock offers better returns?
The past year reveals contrasting price dynamics: NXP Semiconductors N.V. (NXPI) faced a 5.46% decline with accelerating downward momentum, while Onto Innovation Inc. (ONTO) gained 5.67%, showing bullish acceleration.
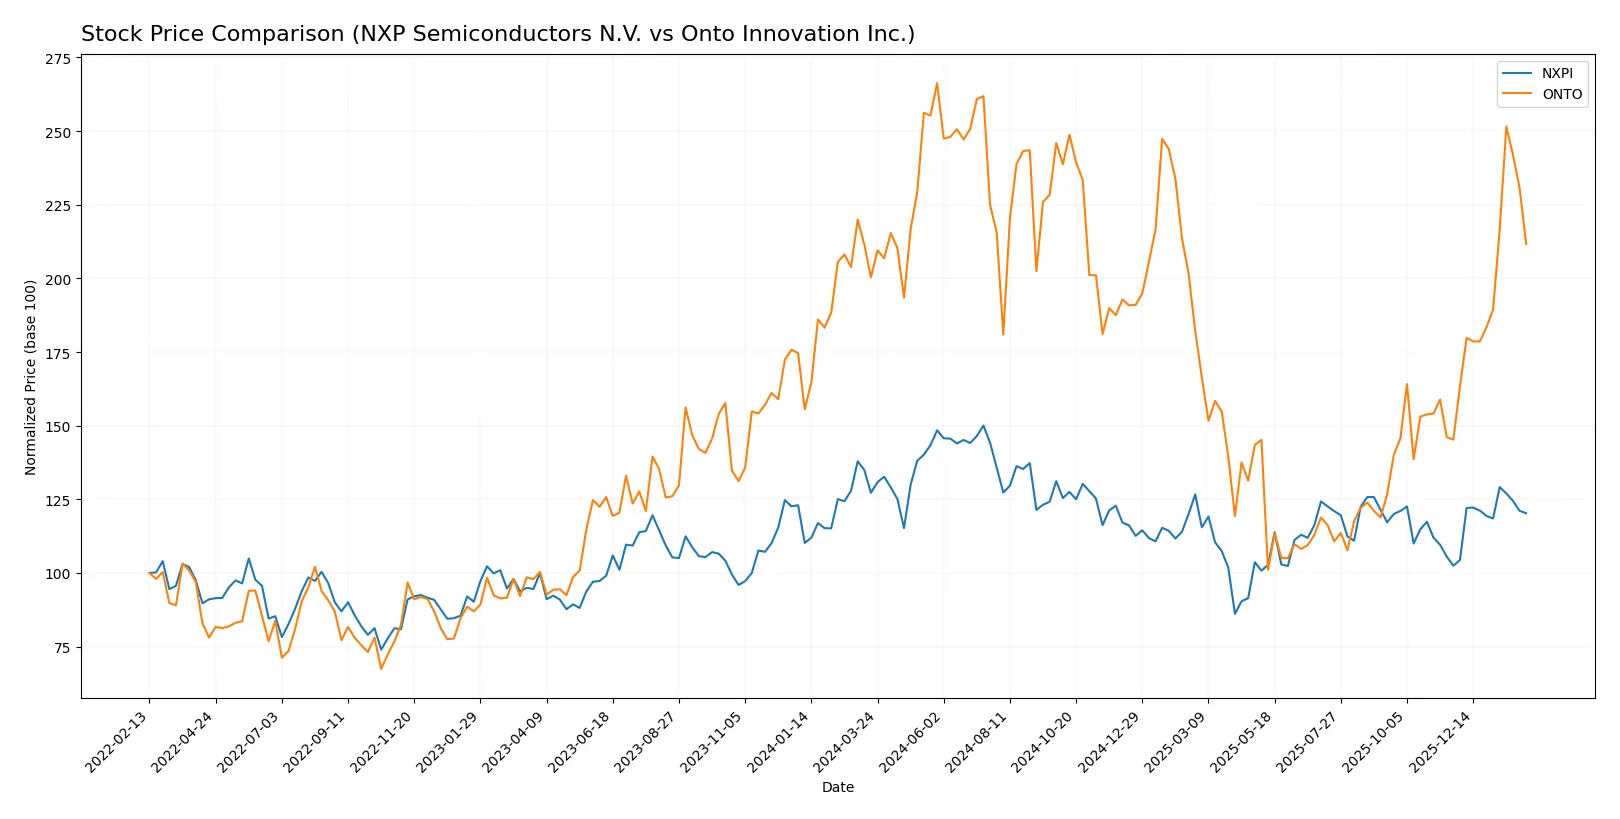
Trend Comparison
NXPI’s stock declined 5.46% over the past 12 months, marking a bearish trend with accelerating downside and a high volatility of 24.1%. It hit a high of 280.19 and a low of 160.81.
ONTO’s stock rose 5.67% over the same period, reflecting a bullish trend with accelerating gains and stronger volatility at 42.99%. Its price ranged between 88.5 and 233.14.
Comparing trends, ONTO delivered the highest market performance with a positive return and bullish momentum, contrasting NXPI’s bearish 12-month trajectory.
Target Prices
Analysts present a cautiously optimistic target consensus for these semiconductor names.
| Company | Target Low | Target High | Consensus |
|---|---|---|---|
| NXP Semiconductors N.V. | 215 | 280 | 250 |
| Onto Innovation Inc. | 160 | 260 | 191.67 |
NXP’s consensus target of 250 suggests a 11% upside from the current 225 price, signaling moderate confidence. Onto Innovation’s target consensus near 192 is slightly above its 185 price, reflecting cautious optimism amid recent volatility.

Don’t Let Luck Decide Your Entry Point
Optimize your entry points with our advanced ProRealTime indicators. You’ll get efficient buy signals with precise price targets for maximum performance. Start outperforming now!
How do institutions grade them?
The following tables summarize recent institutional grades for NXP Semiconductors N.V. and Onto Innovation Inc.:
NXP Semiconductors N.V. Grades
This table shows the latest grades and rating actions from major financial institutions for NXP Semiconductors N.V.
| Grading Company | Action | New Grade | Date |
|---|---|---|---|
| Evercore ISI Group | maintain | Outperform | 2026-02-04 |
| B of A Securities | maintain | Buy | 2026-02-04 |
| Truist Securities | maintain | Buy | 2026-02-04 |
| Mizuho | maintain | Outperform | 2026-02-04 |
| Citigroup | maintain | Buy | 2026-02-04 |
| JP Morgan | maintain | Neutral | 2026-02-04 |
| Needham | maintain | Buy | 2026-02-03 |
| Citigroup | maintain | Buy | 2026-01-15 |
| Wells Fargo | maintain | Overweight | 2026-01-15 |
| Truist Securities | maintain | Buy | 2025-12-19 |
Onto Innovation Inc. Grades
This table shows the latest grades and rating actions from major financial institutions for Onto Innovation Inc.
| Grading Company | Action | New Grade | Date |
|---|---|---|---|
| Needham | maintain | Buy | 2026-01-20 |
| B. Riley Securities | maintain | Buy | 2026-01-15 |
| Stifel | maintain | Hold | 2026-01-14 |
| Needham | maintain | Buy | 2026-01-06 |
| Jefferies | maintain | Buy | 2025-12-15 |
| Needham | maintain | Buy | 2025-11-18 |
| B. Riley Securities | maintain | Buy | 2025-11-18 |
| Evercore ISI Group | maintain | Outperform | 2025-11-05 |
| Oppenheimer | maintain | Outperform | 2025-10-14 |
| Stifel | maintain | Hold | 2025-10-13 |
Which company has the best grades?
NXP Semiconductors N.V. consistently receives strong buy and outperform ratings from top firms. Onto Innovation Inc. also earns mostly buy ratings but includes some hold grades. Investors may view NXP’s more unanimous positive grades as a sign of higher institutional confidence.
Risks specific to each company
The following categories identify the critical pressure points and systemic threats facing both firms in the 2026 market environment:
1. Market & Competition
NXP Semiconductors N.V.
- Operates globally with a broad product portfolio, facing intense competition in semiconductors.
Onto Innovation Inc.
- Smaller scale and focused niche in process control tools, competing in specialized semiconductor segments.
2. Capital Structure & Debt
NXP Semiconductors N.V.
- High debt-to-equity ratio (1.22) raises leverage risk despite strong interest coverage.
Onto Innovation Inc.
- Minimal debt (0.01 D/E), indicating a conservative capital structure and lower financial risk.
3. Stock Volatility
NXP Semiconductors N.V.
- Beta at 1.458 indicates higher volatility than the market, implying elevated market risk.
Onto Innovation Inc.
- Slightly higher beta of 1.48 signals similar or marginally higher stock price swings.
4. Regulatory & Legal
NXP Semiconductors N.V.
- Exposed to multinational regulatory regimes, including EU and China, increasing compliance complexity.
Onto Innovation Inc.
- US-centric regulatory exposure with potential risks from evolving domestic semiconductor policies.
5. Supply Chain & Operations
NXP Semiconductors N.V.
- Extensive global supply chain vulnerable to geopolitical disruptions and component shortages.
Onto Innovation Inc.
- More localized operations reduce some supply chain risks but increase dependency on specific suppliers.
6. ESG & Climate Transition
NXP Semiconductors N.V.
- Larger footprint requires significant investment in ESG initiatives to meet international standards.
Onto Innovation Inc.
- Smaller scale may ease ESG compliance but limited resources could hamper proactive climate transition efforts.
7. Geopolitical Exposure
NXP Semiconductors N.V.
- Broad international presence exposes it to geopolitical tensions, especially US-China trade conflicts.
Onto Innovation Inc.
- Primarily US-based, with lower direct geopolitical risk but still vulnerable to global semiconductor market volatility.
Which company shows a better risk-adjusted profile?
NXP Semiconductors faces significant leverage and geopolitical risks but benefits from a diversified global presence and stable operating metrics. Onto Innovation has a cleaner balance sheet and lower financial risk but struggles with higher valuation multiples and operational concentration. The most impactful risk for NXP is its elevated debt load, increasing financial vulnerability amid market volatility. For Onto, the reliance on niche markets and higher P/E ratio raise valuation and growth execution concerns. I observe that Onto’s exceptionally low debt reduces bankruptcy risk, yet its large price swings and valuation temper enthusiasm. Overall, NXP presents a slightly better risk-adjusted profile due to scale and diversified operations, despite higher leverage.
Final Verdict: Which stock to choose?
NXP Semiconductors N.V. (NXPI) stands out for its robust operational efficiency and strong profitability metrics, embodying a cash-generating powerhouse. Its declining ROIC and elevated leverage, however, are points of vigilance. NXPI suits investors seeking aggressive growth with tolerance for cyclical volatility.
Onto Innovation Inc. (ONTO) leverages a strategic moat built on recurring revenue and a pristine balance sheet, offering a safer harbor amid market turbulence. While its valuation appears rich, Onto’s accelerating profitability and low debt profile align well with GARP portfolios emphasizing steady growth and risk management.
If you prioritize high operational efficiency and are comfortable with leverage-driven growth, NXPI is the compelling choice due to its strong cash flow generation. However, if you seek superior balance sheet stability and a growing moat, ONTO offers better stability with promising profitability trends. Both present distinct risk-return profiles demanding careful alignment with your investment strategy.
Disclaimer: Investment carries a risk of loss of initial capital. The past performance is not a reliable indicator of future results. Be sure to understand risks before making an investment decision.
Go Further
I encourage you to read the complete analyses of NXP Semiconductors N.V. and Onto Innovation Inc. to enhance your investment decisions: