Home > Comparison > Technology > NXPI vs ON
The strategic rivalry between NXP Semiconductors N.V. and ON Semiconductor Corporation shapes the semiconductor industry’s future. NXP operates as a broad-based technology innovator, specializing in microcontrollers and connectivity solutions, while ON Semiconductor focuses on intelligent power and sensing technologies, especially in automotive electrification. This clash highlights a contest between diversified innovation and targeted power solutions. This analysis aims to identify which trajectory offers superior risk-adjusted returns for a diversified portfolio in 2026.
Table of contents
Companies Overview
NXP Semiconductors and ON Semiconductor dominate key segments of the global semiconductor market.
NXP Semiconductors N.V.: Global Leader in Mixed-Signal & Connectivity Solutions
NXP Semiconductors is a technology giant specializing in mixed-signal semiconductor products. Its revenue flows primarily from microcontrollers, application processors, wireless connectivity, and security controllers. In 2026, NXP strategically focuses on expanding its automotive and industrial IoT applications, leveraging its broad product portfolio to solidify its leadership in connected devices.
ON Semiconductor Corporation: Power and Sensing Innovator
ON Semiconductor excels in providing intelligent sensing and power solutions worldwide. Its core business centers on analog, discrete, and integrated semiconductor products that enable automotive electrification and sustainable energy systems. The company’s 2026 strategy prioritizes advancing power switching and signal processing technologies to support electric vehicle growth and renewable energy infrastructure.
Strategic Collision: Similarities & Divergences
Both firms thrive in semiconductors but embody distinct philosophies: NXP emphasizes diverse connectivity platforms, while ON sharpens focus on power efficiency and sensing. Their primary battleground is automotive electronics, where NXP’s broad ecosystem competes with ON’s specialized power solutions. Investors will find contrasting risk profiles—NXP’s broad diversification versus ON’s targeted innovation in electrification and sensing.
Income Statement Comparison
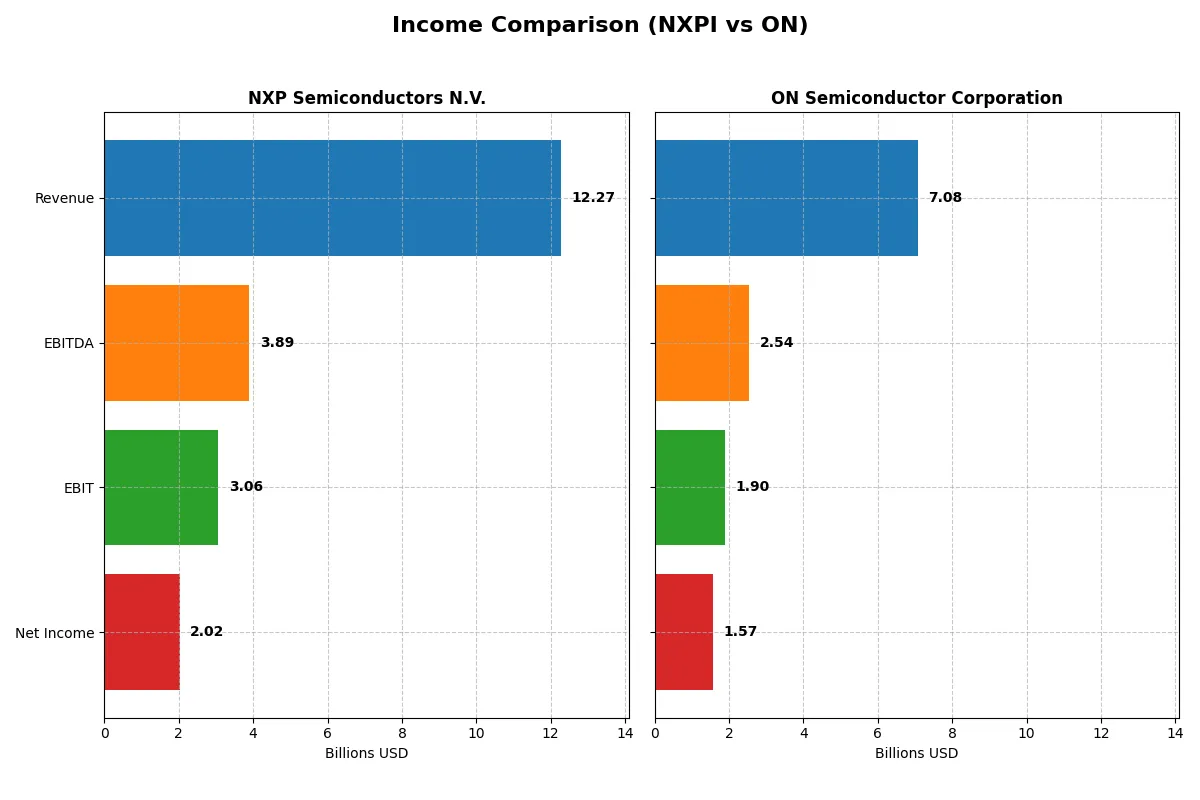
This data dissects the core profitability and scalability of both corporate engines to reveal who dominates the bottom line:
| Metric | NXP Semiconductors N.V. (NXPI) | ON Semiconductor Corporation (ON) |
|---|---|---|
| Revenue | 12.3B | 7.1B |
| Cost of Revenue | 5.6B | 3.9B |
| Operating Expenses | 3.4B | 1.4B |
| Gross Profit | 6.7B | 3.2B |
| EBITDA | 3.9B | 2.5B |
| EBIT | 3.1B | 1.9B |
| Interest Expense | 384M | 62M |
| Net Income | 2.0B | 1.6B |
| EPS | 8.00 | 3.68 |
| Fiscal Year | 2025 | 2024 |
Income Statement Analysis: The Bottom-Line Duel
This income statement comparison reveals how efficiently each company converts revenue into profit and sustains margin strength amid market shifts.
NXP Semiconductors N.V. Analysis
NXP’s revenue edged down 2.7% to $12.3B in 2025, with net income falling 19% to $2B, reflecting margin pressure. Its gross margin remains strong at 54.4%, but net margin declined to 16.5%. Despite a recent slowdown, NXP sustains favorable margin ratios, signaling resilient operational efficiency.
ON Semiconductor Corporation Analysis
ON’s 2024 revenue contracted 14.2% to $7.1B, with net income dipping 28% to $1.57B, reflecting significant margin compression. Gross margin stands at 45.4%, while net margin impresses at 22.2%. Despite recent setbacks, ON’s superior net margin highlights better bottom-line control amid sharper revenue declines.
Margin Strength vs. Revenue Scale
NXP commands higher revenue and gross margin but endures margin erosion with declining net income. ON posts a smaller revenue base yet maintains a stronger net margin and more substantial net income growth over time. For investors, NXP offers scale with steady margins, while ON presents tighter profit control despite a more volatile top line.
Financial Ratios Comparison
These vital ratios act as a diagnostic tool to expose the underlying fiscal health, valuation premiums, and capital efficiency of the companies compared:
| Ratios | NXP Semiconductors N.V. (NXPI) | ON Semiconductor Corporation (ON) |
|---|---|---|
| ROE | 20.1% | 17.9% |
| ROIC | 11.0% | 11.9% |
| P/E | 27.1 | 17.1 |
| P/B | 5.45 | 3.06 |
| Current Ratio | 2.05 | 5.06 |
| Quick Ratio | 1.38 | 3.38 |
| D/E (Debt-to-Equity) | 1.22 | 0.38 |
| Debt-to-Assets | 46.0% | 23.9% |
| Interest Coverage | 8.62 | 28.4 |
| Asset Turnover | 0.46 | 0.50 |
| Fixed Asset Turnover | 4.12 | 1.61 |
| Payout ratio | 50.7% | 0% |
| Dividend yield | 1.87% | 0% |
| Fiscal Year | 2025 | 2024 |
Efficiency & Valuation Duel: The Vital Signs
Financial ratios serve as a company’s DNA, unveiling operational strength and hidden risks critical for informed investing decisions.
NXP Semiconductors N.V.
NXP shows robust profitability with a 20.1% ROE and a net margin of 16.47%, signaling operational efficiency. Its valuation appears stretched, with a high P/E of 27.14 and P/B of 5.45, suggesting premium pricing. The company balances this by returning value via a 1.87% dividend yield, indicating modest shareholder rewards.
ON Semiconductor Corporation
ON Semiconductor delivers a strong 22.21% net margin and solid 17.88% ROE, reflecting efficient operations. Its valuation is more attractive, with a moderate P/E of 17.13 and lower P/B of 3.06, though the current ratio flags a potential liquidity concern. The absence of dividends suggests reinvestment focused on growth and operational expansion.
Premium Valuation vs. Operational Safety
NXP’s higher multiples highlight premium pricing but offer steady dividends, while ON trades at a discount with stronger liquidity and growth focus. ON’s profile fits investors prioritizing operational safety and reinvestment, whereas NXP appeals to those accepting valuation risk for income.
Which one offers the Superior Shareholder Reward?
I compare NXP Semiconductors (NXPI) and ON Semiconductor (ON) on dividends, buybacks, and sustainability. NXPI pays a 1.87% dividend yield with a 51% payout ratio and covers dividends well with free cash flow (9.6B). It also runs moderate buybacks, enhancing shareholder returns sustainably. ON pays no dividends, investing heavily in growth with a lower free cash flow per share (2.8B) and strong operating margins. ON’s aggressive reinvestment and low leverage support future expansion but lack immediate shareholder payouts. For 2026, I find NXPI’s balanced dividend and buyback strategy offers a superior total return profile compared to ON’s growth-focused but non-distributive model.
Comparative Score Analysis: The Strategic Profile
The radar chart reveals the fundamental DNA and trade-offs of NXP Semiconductors N.V. and ON Semiconductor Corporation, showcasing their competitive strengths and weaknesses:
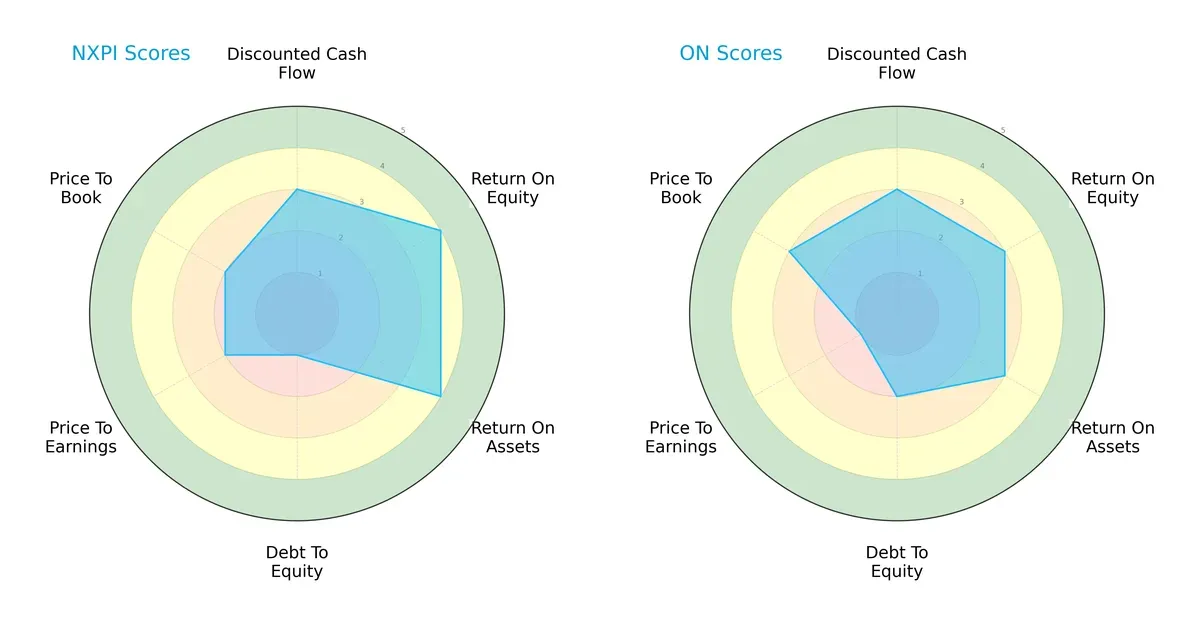
NXP exhibits superior returns with ROE and ROA scores at 4 versus ON’s 3, reflecting better asset and equity efficiency. ON maintains a healthier debt profile, scoring 2 to NXP’s 1, signaling lower financial risk. Valuation metrics show mixed signals: ON scores higher on price-to-book but lags on price-to-earnings. Overall, NXP’s profile is more skewed towards operational efficiency while ON offers a more balanced risk posture.
Bankruptcy Risk: Solvency Showdown
The Altman Z-Score comparison highlights ON Semiconductor’s stronger solvency standing at 4.79, comfortably in the safe zone, versus NXP’s 3.10, also safe but closer to the grey area:

ON’s higher score signals better financial stability and a lower bankruptcy risk amid cyclical headwinds. NXP remains solvent but with less buffer, cautioning investors to monitor leverage and liquidity closely.
Financial Health: Quality of Operations
Piotroski F-Scores show ON Semiconductor marginally ahead with 6 versus NXP’s 5, both in the average range but indicating some internal operational strengths for ON:
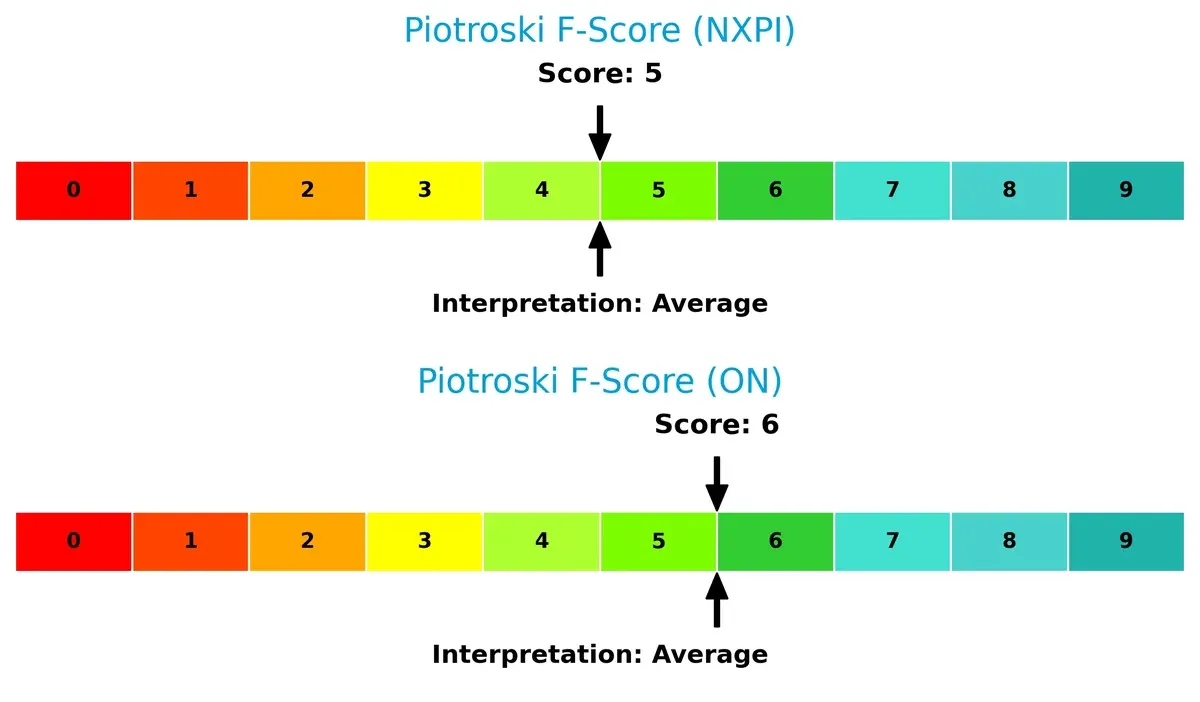
Neither company scores in peak financial health territory, but ON’s higher score suggests fewer red flags in profitability, leverage, and efficiency. NXP’s lower score warrants scrutiny of its internal financial metrics before committing capital.
How are the two companies positioned?
This section dissects NXPI and ON’s operational DNA by comparing revenue distribution and internal dynamics, including strengths and weaknesses. The goal is to confront their economic moats and identify which model offers the most resilient competitive advantage today.
Revenue Segmentation: The Strategic Mix
This visual comparison dissects how NXP Semiconductors and ON Semiconductor diversify income streams and reveals their primary sector bets:
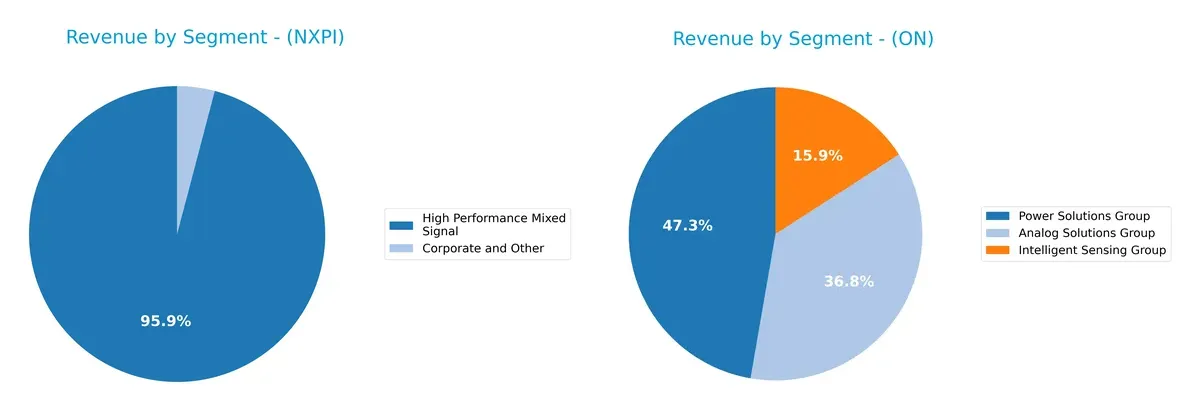
NXP Semiconductors anchors revenue in High Performance Mixed Signal, generating $9B in 2018 and dwarfing other segments. ON Semiconductor shows a more balanced mix in 2024, with Power Solutions at $3.3B, Analog Solutions at $2.6B, and Intelligent Sensing at $1.1B. NXP’s heavy reliance on one segment signals concentration risk, while ON’s diversified portfolio supports resilience and cross-market leverage.
Strengths and Weaknesses Comparison
This table compares the Strengths and Weaknesses of NXP Semiconductors N.V. and ON Semiconductor Corporation:
NXP Semiconductors N.V. Strengths
- Favorable net margin and ROE indicating strong profitability
- Balanced current and quick ratios support liquidity
- High fixed asset turnover shows efficient asset use
- Diverse geographic revenue with strong presence in China and US
ON Semiconductor Corporation Strengths
- Higher net margin and solid ROIC above WACC
- Low debt-to-equity and debt-to-assets ratios reduce financial risk
- Exceptional interest coverage ratio
- Broader product segmentation across three main groups
NXP Semiconductors N.V. Weaknesses
- Elevated PE and PB ratios may signal overvaluation
- Higher debt-to-equity ratio than ON
- Asset turnover below 0.5 suggests less efficient asset use
- Some geographic revenue concentration risk in China and US
ON Semiconductor Corporation Weaknesses
- Unfavorable current ratio indicates liquidity challenges
- PB ratio unfavorable despite lower PE
- Dividend yield is zero, possibly limiting income appeal
- WACC exceeds ROIC, signaling less optimal capital allocation
Both companies maintain slightly favorable financial profiles with balanced strengths in profitability and product diversity. However, NXP faces valuation and leverage concerns while ON must manage liquidity risks and capital efficiency for sustainable growth.
The Moat Duel: Analyzing Competitive Defensibility
A structural moat is the only true shield defending long-term profits from relentless competitive erosion:
NXP Semiconductors N.V.: Intangible Assets Moat
NXP relies on proprietary technologies and broad product portfolios that sustain 54% gross margins and stable EBIT margins. Its automotive and IoT footholds face pressure but offer expansion opportunities in 2026.
ON Semiconductor Corporation: Cost Advantage Moat
ON leverages efficient power solutions and scale to drive superior net margins above 22%. Unlike NXP, ON’s rising ROIC signals improving capital efficiency and potential to disrupt with electrification trends.
Intangible Assets vs. Cost Leadership: Who Holds the Fortress?
NXP’s intangible asset moat delivers high margins but declining ROIC warns of margin pressure. ON’s cost advantage shows margin strength and a rising ROIC trend, granting it a deeper moat. I see ON better positioned to defend and expand its market share in the evolving semiconductor landscape.
Which stock offers better returns?
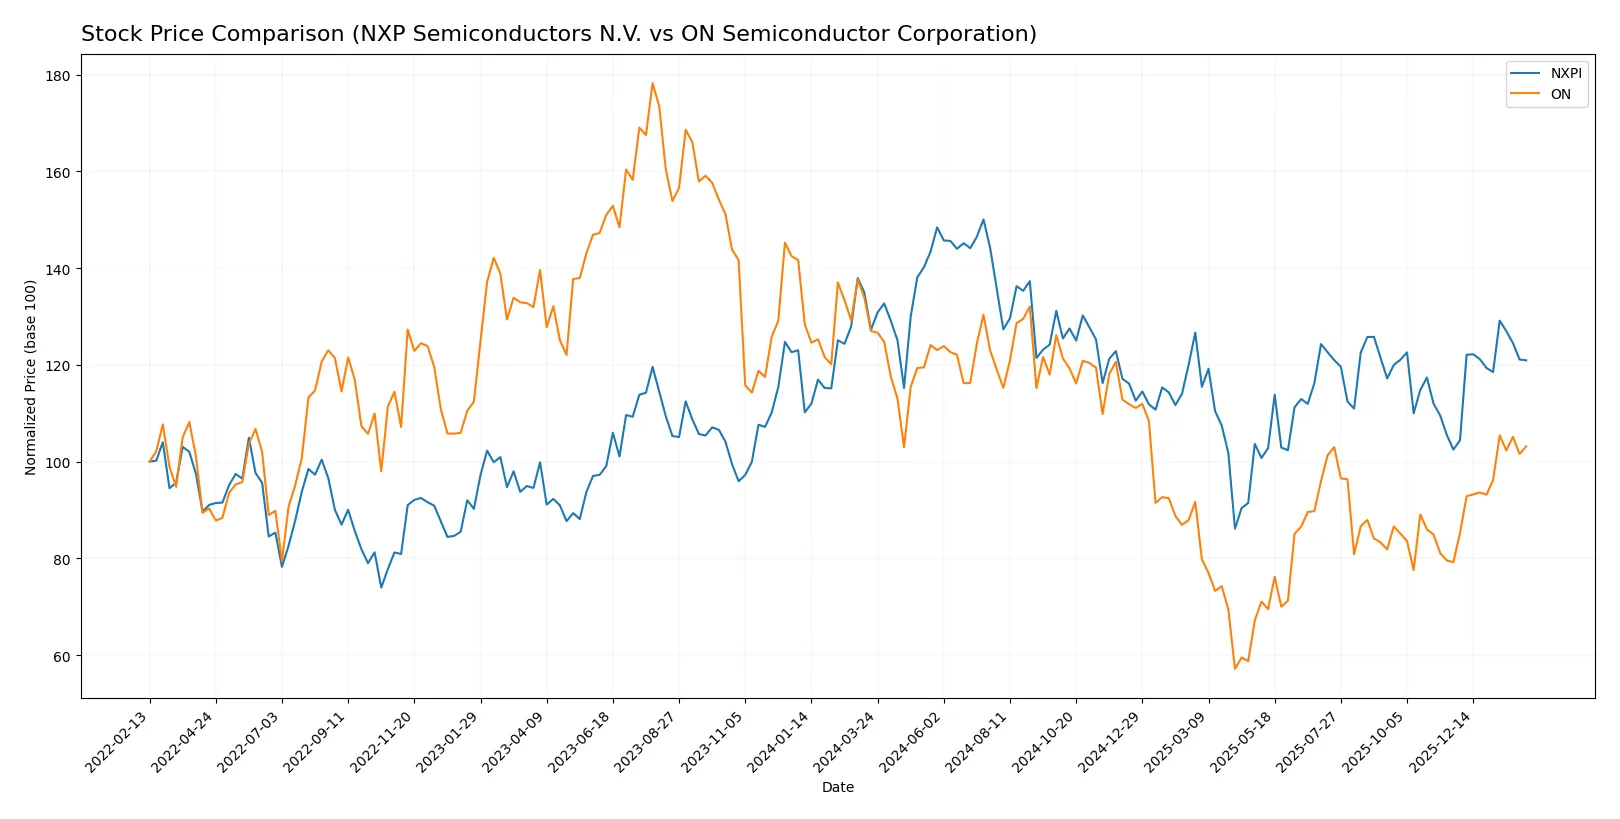
The past year highlights divergent dynamics: NXP Semiconductors shows a bearish trend with accelerating decline, while ON Semiconductor’s steeper fall also gains recent upward momentum.
Trend Comparison
NXP Semiconductors declined 4.94% overall, marking a bearish trend with accelerating losses between 160.81 and 280.19. Recent months reversed this with an 18.01% gain and increased volatility.
ON Semiconductor fell 18.78%, experiencing accelerating bearish momentum from 33.7 to 77.87. Its recent trend shows a 30.21% rise but with lower volatility compared to the earlier period.
ON Semiconductor’s overall loss exceeds NXP’s, yet ON’s recent recovery outpaces NXP’s, delivering stronger short-term market performance.
Target Prices
Analysts present a moderately bullish consensus for NXP Semiconductors and ON Semiconductor.
| Company | Target Low | Target High | Consensus |
|---|---|---|---|
| NXP Semiconductors N.V. | 215 | 280 | 250 |
| ON Semiconductor Corporation | 51 | 64 | 59.25 |
NXP’s target consensus of 250 suggests roughly 11% upside from its 225 current price. ON’s consensus at 59.25 aligns closely with its 61 stock price, indicating limited near-term upside.

Don’t Let Luck Decide Your Entry Point
Optimize your entry points with our advanced ProRealTime indicators. You’ll get efficient buy signals with precise price targets for maximum performance. Start outperforming now!
How do institutions grade them?
This section compares the latest institutional grades for NXP Semiconductors N.V. and ON Semiconductor Corporation:
NXP Semiconductors N.V. Grades
The following table summarizes recent grades from reputable financial institutions for NXP Semiconductors N.V.:
| Grading Company | Action | New Grade | Date |
|---|---|---|---|
| Evercore ISI Group | Maintain | Outperform | 2026-02-04 |
| B of A Securities | Maintain | Buy | 2026-02-04 |
| Truist Securities | Maintain | Buy | 2026-02-04 |
| Mizuho | Maintain | Outperform | 2026-02-04 |
| Citigroup | Maintain | Buy | 2026-02-04 |
| JP Morgan | Maintain | Neutral | 2026-02-04 |
| Needham | Maintain | Buy | 2026-02-03 |
| Citigroup | Maintain | Buy | 2026-01-15 |
| Wells Fargo | Maintain | Overweight | 2026-01-15 |
| Truist Securities | Maintain | Buy | 2025-12-19 |
ON Semiconductor Corporation Grades
The following table lists recent institutional grades for ON Semiconductor Corporation:
| Grading Company | Action | New Grade | Date |
|---|---|---|---|
| B of A Securities | Maintain | Neutral | 2026-01-21 |
| B. Riley Securities | Maintain | Neutral | 2026-01-20 |
| Stifel | Maintain | Hold | 2026-01-16 |
| Citigroup | Maintain | Neutral | 2026-01-15 |
| Wells Fargo | Maintain | Overweight | 2026-01-15 |
| Piper Sandler | Maintain | Overweight | 2026-01-07 |
| Truist Securities | Maintain | Hold | 2025-12-19 |
| Morgan Stanley | Maintain | Equal Weight | 2025-11-24 |
| Truist Securities | Maintain | Hold | 2025-11-04 |
| Morgan Stanley | Maintain | Equal Weight | 2025-11-04 |
Which company has the best grades?
NXP Semiconductors consistently receives higher grades, including multiple “Buy” and “Outperform” ratings. ON Semiconductor’s grades cluster around “Neutral,” “Hold,” and “Overweight.” This suggests investors perceive NXP as having stronger near-term prospects, potentially impacting portfolio positioning.
Risks specific to each company
The following categories identify the critical pressure points and systemic threats facing both firms in the 2026 market environment:
1. Market & Competition
NXP Semiconductors N.V.
- Operates globally with diverse product portfolio but faces intense semiconductor industry rivalry.
ON Semiconductor Corporation
- Focuses on power solutions and sensing with rising competition in automotive electrification.
2. Capital Structure & Debt
NXP Semiconductors N.V.
- Debt-to-equity ratio is high at 1.22, indicating elevated financial leverage risk.
ON Semiconductor Corporation
- Maintains low debt-to-equity at 0.38, reflecting prudent capital structure and lower financial risk.
3. Stock Volatility
NXP Semiconductors N.V.
- Beta of 1.46 signals above-market volatility, increasing investment risk.
ON Semiconductor Corporation
- Higher beta of 1.54 implies even greater price swings and market sensitivity.
4. Regulatory & Legal
NXP Semiconductors N.V.
- Subject to global tech regulations, with exposure in China and Europe adding complexity.
ON Semiconductor Corporation
- Faces regulatory scrutiny in US and international markets, especially on export controls.
5. Supply Chain & Operations
NXP Semiconductors N.V.
- Operates in multiple countries, vulnerable to supply chain disruptions amid geopolitical tensions.
ON Semiconductor Corporation
- Relies on diversified supply chain but exposed to semiconductor material shortages and logistics risks.
6. ESG & Climate Transition
NXP Semiconductors N.V.
- Increasing pressure to meet sustainability goals and reduce carbon footprint globally.
ON Semiconductor Corporation
- Focuses on enabling electrification and sustainable energy but must manage ESG compliance costs.
7. Geopolitical Exposure
NXP Semiconductors N.V.
- Significant exposure to China and EU markets, posing geopolitical and trade risk.
ON Semiconductor Corporation
- US-based with exposure to global markets; geopolitical tensions may disrupt supply and sales.
Which company shows a better risk-adjusted profile?
NXP’s most impactful risk is its high financial leverage, which increases vulnerability during downturns. ON’s key risk lies in its elevated stock volatility and regulatory complexity in the US market. Despite higher debt, NXP maintains favorable profitability and operational metrics, while ON benefits from a stronger balance sheet but faces greater market price swings. Recent data show ON’s debt-to-equity is nearly three times lower than NXP’s, highlighting better financial stability. Overall, I see ON Semiconductor offering a superior risk-adjusted profile due to lower leverage and stronger liquidity despite higher market volatility.
Final Verdict: Which stock to choose?
NXP Semiconductors N.V. (NXPI) excels as a cash-generating powerhouse with strong operating efficiency and a solid return on equity. Its key vigilance point is a high debt-to-equity ratio, which could pressure financial flexibility. NXPI suits portfolios targeting aggressive growth with a tolerance for leverage risk.
ON Semiconductor Corporation (ON) boasts a strategic moat grounded in steadily improving profitability and a stronger balance sheet. It offers better safety metrics, including low leverage and superior interest coverage, compared to NXPI. ON fits well within Growth at a Reasonable Price (GARP) portfolios seeking stable expansion.
If you prioritize aggressive growth and can tolerate elevated leverage, NXPI is the compelling choice due to its robust cash flow generation and operational efficiency. However, if you seek better financial stability and a steadily improving moat, ON offers superior risk management and a cleaner balance sheet, commanding a premium on safety.
Disclaimer: Investment carries a risk of loss of initial capital. The past performance is not a reliable indicator of future results. Be sure to understand risks before making an investment decision.
Go Further
I encourage you to read the complete analyses of NXP Semiconductors N.V. and ON Semiconductor Corporation to enhance your investment decisions: