Home > Comparison > Technology > NXPI vs NVMI
The strategic rivalry between NXP Semiconductors N.V. and Nova Ltd. shapes the semiconductor industry’s evolution. NXP operates as a broad-based technology powerhouse with a diverse product portfolio spanning microcontrollers to wireless connectivity. In contrast, Nova specializes as a niche process control systems provider focused on semiconductor manufacturing precision. This head-to-head pits scale and product breadth against targeted innovation. This analysis aims to identify which corporate trajectory offers superior risk-adjusted returns for diversified investors.

Table of contents
Companies Overview
NXP Semiconductors and Nova Ltd. stand as pivotal players in the semiconductor industry, shaping critical technology trends globally.
NXP Semiconductors N.V.: Global Semiconductor Powerhouse
NXP Semiconductors dominates with a broad product portfolio including microcontrollers, application processors, and wireless connectivity solutions. Its revenue relies heavily on supplying automotive, industrial, and IoT markets. In 2026, NXP emphasizes expanding its automotive semiconductor footprint and advancing secure connectivity technology worldwide.
Nova Ltd.: Precision Process Control Innovator
Nova Ltd. specializes in process control systems for semiconductor manufacturing, focusing on metrology platforms that optimize lithography, etch, and deposition steps. Revenue stems from serving integrated circuit makers globally. The company’s 2026 strategy prioritizes enhancing advanced packaging metrology to support cutting-edge chip fabrication technologies.
Strategic Collision: Similarities & Divergences
Both companies operate in semiconductors but differ sharply in focus: NXP pursues a broad product ecosystem, while Nova targets niche process control solutions. Their primary battleground is the semiconductor value chain—NXP in end-product components, Nova in manufacturing precision. This contrast defines their distinct investment profiles: broad industrial scale versus specialized technological depth.
Income Statement Comparison
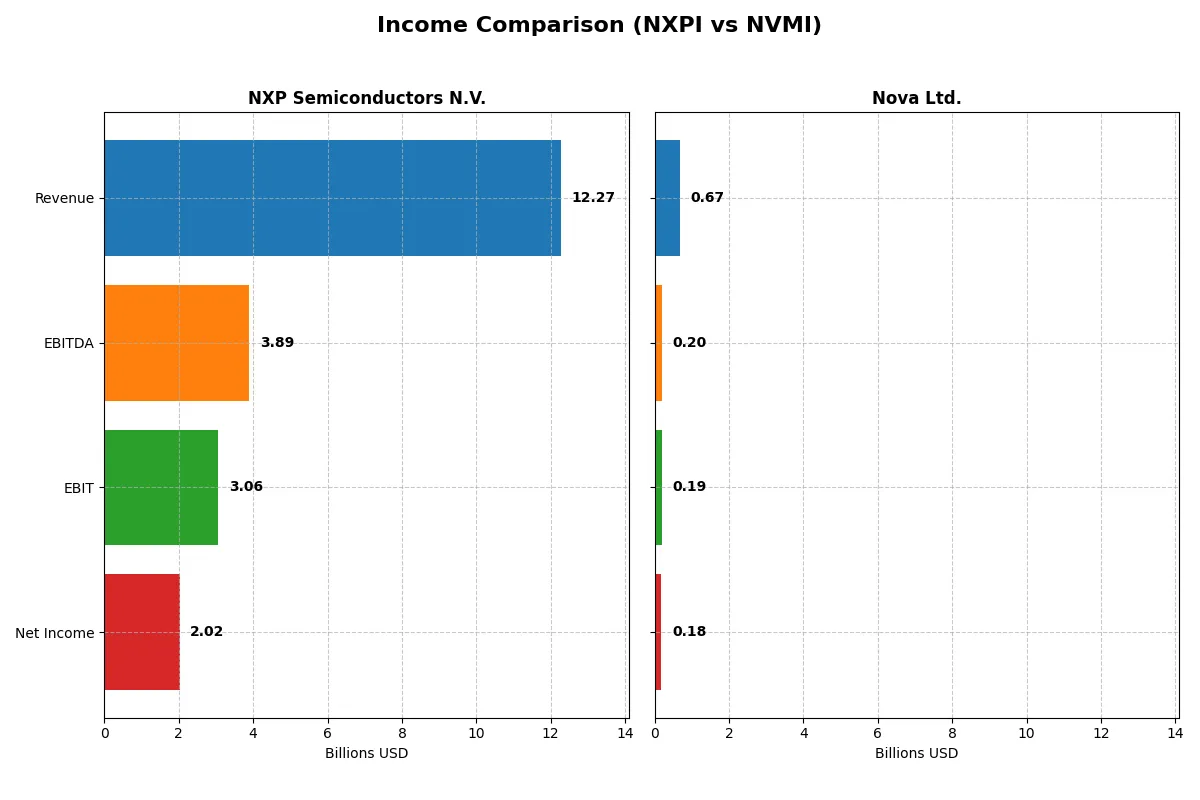
This data dissects the core profitability and scalability of both corporate engines to reveal who dominates the bottom line:
| Metric | NXP Semiconductors N.V. (NXPI) | Nova Ltd. (NVMI) |
|---|---|---|
| Revenue | 12.3B | 672M |
| Cost of Revenue | 5.6B | 285M |
| Operating Expenses | 3.4B | 200M |
| Gross Profit | 6.7B | 387M |
| EBITDA | 3.9B | 205M |
| EBIT | 3.1B | 188M |
| Interest Expense | 384M | 1.6M |
| Net Income | 2.0B | 184.9M |
| EPS | 8.00 | 6.31 |
| Fiscal Year | 2025 | 2024 |
Income Statement Analysis: The Bottom-Line Duel
This income statement comparison reveals which company drives greater operational efficiency and profit momentum through its core business engine.
NXP Semiconductors N.V. Analysis
NXP’s revenue slightly declined to $12.3B in 2025, down 2.7% from 2024, while net income fell 19.5% to $2.0B. The firm maintains solid gross and net margins near 54.4% and 16.5%, respectively, reflecting efficient cost control despite shrinking top-line. However, recent margin contraction signals pressure on profitability and earnings momentum.
Nova Ltd. Analysis
Nova’s revenue surged 29.8% to $672M in 2024, with net income rising 34.3% to $184M. Gross margin expanded to 57.6%, and net margin stands robust at 27.3%. This growth reflects strong operational leverage and disciplined capital allocation, propelling Nova’s earnings and margin expansion consistently over the past years.
Growth Momentum vs. Margin Strength
Nova outpaces NXP with superior revenue and net income growth, alongside higher margins. While NXP boasts scale and stable profitability, its recent declines raise caution. Nova’s accelerating top-line and margin gains present a compelling growth profile, appealing more to investors favoring dynamic earnings expansion and operational efficiency.
Financial Ratios Comparison
These vital ratios act as a diagnostic tool to expose the underlying fiscal health, valuation premiums, and capital efficiency of the companies analyzed:
| Ratios | NXP Semiconductors N.V. (NXPI) | Nova Ltd. (NVMI) |
|---|---|---|
| ROE | 20.1% | 19.8% |
| ROIC | 11.0% | 13.4% |
| P/E | 27.1 | 31.2 |
| P/B | 5.45 | 6.18 |
| Current Ratio | 2.05 | 2.32 |
| Quick Ratio | 1.38 | 1.92 |
| D/E | 1.22 | 0.25 |
| Debt-to-Assets | 46.0% | 17.0% |
| Interest Coverage | 8.62 | 116.2 |
| Asset Turnover | 0.46 | 0.48 |
| Fixed Asset Turnover | 4.12 | 5.06 |
| Payout ratio | 50.7% | 0% |
| Dividend yield | 1.87% | 0% |
| Fiscal Year | 2025 | 2024 |
Efficiency & Valuation Duel: The Vital Signs
Financial ratios act as the company’s DNA, exposing hidden risks and operational strengths essential for investment analysis.
NXP Semiconductors N.V.
NXP shows a strong 20.1% ROE and a solid 16.47% net margin, reflecting efficient profitability. However, its P/E of 27.14 and P/B of 5.45 indicate a stretched valuation. The company balances shareholder returns with a modest 1.87% dividend yield, signaling a cautious capital allocation approach amid moderate leverage.
Nova Ltd.
Nova delivers an impressive 27.33% net margin and a 19.81% ROE, highlighting robust profitability. Yet, its P/E of 31.2 and P/B of 6.18 suggest a premium valuation. The firm carries low debt and excellent interest coverage but offers no dividend, reinvesting aggressively in R&D to fuel growth and operational efficiency.
Premium Valuation vs. Operational Efficiency
Nova presents higher profitability and stronger balance sheet metrics but trades at a more demanding valuation than NXP. Meanwhile, NXP offers a balanced yield with solid returns but weaker leverage control. Investors seeking growth might prefer Nova’s reinvestment profile; those favoring income and moderate risk may lean toward NXP.
Which one offers the Superior Shareholder Reward?
I compare NXP Semiconductors (NXPI) and Nova Ltd. (NVMI) on dividends, buybacks, and sustainability. NXPI yields ~1.9% with a 51% payout ratio, well-covered by FCF (~86%), and steadily raises dividends plus meaningful buybacks. NVMI pays no dividends but reinvests aggressively, with a 93% free cash flow conversion, yet offers no buybacks. NXPI’s balanced distributions and buybacks suggest a more sustainable, attractive total return in 2026. NVMI’s growth focus suits risk-tolerant investors but lacks immediate shareholder reward. I favor NXPI for superior shareholder returns this year.
Comparative Score Analysis: The Strategic Profile
The radar chart reveals the fundamental DNA and trade-offs of NXP Semiconductors N.V. and Nova Ltd., highlighting their financial strengths and valuation approaches:
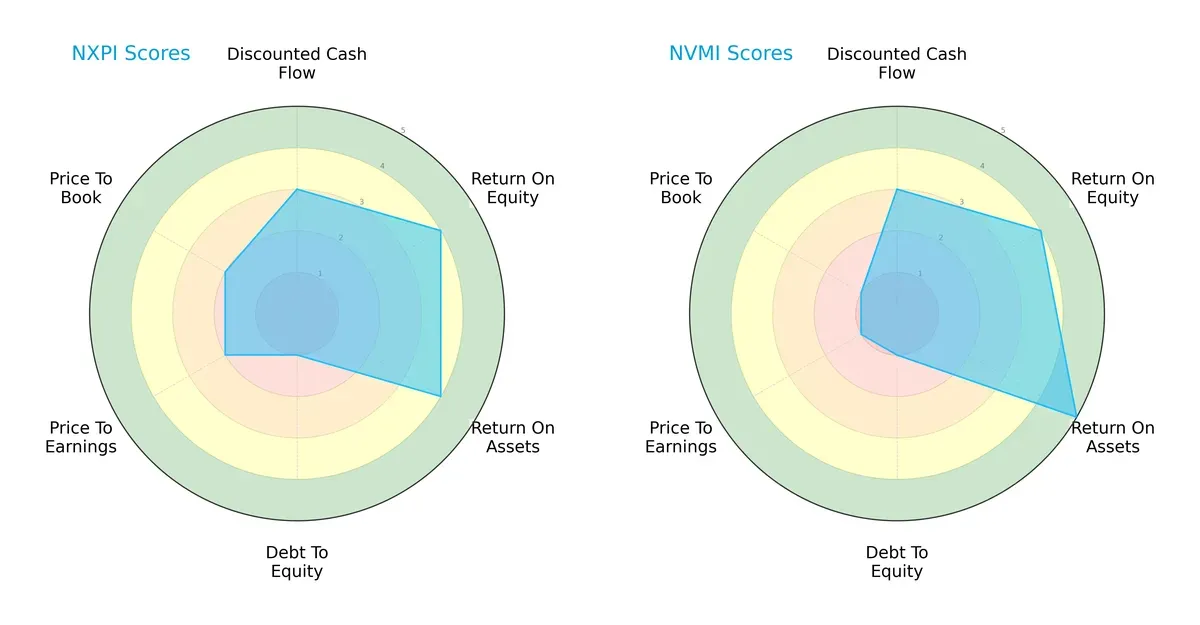
NXP Semiconductors and Nova Ltd. share similar overall and DCF scores, reflecting comparable cash flow outlooks. Both excel in return on equity, but Nova leads on return on assets, indicating superior asset efficiency. Each faces a significant red flag with very unfavorable debt-to-equity scores, signaling high leverage risk. Nova’s valuation scores (P/E and P/B) trail NXP’s, suggesting Nova’s shares might be more richly priced or less attractive from a value standpoint. Overall, NXP presents a more balanced profile, while Nova depends heavily on operational efficiency.
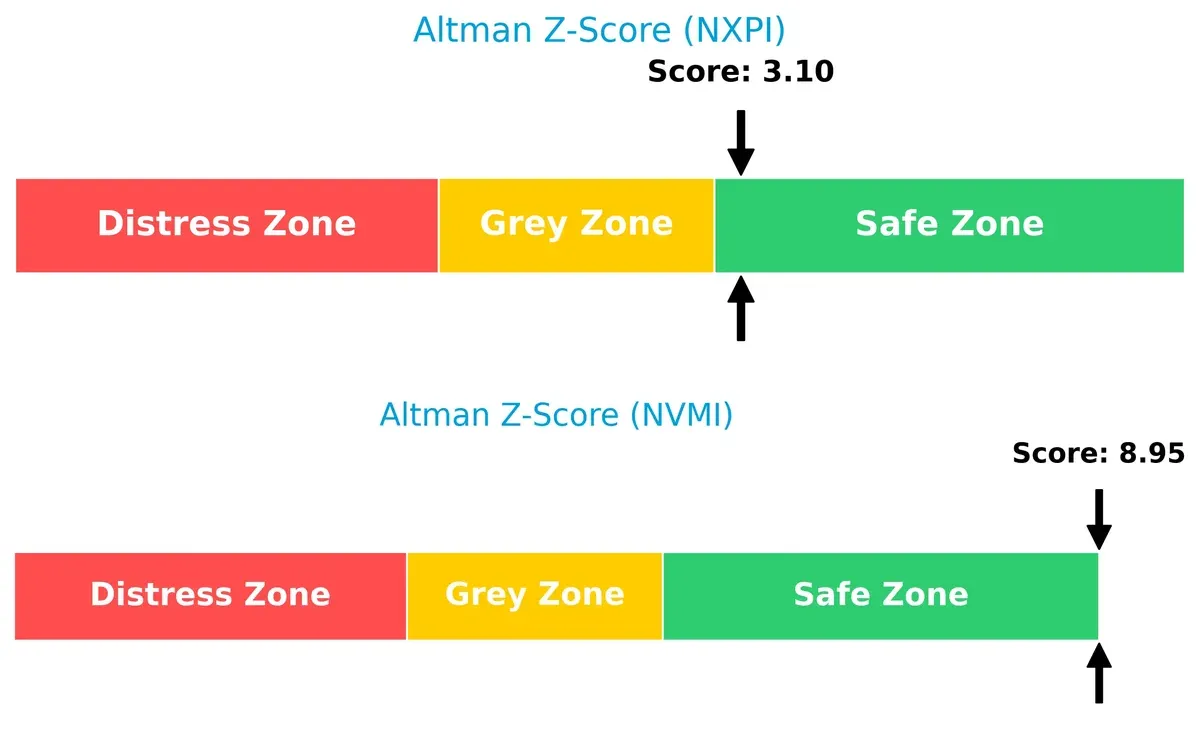
Bankruptcy Risk: Solvency Showdown
The Altman Z-Score difference between NXP (3.1) and Nova (8.95) indicates markedly stronger solvency for Nova Ltd. Both firms reside in the safe zone, but Nova’s higher score signals superior long-term survival odds in this cycle:
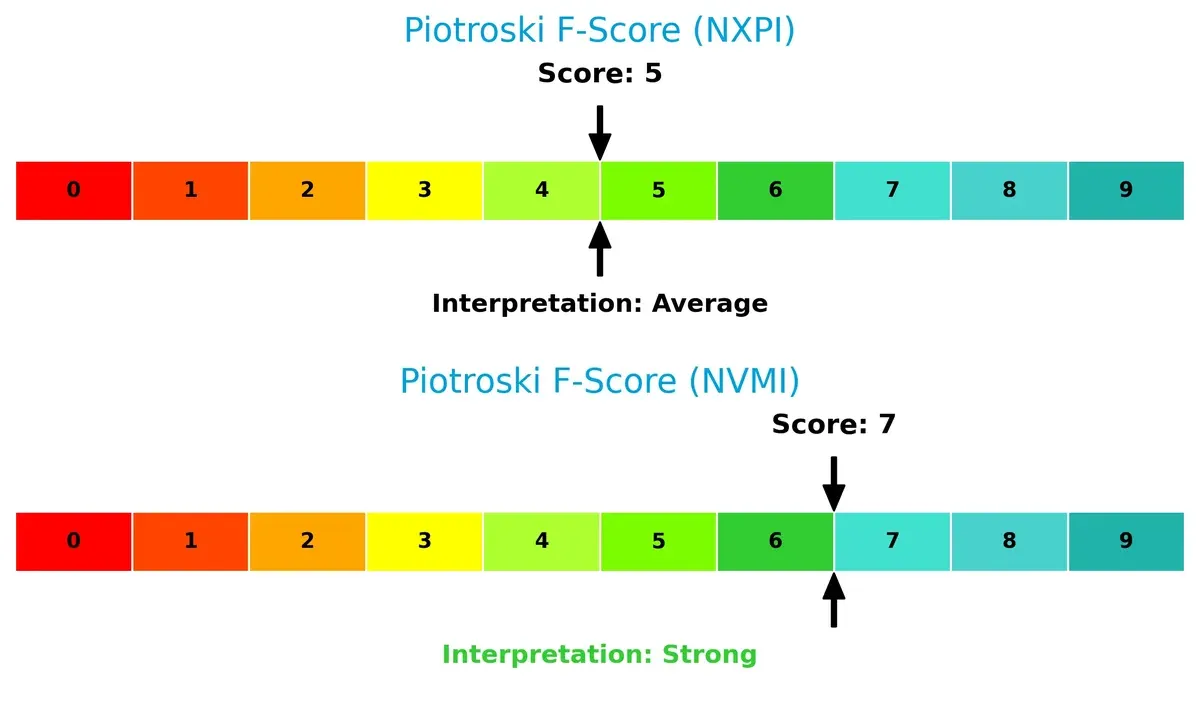
Financial Health: Quality of Operations
Nova Ltd. outperforms NXP with a Piotroski F-Score of 7 versus 5, reflecting stronger internal financial health. NXP’s average score suggests moderate operational quality, while Nova’s robust score indicates fewer red flags and better fundamentals:
How are the two companies positioned?
This section dissects the operational DNA of NXP and Nova by comparing their revenue distribution and internal dynamics, including strengths and weaknesses. The goal is to confront their economic moats to reveal which model delivers the most resilient, sustainable competitive advantage today.
Revenue Segmentation: The Strategic Mix
This visual comparison dissects how NXP Semiconductors N.V. and Nova Ltd. diversify their income streams and where their primary sector bets lie:
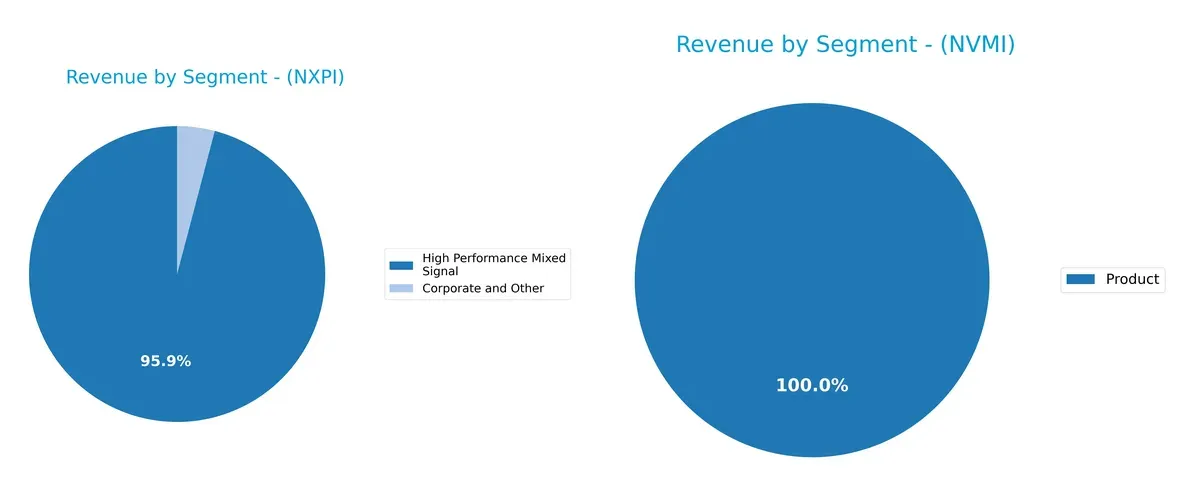
NXP Semiconductors anchors its revenue on High Performance Mixed Signal, generating $9B in 2018, dwarfing its Corporate and Other segment at $385M. This concentration signals a strong moat in specialized semiconductors but exposes it to single-sector risk. Nova Ltd. relies entirely on a single Product segment, with $538M in 2024 revenue, indicating a focused but undiversified business model, increasing vulnerability to market shifts.
Strengths and Weaknesses Comparison
This table compares the Strengths and Weaknesses of NXP Semiconductors N.V. and Nova Ltd.:
NXP Semiconductors N.V. Strengths
- Diverse product segments including high performance mixed signal and corporate
Nova Ltd. Strengths
- High net margin at 27.33%
- Favorable ROE and ROIC indicating efficient capital use
NXP Semiconductors N.V. Weaknesses
- Elevated debt-to-equity ratio at 1.22
- Unfavorable price-to-earnings and price-to-book ratios
- Asset turnover below 0.5
Nova Ltd. Weaknesses
- High weighted average cost of capital at 12.26%
- Zero dividend yield
- Elevated valuation multiples (PE 31.2, PB 6.18)
NXP demonstrates strength in product diversification and solid profitability metrics but carries relatively higher leverage and valuation concerns. Nova excels in profitability and low leverage but faces risks from high capital costs and absent dividend income.
The Moat Duel: Analyzing Competitive Defensibility
A structural moat alone protects long-term profits from relentless competitive erosion by locking in advantages that rivals cannot easily replicate:
NXP Semiconductors N.V.: Switching Costs and Product Integration
NXP’s moat stems from high switching costs embedded in its complex automotive and IoT semiconductor solutions. This translates into margin stability despite recent revenue softness. In 2026, expanding into security controllers could deepen its defensibility.
Nova Ltd.: Precision Metrology Expertise and Innovation
Nova’s moat relies on intangible assets—proprietary metrology technology critical for semiconductor manufacturing accuracy. Unlike NXP, Nova’s growing ROIC and rapid revenue gains underscore an expanding competitive edge. Opportunities lie in advanced packaging markets.
Moat Strength: Switching Costs vs. Intangible Assets
Nova’s rising profitability and innovation-driven moat outpace NXP’s declining returns and margin pressure. I see Nova better positioned to defend and grow market share amid increasing industry complexity.
Which stock offers better returns?
The past year shows stark contrasts: NXP Semiconductors N.V. trends lower with accelerating losses, while Nova Ltd. surges sharply, reflecting strong buyer dominance and volatility differences.
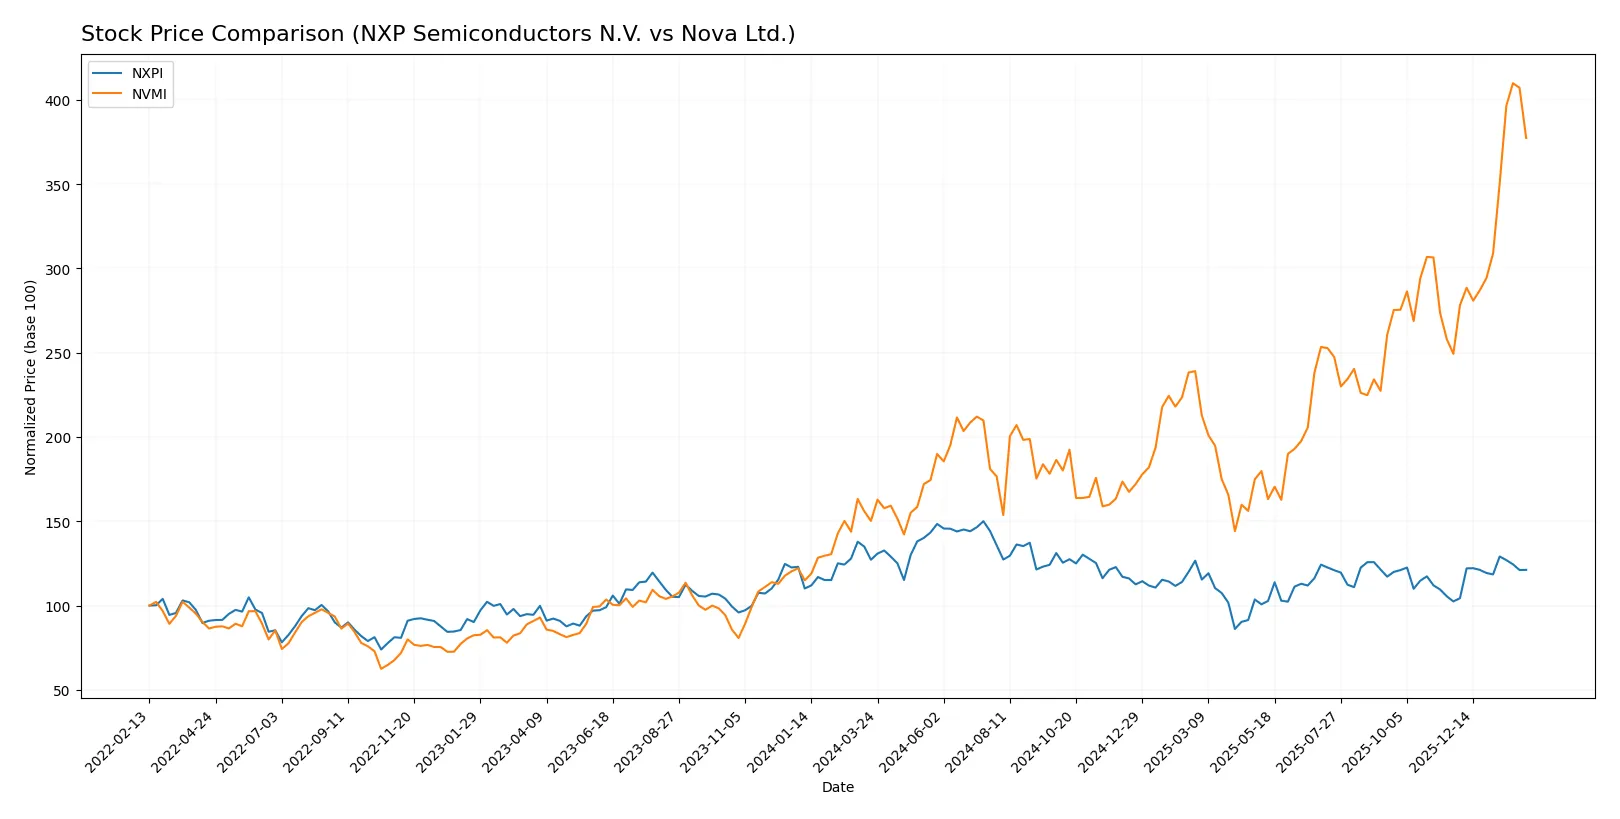
Trend Comparison
NXP Semiconductors N.V. records a -4.73% price decline over 12 months, signaling a bearish trend with accelerating downward momentum. The stock fluctuated between 160.81 and 280.19, showing moderate volatility (24.1 std dev).
Nova Ltd. exhibits a bullish trend, soaring 151.22% over the same period with accelerating gains. Price ranged from 159.92 to 460.91, accompanied by high volatility (66.01 std dev) and strong buyer dominance.
Comparing both, Nova Ltd. delivered substantially higher market performance, clearly outperforming NXP Semiconductors in total price appreciation and recent bullish momentum.
Target Prices
Analysts present a bullish consensus for both NXP Semiconductors N.V. and Nova Ltd., signaling growth potential in the semiconductor sector.
| Company | Target Low | Target High | Consensus |
|---|---|---|---|
| NXP Semiconductors N.V. | 215 | 280 | 250 |
| Nova Ltd. | 335 | 500 | 408.33 |
NXP’s consensus target of 250 exceeds the current price of 227, suggesting upside potential. Nova’s target consensus at 408.33 sits below its current price of 426, indicating a possible valuation peak or profit-taking zone ahead.

Don’t Let Luck Decide Your Entry Point
Optimize your entry points with our advanced ProRealTime indicators. You’ll get efficient buy signals with precise price targets for maximum performance. Start outperforming now!
How do institutions grade them?
The following tables summarize recent institutional grades for NXP Semiconductors N.V. and Nova Ltd.:
NXP Semiconductors N.V. Grades
This table lists recent grades from recognized financial institutions for NXP Semiconductors N.V.:
| Grading Company | Action | New Grade | Date |
|---|---|---|---|
| Mizuho | Maintain | Outperform | 2026-02-04 |
| Truist Securities | Maintain | Buy | 2026-02-04 |
| B of A Securities | Maintain | Buy | 2026-02-04 |
| Needham | Maintain | Buy | 2026-02-03 |
| Wells Fargo | Maintain | Overweight | 2026-01-15 |
| Citigroup | Maintain | Buy | 2026-01-15 |
| Truist Securities | Maintain | Buy | 2025-12-19 |
| JP Morgan | Maintain | Neutral | 2025-10-29 |
| Truist Securities | Maintain | Buy | 2025-10-29 |
| Susquehanna | Maintain | Neutral | 2025-07-23 |
Nova Ltd. Grades
This table presents recent grades from established grading firms for Nova Ltd.:
| Grading Company | Action | New Grade | Date |
|---|---|---|---|
| Needham | Upgrade | Buy | 2026-01-20 |
| B of A Securities | Maintain | Buy | 2026-01-13 |
| Jefferies | Maintain | Buy | 2025-12-15 |
| Evercore ISI Group | Maintain | Outperform | 2025-11-07 |
| Benchmark | Maintain | Buy | 2025-11-07 |
| Cantor Fitzgerald | Maintain | Overweight | 2025-06-24 |
| B of A Securities | Maintain | Buy | 2025-06-24 |
| Citigroup | Maintain | Buy | 2025-05-09 |
| Benchmark | Maintain | Buy | 2025-05-09 |
| B of A Securities | Maintain | Buy | 2025-04-16 |
Which company has the best grades?
Both companies receive predominantly positive grades, but NXP Semiconductors shows a mix of Buy and Outperform ratings with some Neutral. Nova Ltd. holds consistently Buy or better grades, including an Outperform. Nova’s more uniform positive ratings may signal stronger institutional confidence, potentially influencing investor sentiment favorably.
Risks specific to each company
In 2026’s complex market environment, the following categories pinpoint critical pressure points and systemic threats facing both NXP Semiconductors N.V. and Nova Ltd.:
1. Market & Competition
NXP Semiconductors N.V.
- Faces intense competition in diversified semiconductor segments, including automotive and IoT markets.
Nova Ltd.
- Competes in a specialized niche of semiconductor process control with fewer direct rivals but high technological barriers.
2. Capital Structure & Debt
NXP Semiconductors N.V.
- Leverage ratio is high (D/E 1.22), raising financial risk despite solid interest coverage (7.97x).
Nova Ltd.
- Maintains low leverage (D/E 0.25) and very strong interest coverage (116x), reflecting conservative financial management.
3. Stock Volatility
NXP Semiconductors N.V.
- Beta of 1.46 indicates higher-than-market volatility, typical in cyclical semiconductor industries.
Nova Ltd.
- Higher beta at 1.82 signals even greater sensitivity to market swings and sector-specific shocks.
4. Regulatory & Legal
NXP Semiconductors N.V.
- Global operations expose it to diverse regulatory regimes, especially US-China tensions affecting semiconductor trade.
Nova Ltd.
- Operating mainly in Israel and Asia, faces geopolitical regulatory risks but less US-China direct trade exposure.
5. Supply Chain & Operations
NXP Semiconductors N.V.
- Complex supply chain across multiple countries risks disruption amid global semiconductor shortages.
Nova Ltd.
- Highly specialized manufacturing equipment supply chain vulnerable to limited suppliers and geopolitical disruptions.
6. ESG & Climate Transition
NXP Semiconductors N.V.
- Increasing pressure to meet ESG standards due to scale and carbon footprint in manufacturing.
Nova Ltd.
- Smaller footprint but growing scrutiny on sustainability in advanced semiconductor manufacturing processes.
7. Geopolitical Exposure
NXP Semiconductors N.V.
- Significant exposure to US-China trade tensions and European regulatory changes.
Nova Ltd.
- Exposure concentrated in Israel and Asia, facing Middle East regional risks and supply chain uncertainties.
Which company shows a better risk-adjusted profile?
NXP’s largest risk is elevated financial leverage amid cyclical market pressures. Nova’s greatest vulnerability lies in its high stock volatility and concentrated geopolitical exposure. Nova’s strong balance sheet and higher Altman Z-Score (9.0 vs. 3.1) provide a safer financial base. Yet, Nova’s greater beta and dependence on specialized supply chains increase operational risk. Overall, Nova presents a better risk-adjusted profile, supported by its robust liquidity and lower debt, despite market sensitivity. This balance favors Nova in a volatile 2026 semiconductor landscape.
Final Verdict: Which stock to choose?
NXP Semiconductors N.V. (NXPI) stands out for its robust operating efficiency and strong cash flow generation despite near-term revenue headwinds. Its main point of vigilance lies in a slightly declining ROIC trend, signaling potential challenges in sustaining value creation. NXPI suits portfolios seeking steady income with moderate growth exposure.
Nova Ltd. (NVMI) impresses with a strategic moat centered on accelerating profitability and a rapidly improving ROIC profile. Its low leverage and exceptional interest coverage enhance its safety compared to NXPI. NVMI fits well within growth-at-a-reasonable-price (GARP) portfolios aiming for dynamic expansion backed by solid fundamentals.
If you prioritize operational resilience and stable dividends, NXPI is the compelling choice due to its cash generation and solid income metrics. However, if you seek growth fueled by improving profitability and a cleaner balance sheet, NVMI offers better stability and growth potential, albeit at a premium valuation. Both require close monitoring of their evolving competitive advantages.
Disclaimer: Investment carries a risk of loss of initial capital. The past performance is not a reliable indicator of future results. Be sure to understand risks before making an investment decision.
Go Further
I encourage you to read the complete analyses of NXP Semiconductors N.V. and Nova Ltd. to enhance your investment decisions: