In the fast-evolving semiconductor industry, NXP Semiconductors N.V. and indie Semiconductor, Inc. stand out as key players driving innovation. Both companies focus on automotive and connectivity solutions, yet differ in scale and market approach. Comparing their strategies and market positions provides valuable insights for investors seeking growth opportunities in technology. This article will help you identify which company holds the most promise for your investment portfolio.

Table of contents
Companies Overview
I will begin the comparison between NXP Semiconductors N.V. and indie Semiconductor, Inc. by providing an overview of these two companies and their main differences.
NXP Semiconductors N.V. Overview
NXP Semiconductors N.V., headquartered in Eindhoven, Netherlands, is a leading provider of semiconductor products with a broad portfolio including microcontrollers, application processors, wireless connectivity solutions, analog devices, and sensors. Its products serve diverse applications such as automotive, industrial IoT, mobile, and communication infrastructure. The company operates internationally and employs approximately 33,100 people, positioning itself as a significant player in the semiconductor industry.
indie Semiconductor, Inc. Overview
indie Semiconductor, based in Aliso Viejo, California, focuses on automotive semiconductors and software solutions for advanced driver assistance, connected car technologies, and electrification. With a workforce of about 920 employees, indie develops devices supporting ultrasound parking assistance, wireless charging, infotainment, and optical sensing markets. The company emphasizes innovation in automotive user experience and telematics, catering primarily to the automotive sector.
Key similarities and differences
Both companies operate within the semiconductor industry, with a focus on automotive applications among other markets. NXP has a broader product range and a global presence with a larger workforce, addressing multiple sectors beyond automotive. In contrast, indie is more specialized in automotive semiconductors and software solutions, concentrating on advanced driver assistance and connectivity. Their differing scales and market scopes represent distinct approaches within the same sector.
Income Statement Comparison
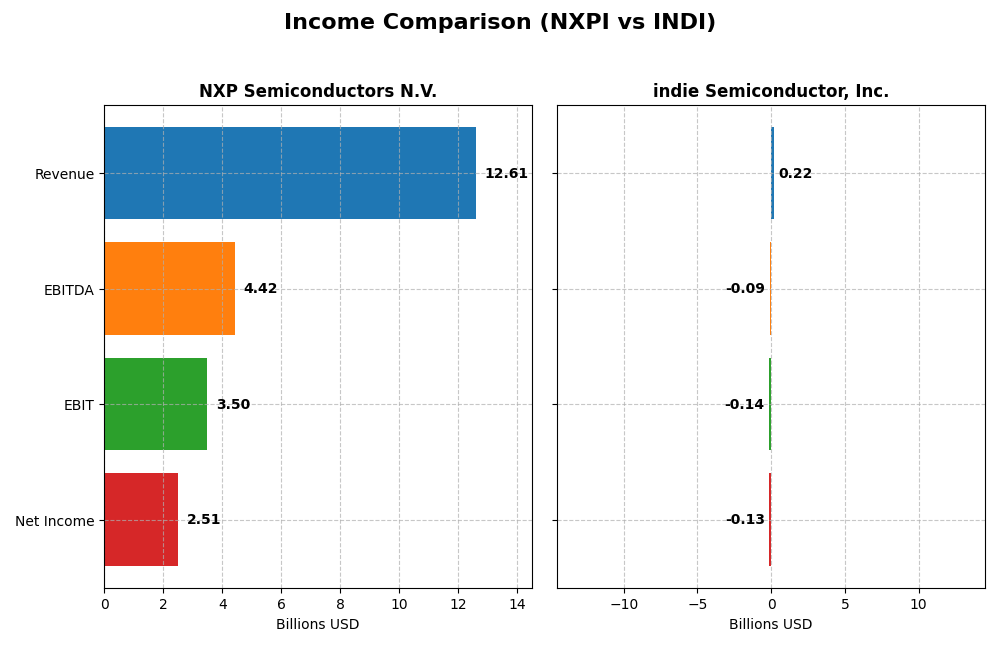
This table compares the key income statement metrics of NXP Semiconductors N.V. and indie Semiconductor, Inc. for the fiscal year 2024, providing a snapshot of their financial performance.
| Metric | NXP Semiconductors N.V. | indie Semiconductor, Inc. |
|---|---|---|
| Market Cap | 60B | 857M |
| Revenue | 12.6B | 217M |
| EBITDA | 4.42B | -94M |
| EBIT | 3.50B | -137M |
| Net Income | 2.51B | -133M |
| EPS | 9.84 | -0.76 |
| Fiscal Year | 2024 | 2024 |
Income Statement Interpretations
NXP Semiconductors N.V.
NXP Semiconductors displayed a strong upward trend in revenue, rising 46.5% from 2020 to 2024, despite a 5% revenue decline in the latest year. Net income surged over 4700% across the period, though it fell nearly 10% most recently. Margins remain robust with a 56.4% gross margin and a 19.9% net margin, although recent margin growth slowed. The 2024 results reflect slight contraction after sustained growth.
indie Semiconductor, Inc.
indie Semiconductor’s revenue jumped over 850% from 2020 to 2024, with a 2.9% decline in the latest year. Net losses widened by 36% over the period, and the net margin remains deeply negative at -61.2%. While gross margin improved sharply last year, operating margins remain unfavorable at -63.2%. Earnings per share showed modest overall growth, but recent profitability challenges persist.
Which one has the stronger fundamentals?
NXP Semiconductors demonstrates stronger fundamentals with favorable margin levels, positive net income growth, and a solid overall revenue increase, despite recent slight declines. indie Semiconductor shows impressive top-line growth but struggles with persistent losses and negative margins, resulting in a neutral income statement evaluation. Thus, NXP’s financial profile appears more stable and consistently profitable.
Financial Ratios Comparison
The table below presents a side-by-side comparison of key financial ratios for NXP Semiconductors N.V. and indie Semiconductor, Inc. for the fiscal year 2024.
| Ratios | NXP Semiconductors N.V. (NXPI) | indie Semiconductor, Inc. (INDI) |
|---|---|---|
| ROE | 27.33% | -31.73% |
| ROIC | 12.91% | -19.25% |
| P/E | 21.13 | -5.35 |
| P/B | 5.78 | 1.70 |
| Current Ratio | 2.36 | 4.82 |
| Quick Ratio | 1.60 | 4.23 |
| D/E (Debt-to-Equity) | 1.18 | 0.95 |
| Debt-to-Assets | 44.51% | 42.34% |
| Interest Coverage | 8.59 | -18.37 |
| Asset Turnover | 0.52 | 0.23 |
| Fixed Asset Turnover | 3.86 | 4.30 |
| Payout ratio | 41.35% | 0% |
| Dividend yield | 1.96% | 0% |
Interpretation of the Ratios
NXP Semiconductors N.V.
NXP Semiconductors displays generally strong financial ratios with favorable net margin (19.9%), ROE (27.33%), and ROIC (12.91%), indicating efficient profitability and capital use. However, its high PB ratio (5.78) and debt-to-equity (1.18) ratios raise some caution on valuation and leverage. The company pays dividends with a 1.96% yield, supported moderately by free cash flow, suggesting prudent shareholder returns.
indie Semiconductor, Inc.
indie Semiconductor’s ratios reflect significant challenges, including negative net margin (-61.2%), ROE (-31.73%), and ROIC (-19.25%), signaling weak profitability and capital efficiency. The firm does not pay dividends, consistent with its negative earnings and reinvestment focus. While it maintains a strong quick ratio, other liquidity and coverage ratios are unfavorable, reflecting operational and financial risks.
Which one has the best ratios?
NXP Semiconductors has the best ratios overall, with a majority of favorable indicators and manageable risks. indie Semiconductor shows predominantly unfavorable ratios, reflecting financial weakness and operational challenges. NXP’s balanced profitability and dividend payments contrast with indie’s ongoing losses and absence of shareholder returns, making NXP the stronger performer by these metrics.
Strategic Positioning
This section compares the strategic positioning of NXP Semiconductors N.V. and indie Semiconductor, Inc. based on market position, key segments, and exposure to technological disruption:
NXP Semiconductors N.V.
- Large market cap of 60B USD in semiconductors with global reach and diversified OEM clients.
- Diverse product portfolio including microcontrollers, processors, wireless connectivity, analog devices, and sensors.
- Faces technological changes in advanced wireless and sensor integration impacting automotive and IoT markets.
indie Semiconductor, Inc.
- Smaller market cap of 857M USD focused on automotive semiconductor niche.
- Concentrated on automotive semiconductors and software for driver assistance and connectivity.
- Exposure to disruption in automotive tech with photonic and software innovations in connectivity and electrification.
NXP vs indie Positioning
NXP operates with a diversified product portfolio and global scale, supporting automotive, industrial, and IoT sectors. indie concentrates on automotive semiconductor solutions with a focus on software and photonics, implying a narrower but specialized market approach.
Which has the best competitive advantage?
NXP shows a very favorable moat with growing ROIC and value creation, indicating durable competitive advantage. indie has a very unfavorable moat with declining ROIC, signaling value destruction and weaker competitive positioning.
Stock Comparison
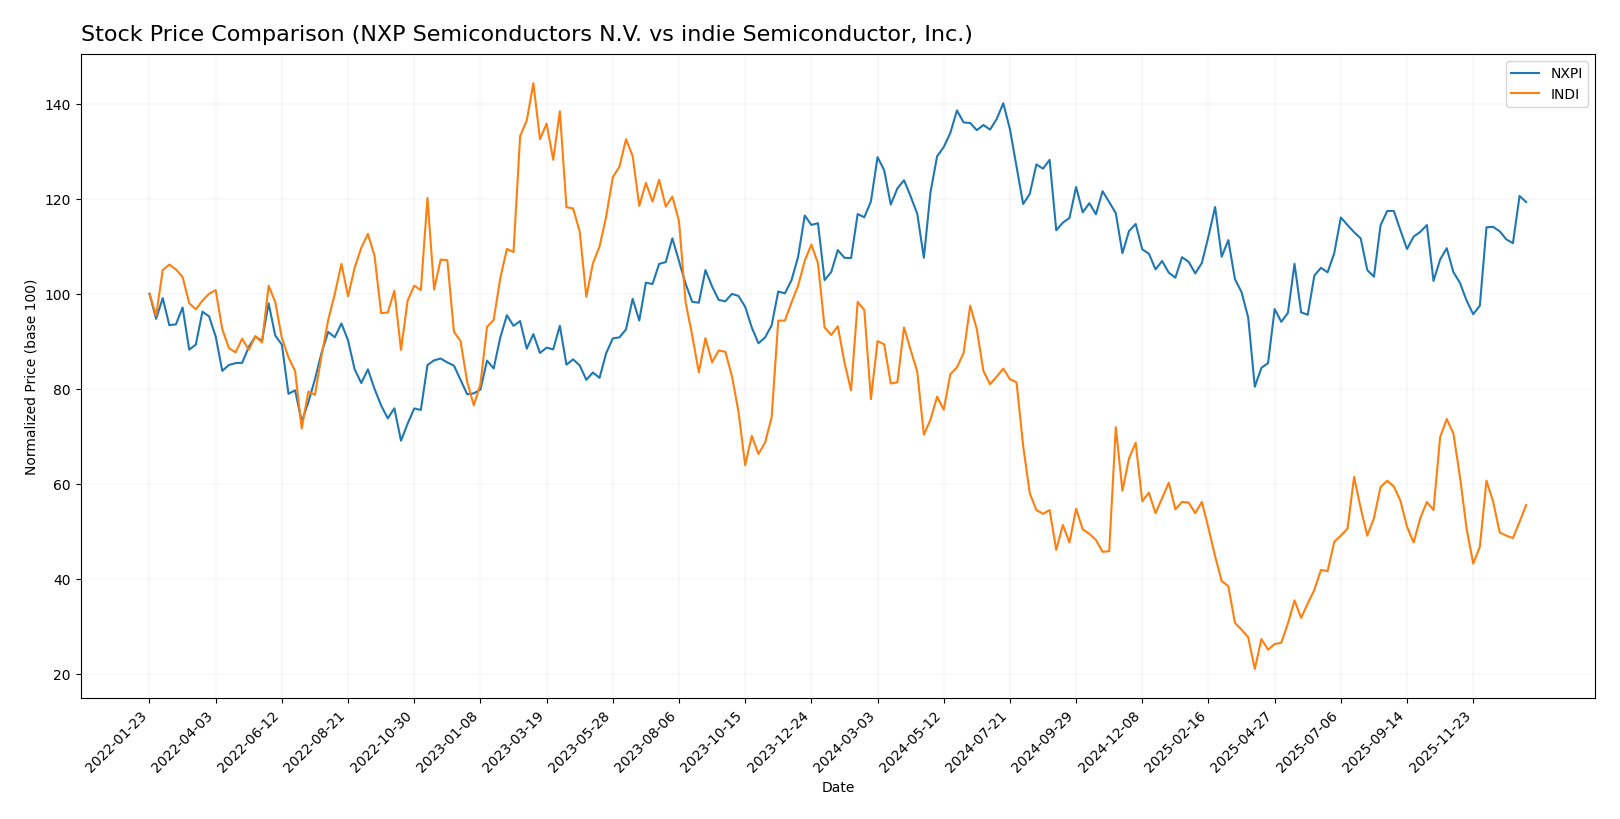
The past year has seen contrasting price dynamics between NXP Semiconductors N.V. and indie Semiconductor, Inc., with NXP showing near stability overall but recent acceleration, while indie Semiconductor has experienced a significant decline with decelerating losses.
Trend Analysis
NXP Semiconductors N.V. exhibited an overall bearish trend with a marginal -0.1% price change over the past 12 months, accompanied by acceleration in the trend and notable volatility (std deviation 24.45). The stock price ranged between 160.81 and 280.19.
indie Semiconductor, Inc. showed a pronounced bearish trend with a -28.67% price change over the same period, decelerating losses, and low volatility (std deviation 1.35). The stock traded from 1.6 to 7.43.
Comparing both, NXP Semiconductors delivered a substantially higher market performance than indie Semiconductor, which suffered heavy declines and weaker momentum.
Target Prices
Here is the current target price consensus for the semiconductor companies analyzed.
| Company | Target High | Target Low | Consensus |
|---|---|---|---|
| NXP Semiconductors N.V. | 280 | 215 | 242.5 |
| indie Semiconductor, Inc. | 8 | 8 | 8 |
Analysts expect NXP Semiconductors’ stock to trade moderately above the current price of $238.6, indicating potential upside. indie Semiconductor’s target is flat at $8, suggesting limited near-term price movement from its current $4.23.
Analyst Opinions Comparison
This section compares analysts’ ratings and grades for NXP Semiconductors N.V. and indie Semiconductor, Inc.:
Rating Comparison
NXP Semiconductors N.V. Rating
- Rating: B, indicating a very favorable evaluation.
- Discounted Cash Flow Score: 4, showing favorable future cash flow projections.
- ROE Score: 4, reflecting efficient profit generation from equity.
- ROA Score: 4, indicating effective asset utilization.
- Debt To Equity Score: 1, indicating a very unfavorable financial risk profile.
- Overall Score: 3, a moderate overall financial standing.
indie Semiconductor, Inc. Rating
- Rating: C-, indicating a very unfavorable evaluation.
- Discounted Cash Flow Score: 1, showing very unfavorable projections.
- ROE Score: 1, reflecting very inefficient profit generation.
- ROA Score: 1, indicating very ineffective asset utilization.
- Debt To Equity Score: 1, also very unfavorable financial risk profile.
- Overall Score: 1, a very unfavorable overall financial standing.
Which one is the best rated?
NXP Semiconductors N.V. is better rated overall, with a “B” rating and favorable scores in cash flow, ROE, and ROA. indie Semiconductor, Inc. holds a “C-” rating with very unfavorable scores across key financial metrics.
Scores Comparison
Here is a comparison of the Altman Z-Score and Piotroski Score for NXP Semiconductors N.V. and indie Semiconductor, Inc.:
NXP Semiconductors N.V. Scores
- Altman Z-Score: 3.26, indicating a safe zone
- Piotroski Score: 6, reflecting average financial strength
indie Semiconductor, Inc. Scores
- Altman Z-Score: 0.12, indicating a distress zone
- Piotroski Score: 2, reflecting very weak financial strength
Which company has the best scores?
Based strictly on the provided data, NXP Semiconductors shows stronger financial health with a safe zone Altman Z-Score and an average Piotroski Score. indie Semiconductor falls in financial distress with very weak Piotroski results.
Grades Comparison
I present a comparison of recent and reliable grades for NXP Semiconductors N.V. and indie Semiconductor, Inc.:
NXP Semiconductors N.V. Grades
The following table summarizes recent grades from recognized financial institutions for NXP Semiconductors N.V.:
| Grading Company | Action | New Grade | Date |
|---|---|---|---|
| Truist Securities | Maintain | Buy | 2025-12-19 |
| Truist Securities | Maintain | Buy | 2025-10-29 |
| JP Morgan | Maintain | Neutral | 2025-10-29 |
| Wells Fargo | Maintain | Overweight | 2025-07-23 |
| Truist Securities | Maintain | Buy | 2025-07-23 |
| JP Morgan | Maintain | Neutral | 2025-07-23 |
| Susquehanna | Maintain | Neutral | 2025-07-23 |
| Cantor Fitzgerald | Maintain | Overweight | 2025-07-22 |
| Needham | Maintain | Buy | 2025-07-22 |
| Barclays | Maintain | Overweight | 2025-07-22 |
Overall, NXP Semiconductors N.V. has maintained predominantly positive ratings, with a consensus leaning towards Buy and Overweight grades, indicating moderate optimism among analysts.
indie Semiconductor, Inc. Grades
Below is a summary of recent grades from established grading companies for indie Semiconductor, Inc.:
| Grading Company | Action | New Grade | Date |
|---|---|---|---|
| UBS | Maintain | Neutral | 2025-11-10 |
| Benchmark | Maintain | Buy | 2025-06-25 |
| Benchmark | Maintain | Buy | 2025-06-11 |
| Benchmark | Maintain | Buy | 2025-05-21 |
| Benchmark | Maintain | Buy | 2025-05-13 |
| Craig-Hallum | Maintain | Buy | 2025-05-13 |
| Keybanc | Maintain | Overweight | 2025-05-13 |
| Benchmark | Maintain | Buy | 2025-04-09 |
| Benchmark | Maintain | Buy | 2025-02-21 |
| Keybanc | Maintain | Overweight | 2025-02-21 |
The grades for indie Semiconductor, Inc. show a strong Buy consensus, supported by multiple repeated Buy and Overweight ratings from several firms, reflecting consistent analyst confidence.
Which company has the best grades?
Both companies have a Buy consensus, but indie Semiconductor, Inc. has a higher frequency of Buy and Overweight ratings from multiple firms compared to NXP Semiconductors N.V., which shows a mix of Buy, Neutral, and Overweight grades. This pattern may suggest stronger analyst conviction for indie Semiconductor, Inc., potentially impacting investor perception of growth prospects and risk.
Strengths and Weaknesses
Below is a comparison of key strengths and weaknesses for NXP Semiconductors N.V. (NXPI) and indie Semiconductor, Inc. (INDI) based on the most recent data available.
| Criterion | NXP Semiconductors N.V. (NXPI) | indie Semiconductor, Inc. (INDI) |
|---|---|---|
| Diversification | Strong focus on High Performance Mixed Signal products; steady revenue diversification across segments | Limited diversification; mostly dependent on Product segment with smaller Service revenues |
| Profitability | High profitability: net margin ~19.9%, ROIC 12.91%, ROE 27.33% | Negative profitability: net margin -61.2%, ROIC -19.25%, ROE -31.73% |
| Innovation | Demonstrates durable competitive advantage with growing ROIC | Declining ROIC indicates weakening competitive position and value destruction |
| Global presence | Established global market presence with significant market share | Smaller scale with limited global penetration |
| Market Share | Large market share in semiconductor industry; consistent revenue growth | Small market share with volatile and declining returns |
Key takeaways: NXP Semiconductors exhibits robust profitability, diversification, and a durable moat, making it a relatively safer investment. Conversely, indie Semiconductor faces significant profitability challenges and declining competitive strength, signaling high risk for investors.
Risk Analysis
Below is a comparative table highlighting key risks for NXP Semiconductors N.V. (NXPI) and indie Semiconductor, Inc. (INDI) based on the most recent 2024 data.
| Metric | NXP Semiconductors N.V. (NXPI) | indie Semiconductor, Inc. (INDI) |
|---|---|---|
| Market Risk | Beta 1.47 indicates moderate volatility | Beta 2.54 shows high volatility and market sensitivity |
| Debt level | Debt/Equity 1.18 (unfavorable), interest coverage strong (8.79) | Debt/Equity 0.95 (neutral), negative interest coverage (-14.8) signals distress |
| Regulatory Risk | Exposure to global semiconductor regulations, diversified markets | US-focused, automotive semiconductor regulation risks |
| Operational Risk | Large scale with 33.1K employees, complexity manageable | Smaller scale (920 employees), higher operational leverage |
| Environmental Risk | Moderate, with semiconductor manufacturing impact | Moderate, automotive focus with evolving eco-standards |
| Geopolitical Risk | Significant exposure to China, US, Europe | Mainly US-based, less diversified geopolitical exposure |
In synthesis, indie Semiconductor faces the most critical risks with high market volatility, severe financial distress indicated by negative profitability and interest coverage, and a weak Altman Z-Score placing it in the distress zone. NXP, while having moderate debt and geopolitical exposure, remains financially stable with a safe Altman Z-Score and favorable operational metrics. Investors should weigh indie’s higher risk against its growth potential and consider NXP’s relative stability for risk-managed portfolios.
Which Stock to Choose?
NXP Semiconductors N.V. (NXPI) shows a favorable income statement with a 19.9% net margin and a positive overall income growth since 2020. Its financial ratios are slightly favorable, highlighting strong profitability (ROE 27.33%) but with some concerns on debt levels. NXPI’s rating is very favorable with a grade B, supported by a safe Altman Z-Score and a durable economic moat reflecting growing ROIC above WACC.
Indie Semiconductor, Inc. (INDI) presents a challenging financial profile with a negative net margin of -61.2% and mixed income growth metrics over the period. The financial ratios evaluation is unfavorable, with negative returns on equity and assets, alongside a very unfavorable rating of C- and a distress zone Altman Z-Score. INDI’s economic moat is very unfavorable, indicating declining profitability and value destruction.
Considering the global evaluation of income statements, financial ratios, and ratings, NXPI might appear more favorable for risk-averse or quality-focused investors due to its stable profitability and strong economic moat. Conversely, INDI could be interpreted as fitting for risk-tolerant investors seeking potential growth despite current financial weaknesses.
Disclaimer: Investment carries a risk of loss of initial capital. The past performance is not a reliable indicator of future results. Be sure to understand risks before making an investment decision.
Go Further
I encourage you to read the complete analyses of NXP Semiconductors N.V. and indie Semiconductor, Inc. to enhance your investment decisions: