NXP Semiconductors N.V. and GLOBALFOUNDRIES Inc. are two prominent players in the semiconductor industry, each with distinct approaches to innovation and market reach. NXP focuses on diverse semiconductor solutions for automotive and IoT applications, while GLOBALFOUNDRIES specializes in wafer fabrication services and integrated circuit manufacturing. Comparing these companies reveals insights into industry dynamics and investment potential. Join me as we explore which stock presents the most compelling opportunity for your portfolio.

Table of contents
Companies Overview
I will begin the comparison between NXP Semiconductors N.V. and GLOBALFOUNDRIES Inc. by providing an overview of these two companies and their main differences.
NXP Semiconductors N.V. Overview
NXP Semiconductors N.V., headquartered in Eindhoven, the Netherlands, offers a broad portfolio of semiconductor products, including microcontrollers, application processors, and wireless connectivity solutions. Its technologies serve automotive, industrial, IoT, mobile, and communication infrastructure markets. With 33,100 employees, NXP operates globally, marketing to original equipment manufacturers, contract manufacturers, and distributors.
GLOBALFOUNDRIES Inc. Overview
GLOBALFOUNDRIES Inc., based in Malta, New York, is a semiconductor foundry specializing in manufacturing integrated circuits and wafer fabrication services. It produces microprocessors, application processors, network and baseband processors, and microelectromechanical systems. Founded in 2009, the company employs 13,000 people and focuses on enabling various electronic devices worldwide.
Key similarities and differences
Both companies operate in the semiconductor industry and serve global markets with advanced technology products. NXP focuses on designing and marketing semiconductor components across multiple applications, while GLOBALFOUNDRIES primarily provides manufacturing foundry services and integrated circuit production. NXP’s workforce is significantly larger, reflecting its broader product portfolio and market approach compared to GLOBALFOUNDRIES’ specialized foundry model.
Income Statement Comparison
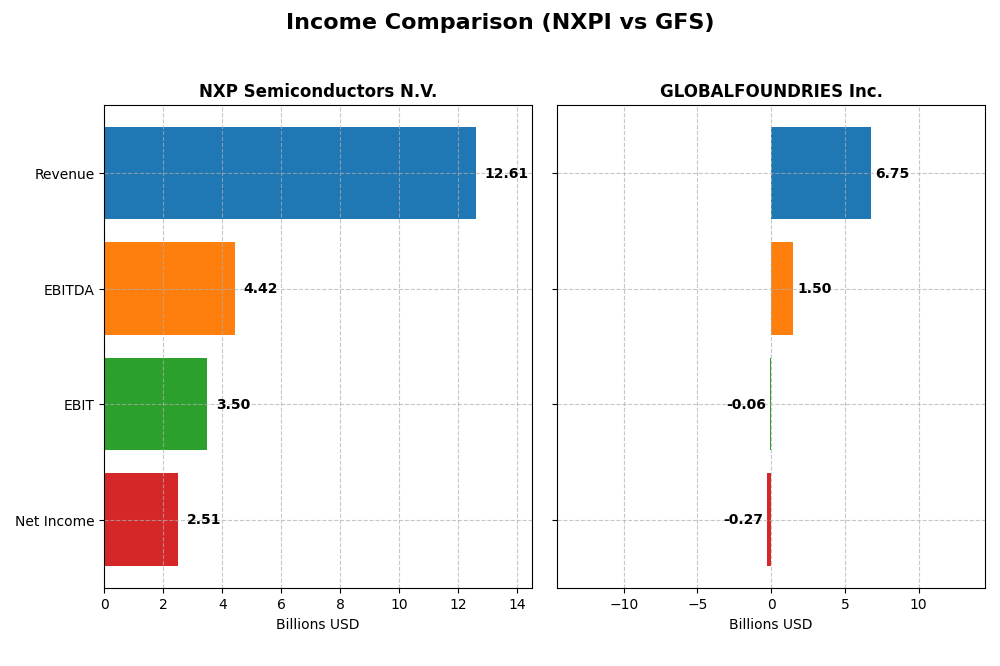
The table below compares the key income statement metrics for NXP Semiconductors N.V. and GLOBALFOUNDRIES Inc. for the fiscal year 2024, providing a clear view of their recent financial performance.
| Metric | NXP Semiconductors N.V. | GLOBALFOUNDRIES Inc. |
|---|---|---|
| Market Cap | 55.7B | 20.4B |
| Revenue | 12.6B | 6.75B |
| EBITDA | 4.42B | 1.50B |
| EBIT | 3.50B | -64M |
| Net Income | 2.51B | -265M |
| EPS | 9.84 | -0.48 |
| Fiscal Year | 2024 | 2024 |
Income Statement Interpretations
NXP Semiconductors N.V.
NXP Semiconductors showed strong overall growth from 2020 to 2024, with revenue increasing by 46% and net income surging by 4,727%. Margins remain robust, with a favorable gross margin of 56.44% and net margin near 20%. However, the most recent year saw a slight revenue decline of 5%, alongside reduced profits and margins, signaling a moderation after prior gains.
GLOBALFOUNDRIES Inc.
GLOBALFOUNDRIES experienced a 39% revenue rise and an 80% net income growth over 2020–2024. Despite a favorable gross margin of 24.46%, EBIT and net margins were negative in 2024, reflecting operational challenges. The latest year showed a notable revenue drop of nearly 9%, with steep declines in profitability and earnings per share, indicating recent underperformance.
Which one has the stronger fundamentals?
NXP Semiconductors presents stronger fundamentals with higher and more stable margins, significant net income growth, and a positive overall income statement evaluation. GLOBALFOUNDRIES, although growing revenue and net income over the period, struggles with negative EBIT and net margins recently, resulting in an unfavorable global income statement assessment.
Financial Ratios Comparison
The table below presents a side-by-side comparison of key financial ratios for NXP Semiconductors N.V. (NXPI) and GLOBALFOUNDRIES Inc. (GFS) based on their latest fiscal year 2024 data.
| Ratios | NXP Semiconductors N.V. (NXPI) | GLOBALFOUNDRIES Inc. (GFS) |
|---|---|---|
| ROE | 27.33% | -2.46% |
| ROIC | 12.91% | -2.26% |
| P/E | 21.13 | -89.54 |
| P/B | 5.78 | 2.20 |
| Current Ratio | 2.36 | 2.11 |
| Quick Ratio | 1.60 | 1.57 |
| D/E (Debt-to-Equity) | 1.18 | 0.22 |
| Debt-to-Assets | 44.51% | 13.81% |
| Interest Coverage | 8.59 | -1.48 |
| Asset Turnover | 0.52 | 0.40 |
| Fixed Asset Turnover | 3.86 | 0.82 |
| Payout ratio | 41.35% | 0% |
| Dividend yield | 1.96% | 0% |
Interpretation of the Ratios
NXP Semiconductors N.V.
NXP Semiconductors exhibits generally strong financial ratios with favorable net margin at 19.9%, ROE at 27.33%, and ROIC at 12.91%, indicating efficient profitability and capital use. However, the debt-to-equity ratio of 1.18 and a high price-to-book ratio of 5.78 raise some concerns about leverage and valuation. The company pays dividends with a 1.96% yield, reflecting moderate shareholder returns supported by stable cash flow.
GLOBALFOUNDRIES Inc.
GLOBALFOUNDRIES shows weak profitability ratios, with negative net margin (-3.93%), ROE (-2.46%), and ROIC (-2.26%), suggesting operational challenges. Its balance sheet metrics are stronger, with low debt-to-equity of 0.22 and a current ratio of 2.11. The company does not pay dividends, likely due to its negative earnings and reinvestment focus, which fits a growth or restructuring phase.
Which one has the best ratios?
NXP Semiconductors holds the advantage with a balanced profile of profitability and liquidity ratios, though leverage is slightly high. GLOBALFOUNDRIES’ unfavorable profitability and coverage ratios contrast with its low leverage and liquidity, resulting in an overall weaker financial health assessment compared to NXP.
Strategic Positioning
This section compares the strategic positioning of NXP Semiconductors N.V. and GLOBALFOUNDRIES Inc., including market position, key segments, and exposure to technological disruption:
NXP Semiconductors N.V.
- Large market cap of 55.7B with competitive pressure in semiconductor industry.
- Key segments include high performance mixed signal semiconductors and diverse applications like automotive and IoT.
- Exposure includes wireless connectivity and sensor technologies, facing evolving semiconductor tech.
GLOBALFOUNDRIES Inc.
- Smaller market cap of 20.4B, focused on foundry services amid industry competition.
- Key segments are wafer fabrication and engineering pre-fabrication services.
- Exposure centers on semiconductor manufacturing processes, facing tech advancements in fabrication.
NXP Semiconductors N.V. vs GLOBALFOUNDRIES Inc. Positioning
NXP has a diversified product portfolio across multiple semiconductor applications, including automotive and IoT, supporting broader market exposure. GLOBALFOUNDRIES concentrates on manufacturing services, which narrows its focus but may provide specialized operational advantages.
Which has the best competitive advantage?
NXP shows a very favorable moat with ROIC exceeding WACC by 3.54% and a strong growing ROIC trend, indicating durable value creation. GLOBALFOUNDRIES has a slightly unfavorable moat, shedding value despite improving profitability.
Stock Comparison
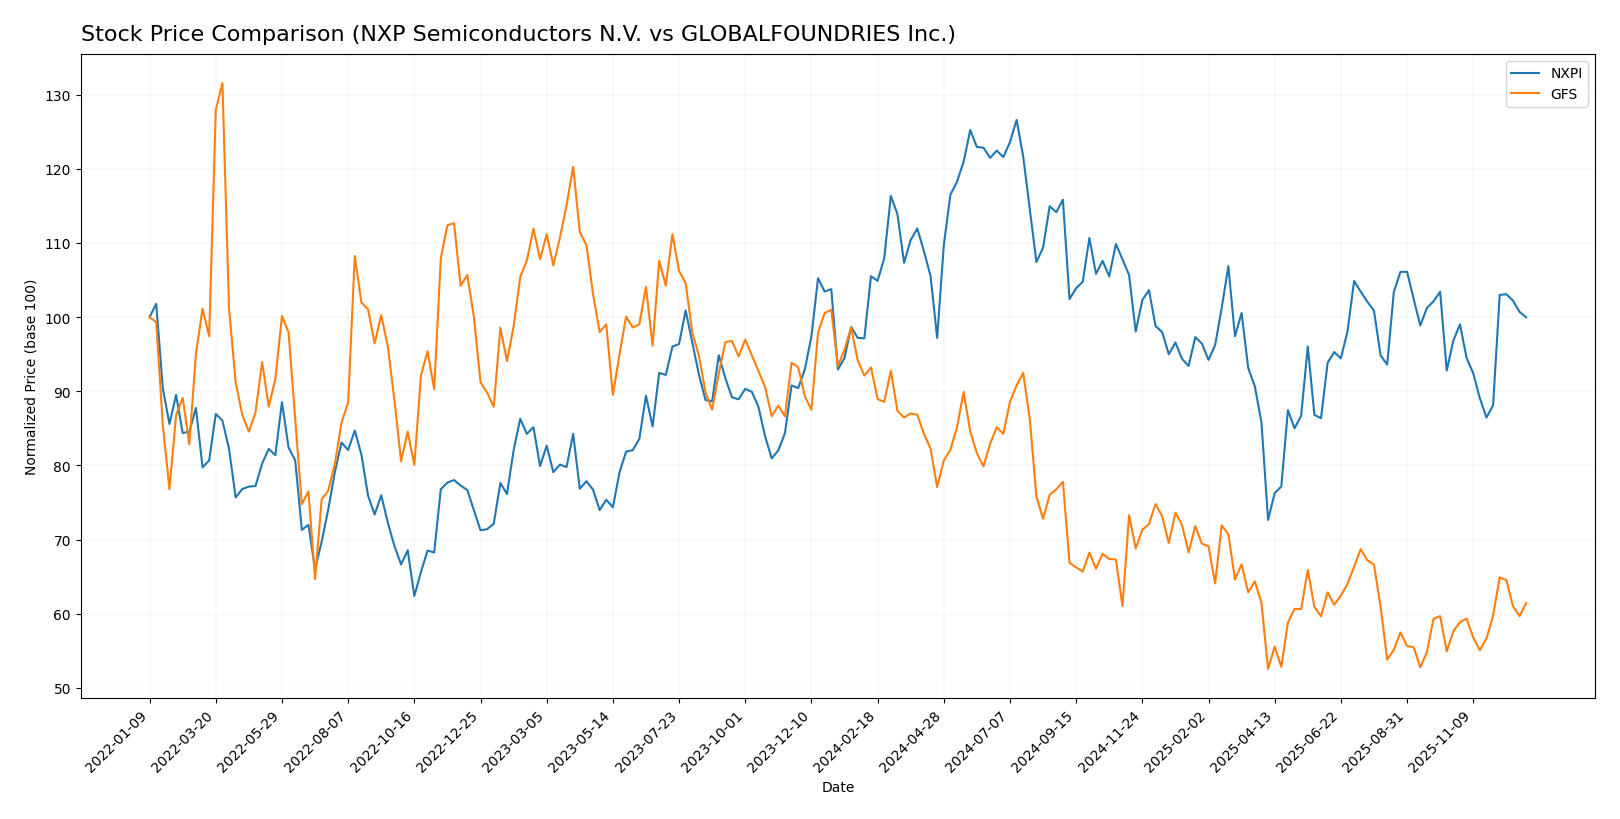
The past year’s stock price movements for NXP Semiconductors N.V. and GLOBALFOUNDRIES Inc. reveal distinct bearish trends with accelerating declines, punctuated by recent short-term recoveries and varying trading volume dynamics.
Trend Analysis
NXP Semiconductors N.V. experienced a 5.25% price decline over the past 12 months, indicating a bearish trend with accelerating downward momentum. The stock showed high volatility with a standard deviation of 24.4, ranging from 160.81 to 280.19.
GLOBALFOUNDRIES Inc. saw a more pronounced 34.09% decrease over the same period, also bearish with acceleration. Volatility was lower than NXPI’s, at 6.71 standard deviation, with prices fluctuating between 31.54 and 55.94.
Comparing both, GLOBALFOUNDRIES posted the larger negative return, thus underperforming NXP Semiconductors, despite both showing recent upward trend slopes.
Target Prices
The analyst consensus suggests a positive outlook for both NXP Semiconductors N.V. and GLOBALFOUNDRIES Inc.
| Company | Target High | Target Low | Consensus |
|---|---|---|---|
| NXP Semiconductors N.V. | 280 | 215 | 247.75 |
| GLOBALFOUNDRIES Inc. | 40 | 37 | 38.5 |
Analysts expect NXP Semiconductors’ stock to appreciate significantly from its current price of 221.28 USD, while GLOBALFOUNDRIES shows moderate upside potential versus its current 36.87 USD price.
Analyst Opinions Comparison
This section compares analysts’ ratings and grades for NXP Semiconductors N.V. (NXPI) and GLOBALFOUNDRIES Inc. (GFS):
Rating Comparison
NXPI Rating
- Rating: B, assessed as Very Favorable overall.
- Discounted Cash Flow Score: 4, indicating a Favorable valuation based on future cash flows.
- Return on Equity Score: 4, reflecting strong profitability from shareholders’ equity.
- Return on Assets Score: 4, demonstrating efficient asset utilization to generate earnings.
- Debt To Equity Score: 1, rated Very Unfavorable, indicating a higher financial risk.
- Overall Score: 3, a Moderate overall financial standing.
GFS Rating
- Rating: C+, also considered Very Favorable overall.
- Discounted Cash Flow Score: 3, showing a Moderate valuation outlook.
- Return on Equity Score: 1, indicating a Very Unfavorable profitability level.
- Return on Assets Score: 1, considered Very Unfavorable in asset use efficiency.
- Debt To Equity Score: 3, Moderate risk profile with a more balanced debt-to-equity ratio.
- Overall Score: 2, also Moderate but lower than NXPI’s overall score.
Which one is the best rated?
Based strictly on the provided data, NXPI holds a higher rating (B) and superior scores in discounted cash flow, ROE, and ROA compared to GFS. However, NXPI’s debt-to-equity score is less favorable than GFS’s. Overall, NXPI is better rated.
Scores Comparison
Here is a comparison of the financial scores for NXP Semiconductors N.V. and GLOBALFOUNDRIES Inc.:
NXP Semiconductors N.V. Scores
- Altman Z-Score: 2.98 in grey zone, moderate bankruptcy risk
- Piotroski Score: 6, indicating average financial strength
GLOBALFOUNDRIES Inc. Scores
- Altman Z-Score: 2.03 in grey zone, moderate bankruptcy risk
- Piotroski Score: 6, indicating average financial strength
Which company has the best scores?
Both NXP Semiconductors and GLOBALFOUNDRIES share the same Piotroski Score of 6, reflecting average financial strength. NXP’s Altman Z-Score is slightly higher at 2.98 versus 2.03 for GLOBALFOUNDRIES, suggesting marginally better bankruptcy risk positioning.
Grades Comparison
Here is a comparison of the latest verified grades for NXP Semiconductors N.V. and GLOBALFOUNDRIES Inc.:
NXP Semiconductors N.V. Grades
The table below shows recent grades assigned by reputable grading companies to NXP Semiconductors N.V.:
| Grading Company | Action | New Grade | Date |
|---|---|---|---|
| Truist Securities | Maintain | Buy | 2025-12-19 |
| JP Morgan | Maintain | Neutral | 2025-10-29 |
| Truist Securities | Maintain | Buy | 2025-10-29 |
| Wells Fargo | Maintain | Overweight | 2025-07-23 |
| Susquehanna | Maintain | Neutral | 2025-07-23 |
| Truist Securities | Maintain | Buy | 2025-07-23 |
| JP Morgan | Maintain | Neutral | 2025-07-23 |
| Cantor Fitzgerald | Maintain | Overweight | 2025-07-22 |
| Needham | Maintain | Buy | 2025-07-22 |
| Barclays | Maintain | Overweight | 2025-07-22 |
Overall, NXP Semiconductors has consistently received positive grades, including several Buy and Overweight ratings, indicating a generally favorable analyst consensus.
GLOBALFOUNDRIES Inc. Grades
The table below presents recent grades for GLOBALFOUNDRIES Inc. by recognized grading firms:
| Grading Company | Action | New Grade | Date |
|---|---|---|---|
| Wedbush | Downgrade | Neutral | 2025-12-31 |
| B of A Securities | Maintain | Underperform | 2025-12-04 |
| Citigroup | Maintain | Neutral | 2025-11-13 |
| Wedbush | Maintain | Outperform | 2025-11-13 |
| JP Morgan | Maintain | Neutral | 2025-11-13 |
| Evercore ISI Group | Maintain | Outperform | 2025-11-13 |
| B of A Securities | Downgrade | Underperform | 2025-10-13 |
| Deutsche Bank | Maintain | Buy | 2025-08-06 |
| Morgan Stanley | Maintain | Equal Weight | 2025-08-06 |
| Wedbush | Maintain | Outperform | 2025-08-06 |
GLOBALFOUNDRIES shows mixed ratings, with recent downgrades to Neutral and Underperform but also several Outperform and Buy ratings earlier in the year.
Which company has the best grades?
NXP Semiconductors N.V. holds a stronger and more consistent positive grading profile compared to GLOBALFOUNDRIES Inc., which exhibits a wider range of ratings including downgrades. Investors might interpret NXP’s steady Buy and Overweight ratings as reflecting greater analyst confidence.
Strengths and Weaknesses
Below is a comparison of key strengths and weaknesses for NXP Semiconductors N.V. (NXPI) and GLOBALFOUNDRIES Inc. (GFS) based on the most recent financial and operational data.
| Criterion | NXP Semiconductors N.V. (NXPI) | GLOBALFOUNDRIES Inc. (GFS) |
|---|---|---|
| Diversification | Focused on High Performance Mixed Signal; limited product range but strong specialization | Mainly Water Fabrication and Engineering Services; somewhat concentrated but with stable segments |
| Profitability | Strong profitability with 19.9% net margin and ROIC of 12.91% (favorable) | Negative profitability; -3.93% net margin and negative ROIC (-2.26%) (unfavorable) |
| Innovation | High innovation level supporting growing ROIC and durable competitive advantage | Moderate innovation with improving ROIC trend but still value-destroying overall |
| Global presence | Broad global reach with significant market share in semiconductor segment | Global player but smaller scale and more niche fabrication services |
| Market Share | Strong presence in high-performance mixed signal semiconductor market | Smaller market share, focused on wafer fabrication services |
Key takeaways: NXP Semiconductors demonstrates a durable competitive advantage with strong profitability and a growing return on invested capital, making it a more favorable investment. In contrast, GLOBALFOUNDRIES, while showing improving operational metrics, still struggles with negative profitability and value destruction, posing higher investment risk.
Risk Analysis
Below is a comparative overview of key risk factors for NXP Semiconductors N.V. (NXPI) and GLOBALFOUNDRIES Inc. (GFS) based on the latest 2024 data.
| Metric | NXP Semiconductors N.V. (NXPI) | GLOBALFOUNDRIES Inc. (GFS) |
|---|---|---|
| Market Risk | Beta 1.47 indicates moderate volatility | Beta 1.48 indicates moderate volatility |
| Debt Level | Debt-to-Equity 1.18 (unfavorable, higher leverage) | Debt-to-Equity 0.22 (favorable, low leverage) |
| Regulatory Risk | Exposure to global semiconductor regulations, especially in China and US | Similar regulatory exposure, US-based with international operations |
| Operational Risk | Large global footprint with 33,100 employees; supply chain complexity | Smaller scale with 13,000 employees; operational dependency on wafer fabrication |
| Environmental Risk | Semiconductor manufacturing has significant energy and chemical usage | Similar environmental impact due to foundry operations |
| Geopolitical Risk | Operations in multiple countries including China and the Netherlands | US-based but with global supply chain exposure |
The most impactful risks for NXPI hinge on its higher leverage and geopolitical tensions affecting semiconductor supply chains, especially relating to China. For GFS, operational challenges and consistent negative profitability pose significant risks, despite lower debt levels. Both companies remain exposed to market volatility typical of the semiconductor sector.
Which Stock to Choose?
NXP Semiconductors N.V. (NXPI) shows a favorable income statement with a 19.9% net margin and strong profitability metrics such as a 27.33% ROE and 12.91% ROIC, despite a slight 5% revenue decline last year. The company carries moderate debt with a net debt to EBITDA of 1.77 and a solid current ratio of 2.36. Its overall financial ratios are slightly favorable, supported by a very favorable rating and a durable competitive advantage indicated by a ROIC comfortably above WACC.
GLOBALFOUNDRIES Inc. (GFS) reports an unfavorable income statement with a negative net margin of -3.93% and negative profitability ratios, including a -2.46% ROE and -2.26% ROIC. Revenue fell by nearly 9% last year, and although debt levels are low with a net debt to EBITDA of 0.09, the company’s financial ratios are mostly unfavorable. Its rating remains very favorable overall but is tempered by challenges in profitability and an economic moat evaluation signaling value destruction despite improving ROIC trends.
For investors, NXPI might appear more suitable for those seeking a quality investment with a strong economic moat and consistent profitability, while GFS might be seen by more risk-tolerant investors focusing on potential turnaround opportunities given its improving ROIC but current value destruction and weaker income metrics. The choice could depend on whether an investor prioritizes durable profitability or is willing to accept higher risk for possible recovery.
Disclaimer: Investment carries a risk of loss of initial capital. The past performance is not a reliable indicator of future results. Be sure to understand risks before making an investment decision.
Go Further
I encourage you to read the complete analyses of NXP Semiconductors N.V. and GLOBALFOUNDRIES Inc. to enhance your investment decisions: