Home > Comparison > Consumer Cyclical > PHM vs NVR
The strategic rivalry between PulteGroup, Inc. and NVR, Inc. defines the current trajectory of the U.S. residential construction sector. PulteGroup operates as a broad-market homebuilder with diverse brand offerings and significant land holdings. NVR, Inc. focuses on a leaner, asset-light model emphasizing select regional markets. This analysis will determine which operational approach delivers superior risk-adjusted returns for a diversified portfolio navigating cyclical housing dynamics.

Table of contents
Companies Overview
PulteGroup and NVR stand as key players in the US residential construction market, each commanding a distinct footprint.
PulteGroup, Inc.: Diverse Residential Homebuilder
PulteGroup dominates the US homebuilding sector with a broad portfolio of single-family homes, townhomes, and condominiums. It generates revenue by acquiring and developing land, then constructing homes under multiple brand names. In 2026, its strategic focus remains on land acquisition and offering diverse housing designs to meet varied buyer needs.
NVR, Inc.: Focused Homebuilder with Mortgage Services
NVR operates as a homebuilder and mortgage servicer, specializing in single-family homes, townhomes, and condos. It earns revenue through home sales and mortgage banking, targeting first-time and luxury buyers across multiple East Coast and Midwest markets. Its 2026 strategy emphasizes integrated mortgage services coupled with selective geographic expansion.
Strategic Collision: Similarities & Divergences
Both companies emphasize residential construction but differ in approach. PulteGroup pursues a diverse brand strategy and land ownership, while NVR integrates mortgage banking and targets specific buyer segments. Their primary battleground is market share in single-family homes. PulteGroup offers broader exposure, whereas NVR’s model blends homebuilding with financial services, defining distinct risk and growth profiles.
Income Statement Comparison
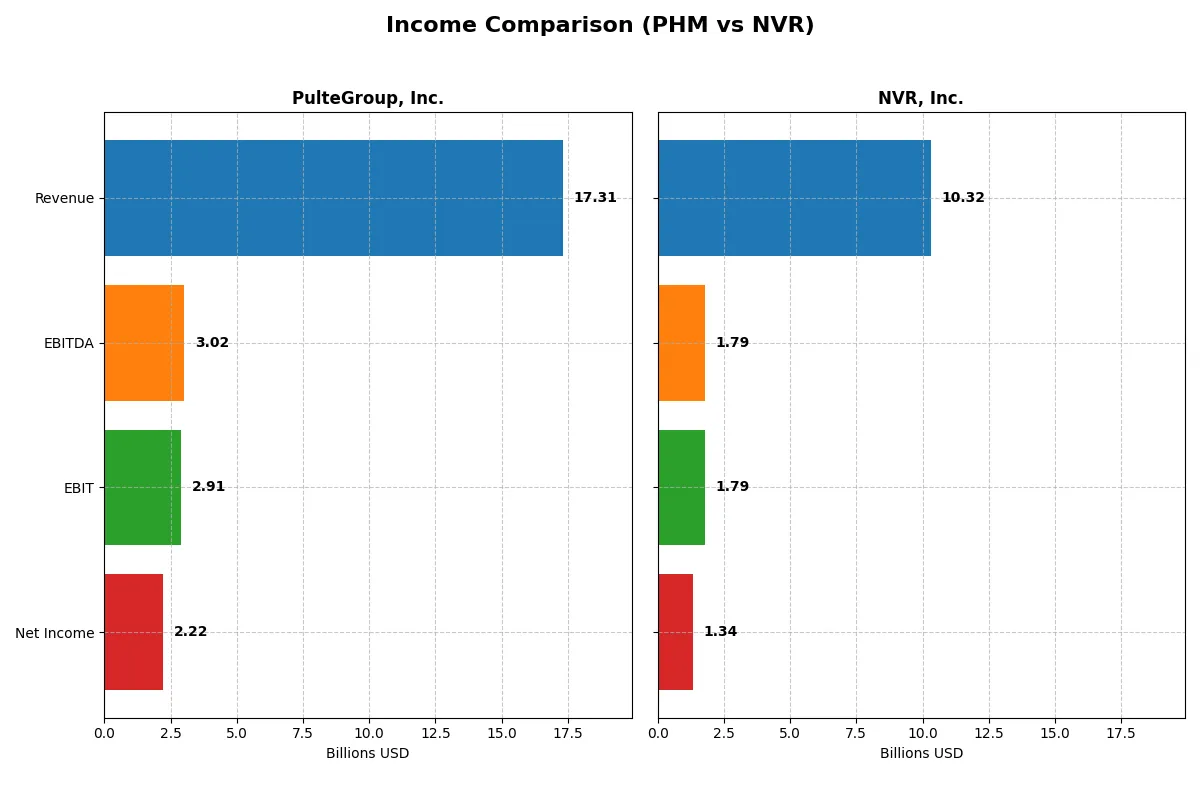
This detailed data dissects the core profitability and scalability of both corporate engines to reveal who dominates the bottom line:
| Metric | PulteGroup, Inc. (PHM) | NVR, Inc. (NVR) |
|---|---|---|
| Revenue | 17.3B | 10.3B |
| Cost of Revenue | 12.7B | 7.95B |
| Operating Expenses | 1.57B | 0.70B |
| Gross Profit | 4.57B | 2.37B |
| EBITDA | 3.02B | 1.79B |
| EBIT | 2.91B | 1.79B |
| Interest Expense | 0 | 0.03B |
| Net Income | 2.22B | 1.34B |
| EPS | 11.21 | 462.00 |
| Fiscal Year | 2025 | 2025 |
Income Statement Analysis: The Bottom-Line Duel
This comparison uncovers how efficiently PulteGroup and NVR convert revenue into profit, revealing their operational strength and bottom-line resilience.
PulteGroup, Inc. Analysis
PulteGroup’s revenue rose from $13.7B in 2021 to $17.3B in 2025, showing a 26% growth over five years. Net income climbed 14% overall, reaching $2.2B in 2025 despite a 3.5% revenue drop last year. Gross margin remains strong at 26.4%, with a net margin of 12.8%, though both contracted recently, signaling margin pressure and slowing momentum.
NVR, Inc. Analysis
NVR’s revenue expanded 15% from $8.9B in 2021 to $10.3B in 2025. Net income grew 8.3% overall, hitting $1.3B in 2025 amid a 2% revenue decline last year. Gross margin holds at 23%, and net margin at 13%, with EBIT margin slightly higher than PulteGroup’s. Margins contracted less sharply, but profitability growth showed signs of deceleration.
Margin Power vs. Revenue Scale
PulteGroup outpaces NVR in revenue scale and absolute net income, benefiting from higher top-line growth despite recent margin compression. NVR maintains a marginally superior EBIT margin and steadier margin contraction. For investors, PulteGroup offers more scale and growth potential, while NVR appeals with consistent profitability ratios and operational discipline.
Financial Ratios Comparison
These vital ratios act as a diagnostic tool to expose the underlying fiscal health, valuation premiums, and capital efficiency of the companies analyzed:
| Ratios | PulteGroup, Inc. (PHM) | NVR, Inc. (NVR) |
|---|---|---|
| ROE | 17.1% | 34.7% |
| ROIC | 159.8% | 25.8% |
| P/E | 10.5 | 15.8 |
| P/B | 1.79 | 5.47 |
| Current Ratio | 20.6 | 3.95 |
| Quick Ratio | -17810.4 | 2.12 |
| D/E (Debt-to-Equity) | 0.00013 | 0.31 |
| Debt-to-Assets | 10.9% | 20.4% |
| Interest Coverage | 0 | 58.0 |
| Asset Turnover | 1152.4 | 1.76 |
| Fixed Asset Turnover | 0 | 41.97 |
| Payout ratio | 7.96% | 0 |
| Dividend yield | 0.76% | 0 |
| Fiscal Year | 2025 | 2025 |
Efficiency & Valuation Duel: The Vital Signs
Financial ratios act as a company’s DNA, uncovering hidden risks and operational strengths vital for investment decisions.
PulteGroup, Inc.
PulteGroup delivers solid profitability with a 17.1% ROE and a favorable 12.8% net margin. The stock trades at a modest 10.5 P/E, reflecting reasonable valuation. Despite an impressive 15984% ROIC, the dividend yield is low at 0.76%, indicating limited cash returned to shareholders amid reinvestment or debt management.
NVR, Inc.
NVR posts an outstanding 34.7% ROE and a strong 13.0% net margin, but trades at a higher 15.8 P/E, suggesting a stretched valuation. Its ROIC of 25.9% remains healthy. NVR pays no dividends, signaling a strategy focused on growth or buybacks. The company maintains solid liquidity and leverage metrics, supporting its operational efficiency.
Premium Valuation vs. Operational Safety
NVR offers superior returns but demands a premium valuation, while PulteGroup balances attractive valuation with strong profitability. Investors prioritizing growth and high returns may lean toward NVR, whereas those seeking value with operational stability might prefer PulteGroup.
Which one offers the Superior Shareholder Reward?
I see PulteGroup, Inc. (PHM) pays a modest dividend yield near 0.76% with a conservative payout ratio around 5–8%, well covered by free cash flow. Its buyback program appears moderate, supporting shareholder returns without compromising reinvestment capacity. NVR, Inc. (NVR) does not pay dividends but aggressively repurchases shares, using substantial free cash flow for buybacks, enhancing per-share value. Historically, NVR’s capital allocation favors growth and share repurchases over dividends, reflecting a strong reinvestment strategy. Considering sustainability, PHM’s balanced distributions and steady dividends provide income and growth, while NVR’s buyback intensity drives capital gains but lacks income. In 2026, I favor NVR’s total return profile for growth-focused investors, though income seekers may prefer PHM’s dividend consistency.
Comparative Score Analysis: The Strategic Profile
The radar chart reveals the core financial DNA and strategic trade-offs of PulteGroup, Inc. and NVR, Inc., highlighting their competitive strengths and weaknesses:
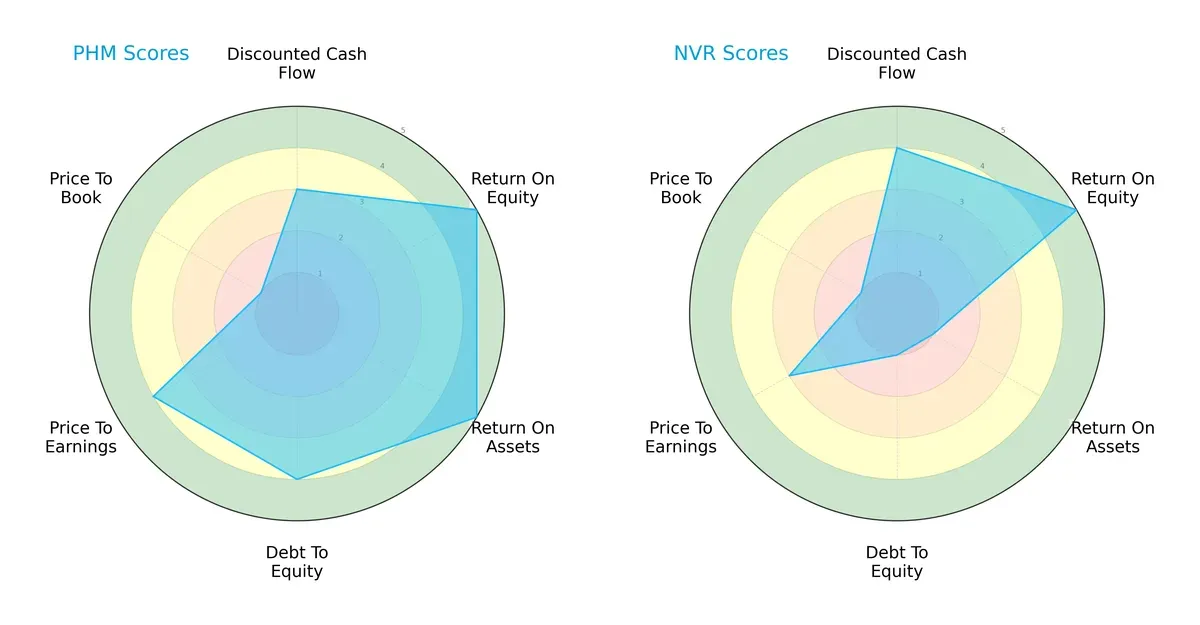
PulteGroup shows a balanced profile with strong ROE (5) and ROA (5), solid debt management (4), and favorable valuation (P/E 4). NVR excels in discounted cash flow (4) and ROE (5) but struggles with asset efficiency (ROA 1) and high financial risk (Debt/Equity 1). PulteGroup’s diversified strengths suggest a more stable investment, while NVR relies heavily on equity returns despite leverage concerns.
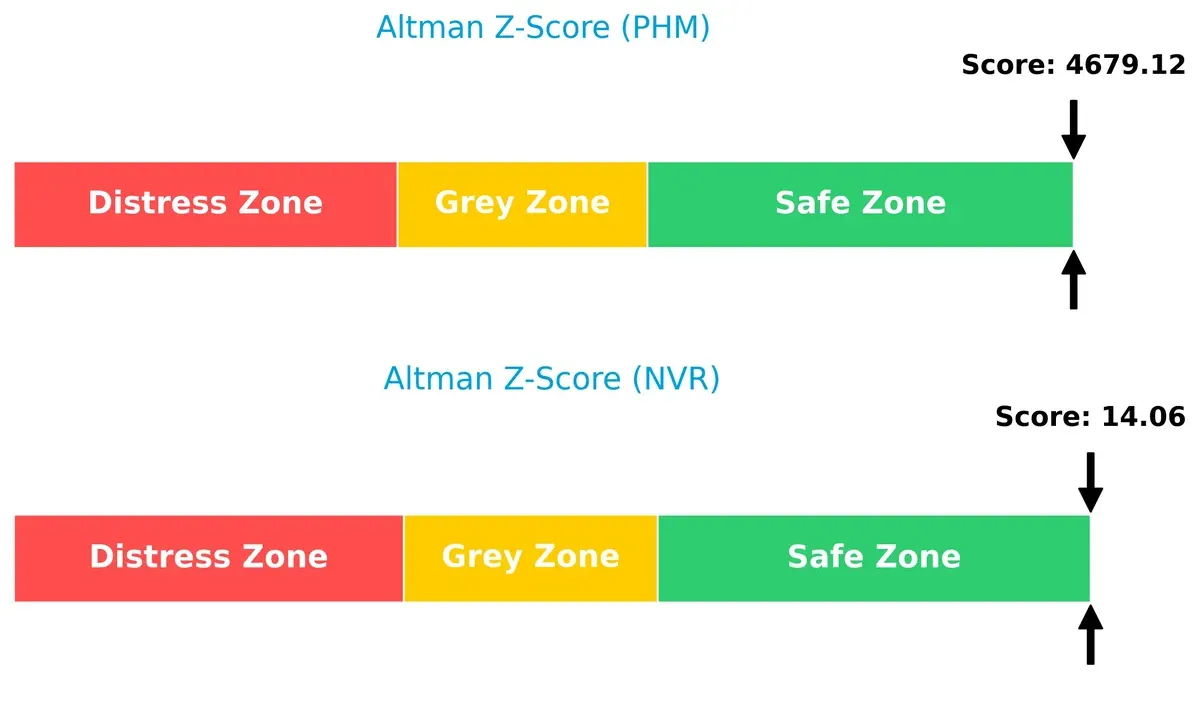
Bankruptcy Risk: Solvency Showdown
PulteGroup’s Altman Z-Score of 4679 vastly exceeds NVR’s 14, signaling robust solvency and negligible bankruptcy risk for both firms in this cycle:
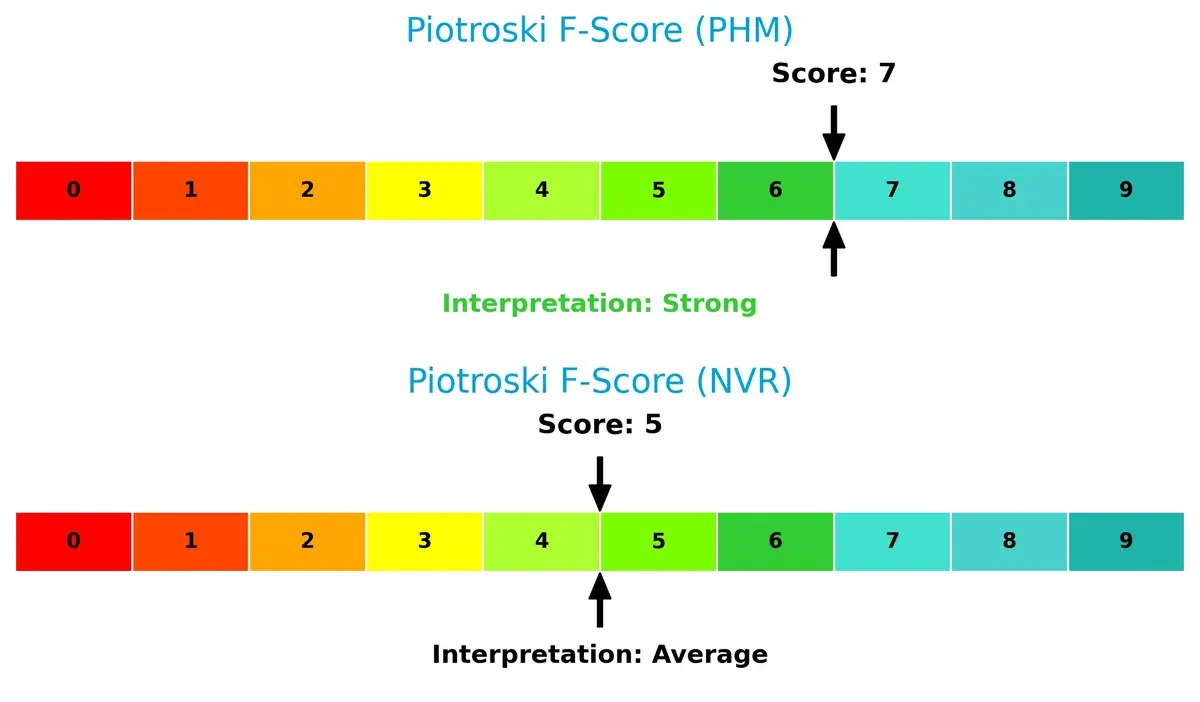
Financial Health: Quality of Operations
PulteGroup’s Piotroski F-Score of 7 indicates strong financial health, outperforming NVR’s average score of 5, which flags potential operational weaknesses:
How are the two companies positioned?
This section dissects the operational DNA of PulteGroup and NVR by comparing their revenue distribution and internal strengths and weaknesses. The goal is to confront their economic moats to determine which business model offers the most resilient, sustainable advantage today.
Revenue Segmentation: The Strategic Mix
The following visual comparison dissects how both firms diversify their income streams and where their primary sector bets lie:
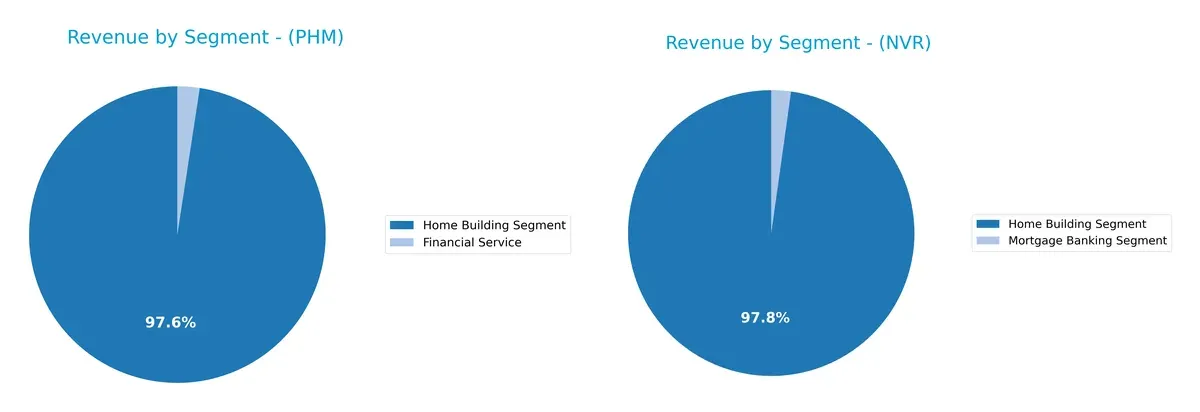
PulteGroup anchors its revenue heavily in the Home Building Segment, generating $17.5B in 2024, dwarfing its $433M Financial Service income. NVR, meanwhile, pivots mainly on Home Building at $10.3B, with a smaller but consistent Mortgage Banking Segment of $232M. PulteGroup’s concentration signals reliance on housing volume, while NVR’s modest segment diversification adds a slight cushion against cyclical housing risks.
Strengths and Weaknesses Comparison
This table compares the strengths and weaknesses of PulteGroup, Inc. (PHM) and NVR, Inc. (NVR):
PHM Strengths
- High net margin at 12.82%
- Strong ROE of 17.09%
- Exceptional ROIC far above WACC
- Zero debt enhances financial stability
- Large diversified revenue streams from home building and financial services
- Broad geographic presence across multiple U.S. regions
NVR Strengths
- Slightly higher net margin at 12.98%
- Superior ROE at 34.67% indicates efficient capital use
- ROIC well above WACC supports value creation
- Favorable quick ratio shows liquidity
- Effective debt management with moderate leverage
- Geographic focus with strong regional homebuilding segments
PHM Weaknesses
- Unfavorable current and quick ratios suggest liquidity risks
- Zero fixed asset turnover implies potential asset underutilization
- Low dividend yield at 0.76% could deter income investors
- Neutral WACC and PB ratio indicate valuation uncertainty
NVR Weaknesses
- Unfavorable PB ratio of 5.47 could signal overvaluation
- Current ratio below ideal levels poses liquidity concern
- Absence of dividend yield may limit income appeal
- Neutral P/E ratio suggests moderate market expectations
Both companies demonstrate strong profitability and favorable capital efficiency, with PHM exhibiting greater diversification and zero debt. However, PHM’s liquidity ratios raise caution. NVR excels in return on equity but faces valuation concerns and some liquidity constraints. These factors may guide each firm’s strategic focus on financial structure and market positioning.
The Moat Duel: Analyzing Competitive Defensibility
A structural moat shields long-term profits from relentless competition erosion. Let’s examine how PulteGroup and NVR defend their turf:
PulteGroup, Inc.: Land Control and Operational Efficiency Moat
PulteGroup’s moat stems from extensive land ownership and efficient capital use, reflected in a soaring ROIC far above WACC. This operational edge supports margin stability despite recent volume dips. Expansion into diverse housing markets in 2026 could deepen its land advantage.
NVR, Inc.: Cost Discipline and Market Focus Moat
NVR relies on cost advantage and focused regional homebuilding. Its ROIC exceeds WACC with steady growth, showcasing disciplined capital allocation. Unlike PulteGroup’s broad land control, NVR’s lean model drives profitability and offers room to disrupt mid-Atlantic markets further.
Land Control vs. Cost Efficiency: The Moat Showdown
Both firms demonstrate very favorable moats with ROIC outpacing WACC, but PulteGroup’s massive land bank grants a wider moat. NVR’s tighter cost structure builds a deep but narrower moat. Overall, PulteGroup is better positioned to sustain market share amid evolving housing demands.
Which stock offers better returns?
The past year shows PulteGroup, Inc. with a strong upward momentum, while NVR, Inc. also advances but with less pronounced gains.
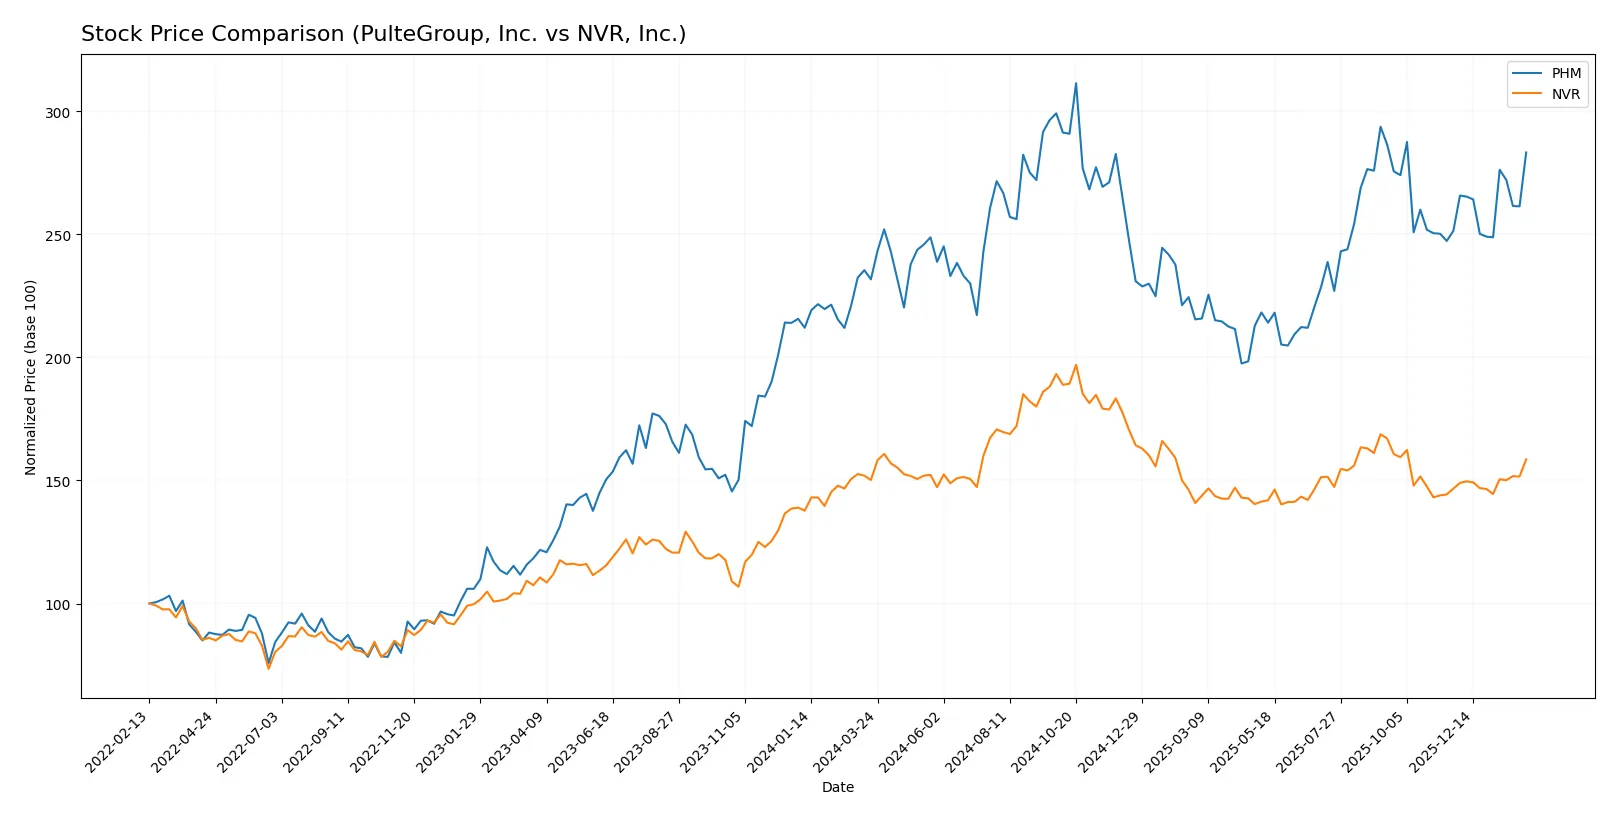
Trend Comparison
PulteGroup, Inc. posts a 22.24% price rise over 12 months, signaling a bullish trend with accelerating gains and a volatility (std deviation) of 12.47.
NVR, Inc. gains 5.57% in the same period, also bullish with acceleration, but exhibits extreme price swings, reflected by a high std deviation of 726.
PulteGroup’s returns outpace NVR’s, delivering the highest market performance and more consistent price appreciation over the past year.
Target Prices
Analysts present a clear consensus on price targets for PulteGroup, Inc. and NVR, Inc.
| Company | Target Low | Target High | Consensus |
|---|---|---|---|
| PulteGroup, Inc. | 115 | 159 | 137.29 |
| NVR, Inc. | 8,350 | 9,022 | 8,686 |
The target consensus for PulteGroup sits slightly above its current price of 135, signaling moderate upside potential. NVR’s consensus target far exceeds its current price near 7,987, highlighting strong expected appreciation by analysts.

Don’t Let Luck Decide Your Entry Point
Optimize your entry points with our advanced ProRealTime indicators. You’ll get efficient buy signals with precise price targets for maximum performance. Start outperforming now!
How do institutions grade them?
Here is a comparison of recent institutional grades for PulteGroup, Inc. and NVR, Inc.:
PulteGroup, Inc. Grades
The table below shows recent grades from major financial institutions for PulteGroup, Inc.:
| Grading Company | Action | New Grade | Date |
|---|---|---|---|
| JP Morgan | Maintain | Overweight | 2026-02-03 |
| Citigroup | Maintain | Neutral | 2026-02-03 |
| Oppenheimer | Maintain | Outperform | 2026-01-30 |
| RBC Capital | Maintain | Sector Perform | 2026-01-30 |
| Wells Fargo | Maintain | Overweight | 2026-01-14 |
| Citigroup | Maintain | Neutral | 2026-01-08 |
| Wells Fargo | Maintain | Overweight | 2026-01-06 |
| UBS | Maintain | Buy | 2026-01-06 |
| Evercore ISI Group | Maintain | In Line | 2025-10-22 |
| B of A Securities | Maintain | Buy | 2025-10-10 |
NVR, Inc. Grades
The table below shows recent grades from major financial institutions for NVR, Inc.:
| Grading Company | Action | New Grade | Date |
|---|---|---|---|
| Zelman & Assoc | Upgrade | Hold | 2026-01-29 |
| UBS | Maintain | Neutral | 2026-01-06 |
| UBS | Maintain | Neutral | 2025-10-23 |
| B of A Securities | Maintain | Buy | 2025-10-10 |
| UBS | Maintain | Neutral | 2025-07-24 |
| JP Morgan | Maintain | Neutral | 2025-07-24 |
| UBS | Maintain | Neutral | 2025-04-23 |
| UBS | Maintain | Neutral | 2025-01-29 |
| JP Morgan | Maintain | Neutral | 2025-01-29 |
| UBS | Maintain | Neutral | 2025-01-08 |
Which company has the best grades?
PulteGroup, Inc. generally receives stronger grades, including multiple Overweight and Buy ratings. NVR, Inc. mostly earns Neutral grades with one recent upgrade to Hold. This difference may influence investors seeking higher conviction from analysts.
Risks specific to each company
The following categories identify the critical pressure points and systemic threats facing both firms in the 2026 market environment:
1. Market & Competition
PulteGroup, Inc.
- Faces intense competition in diversified home designs across the US, with pressure on pricing and market share.
NVR, Inc.
- Operates in multiple states with a focus on higher-end homes; faces competition but benefits from strong brand loyalty.
2. Capital Structure & Debt
PulteGroup, Inc.
- Maintains low debt levels with a debt-to-assets ratio of 10.86%, indicating conservative leverage.
NVR, Inc.
- Higher debt-to-assets ratio of 20.43% introduces moderate leverage risk despite strong interest coverage.
3. Stock Volatility
PulteGroup, Inc.
- Beta of 1.343 signals above-market volatility, increasing risk in turbulent markets.
NVR, Inc.
- Beta of 1.035 indicates near-market volatility, offering somewhat more stability.
4. Regulatory & Legal
PulteGroup, Inc.
- Subject to evolving residential construction regulations and mortgage lending rules nationwide.
NVR, Inc.
- Similarly impacted by regulatory shifts, with additional complexity in mortgage banking operations.
5. Supply Chain & Operations
PulteGroup, Inc.
- Controls 228K lots, a strong land bank but exposes it to land option agreement risks.
NVR, Inc.
- Operations spread across many states; supply chain disruptions could impact construction timelines more significantly.
6. ESG & Climate Transition
PulteGroup, Inc.
- Faces pressure to improve sustainability in materials and reduce carbon footprint amid rising ESG standards.
NVR, Inc.
- Must accelerate climate transition efforts, especially in energy-efficient homebuilding and mortgage-related disclosures.
7. Geopolitical Exposure
PulteGroup, Inc.
- Primarily US-focused with limited direct geopolitical risk but sensitive to national economic policies.
NVR, Inc.
- Also US-centric; regional economic disparities could affect sales in specific states.
Which company shows a better risk-adjusted profile?
PulteGroup’s low leverage and extensive land holdings mitigate financial and operational risks but its high stock volatility and liquidity ratios raise caution. NVR’s moderate leverage and stable beta offer steadier stock performance, yet its higher debt and regional exposure pose notable risks. Both firms navigate complex regulatory and ESG pressures, but PulteGroup’s balance sheet strength gives it a slight edge on risk-adjusted grounds in 2026.
Final Verdict: Which stock to choose?
PulteGroup’s superpower lies in its extraordinary capital efficiency, delivering returns on invested capital that far outpace its cost of capital. This signals excellent value creation and disciplined management. However, its extremely high current ratio suggests a working capital imbalance—a point of vigilance. It fits well in aggressive growth portfolios seeking strong operational leverage.
NVR’s strategic moat is its consistent ability to generate high returns on equity with a well-protected premium pricing model. It offers better financial safety than PulteGroup, with manageable leverage and solid liquidity metrics. This makes it suitable for GARP investors who value steady growth paired with reasonable risk controls.
If you prioritize aggressive value creation and operational leverage, PulteGroup is the compelling choice due to its unmatched ROIC superiority. However, if you seek a balance of growth and stability with a resilient competitive moat, NVR offers better risk-adjusted stability and premium market positioning. Both present solid cases, but your portfolio’s risk appetite should guide your analytical scenario.
Disclaimer: Investment carries a risk of loss of initial capital. The past performance is not a reliable indicator of future results. Be sure to understand risks before making an investment decision.
Go Further
I encourage you to read the complete analyses of PulteGroup, Inc. and NVR, Inc. to enhance your investment decisions: