In the dynamic semiconductor industry, NVIDIA Corporation and Tower Semiconductor Ltd. stand out as influential players with distinct approaches. NVIDIA leads in graphics processing and AI-driven computing, while Tower specializes in analog-intensive mixed-signal semiconductor manufacturing. Their overlapping markets and innovation strategies make them compelling comparables. This article will guide you in assessing which company presents the most attractive investment opportunity for your portfolio in 2026.

Table of contents
Companies Overview
I will begin the comparison between NVIDIA Corporation and Tower Semiconductor Ltd. by providing an overview of these two companies and their main differences.
NVIDIA Overview
NVIDIA Corporation is a leading technology company specializing in graphics and compute solutions across various markets including gaming, professional visualization, datacenter, and automotive sectors. Its offerings range from GeForce GPUs and cloud gaming services to AI platforms and autonomous vehicle solutions. Headquartered in Santa Clara, California, NVIDIA operates globally with a workforce of 36,000 employees and holds a dominant position in the semiconductor industry.
Tower Semiconductor Overview
Tower Semiconductor Ltd. is an independent semiconductor foundry focused on manufacturing analog intensive mixed-signal devices with customizable technologies like SiGe, BiCMOS, RF CMOS, and MEMS. Serving diverse sectors such as consumer electronics, automotive, aerospace, and medical devices, Tower operates internationally from its headquarters in Migdal Haemek, Israel. It employs around 5,600 people and provides wafer fabrication and design enablement services to fabless companies and integrated device manufacturers.
Key similarities and differences
Both NVIDIA and Tower Semiconductor operate in the semiconductor industry and serve multiple global markets. However, NVIDIA’s business is centered on designing and selling high-performance GPUs and AI computing platforms, while Tower functions primarily as a foundry offering manufacturing and process technologies. NVIDIA’s scale is significantly larger with a market cap exceeding 4.4T USD, compared to Tower’s 13.7B USD, reflecting their differing roles and market focus within the sector.
Income Statement Comparison
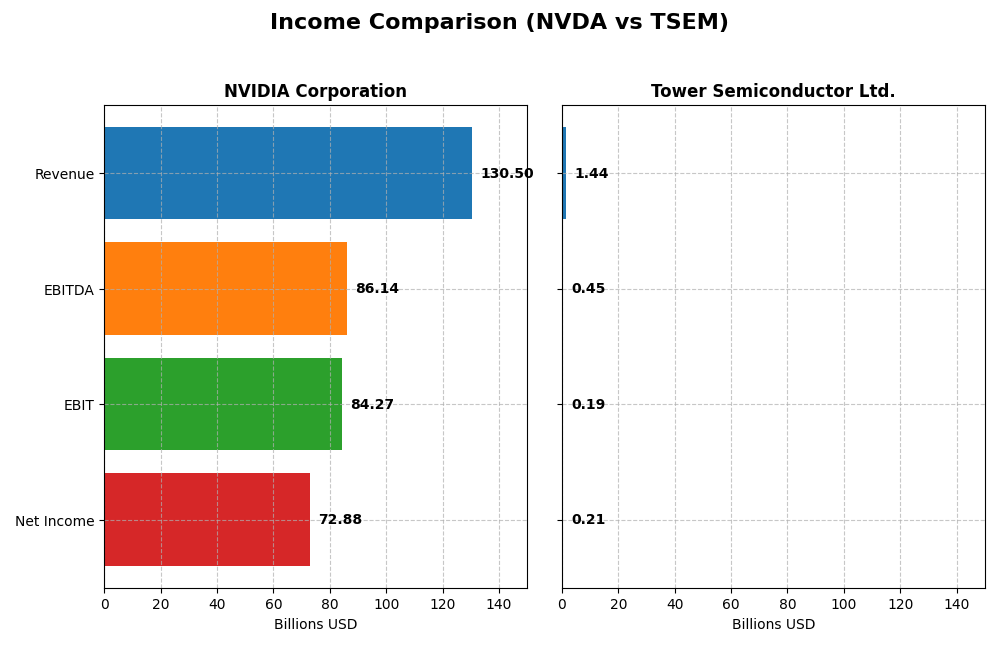
This table presents a side-by-side comparison of key income statement metrics for NVIDIA Corporation and Tower Semiconductor Ltd. for their most recent fiscal years.
| Metric | NVIDIA Corporation | Tower Semiconductor Ltd. |
|---|---|---|
| Market Cap | 4.46T | 13.77B |
| Revenue | 130.50B | 1.44B |
| EBITDA | 86.14B | 451M |
| EBIT | 84.27B | 185M |
| Net Income | 72.88B | 208M |
| EPS | 2.97 | 1.87 |
| Fiscal Year | 2025 | 2024 |
Income Statement Interpretations
NVIDIA Corporation
NVIDIA’s revenue and net income displayed robust growth from 2021 to 2025, with revenue surging from $16.7B to $130.5B and net income rising sharply to $72.9B. Margins remained strong and improved, with a gross margin near 75% and net margin at 55.85%. The latest year reflected accelerated growth, signaling significant operational efficiency and profitability gains.
Tower Semiconductor Ltd.
Tower Semiconductor showed moderate revenue growth from $1.27B in 2020 to $1.44B in 2024, with net income increasing from $82M to $208M overall. Margins were stable but considerably lower than NVIDIA’s, with a gross margin of 23.64% and net margin of 14.47%. However, the most recent year saw a slight revenue increase but a decline in net income and margins, indicating some pressure on profitability.
Which one has the stronger fundamentals?
NVIDIA exhibits stronger fundamentals with exceptional revenue and net income growth, high and improving margins, and consistent profitability enhancements. Tower Semiconductor has favorable but more modest improvements overall, with recent setbacks in margin and profitability growth. Thus, NVIDIA’s financial performance appears more robust and scalable during the observed periods.
Financial Ratios Comparison
The table below presents the most recent key financial ratios for NVIDIA Corporation and Tower Semiconductor Ltd., offering a snapshot of their financial performance and stability in fiscal year 2025 and 2024 respectively.
| Ratios | NVIDIA Corporation (2025) | Tower Semiconductor Ltd. (2024) |
|---|---|---|
| ROE | 91.9% | 7.8% |
| ROIC | 75.3% | 6.4% |
| P/E | 39.9 | 27.5 |
| P/B | 36.7 | 2.16 |
| Current Ratio | 4.44 | 6.18 |
| Quick Ratio | 3.88 | 5.23 |
| D/E (Debt-to-Equity) | 0.13 | 0.068 |
| Debt-to-Assets | 9.2% | 5.9% |
| Interest Coverage | 330.0 | 32.6 |
| Asset Turnover | 1.17 | 0.47 |
| Fixed Asset Turnover | 16.2 | 1.11 |
| Payout ratio | 1.1% | 0% |
| Dividend yield | 0.029% | 0% |
Interpretation of the Ratios
NVIDIA Corporation
NVIDIA shows strong profitability ratios with net margin at 55.85% and ROE at 91.87%, both favorable, indicating robust earnings generation. However, valuation metrics like P/E at 39.9 and P/B at 36.66 are high, which may concern some investors. The company pays a modest dividend with a yield of 0.03%, reflecting a cautious distribution policy supported by strong free cash flow coverage.
Tower Semiconductor Ltd.
Tower Semiconductor displays moderate net margin at 14.47%, but a low ROE at 7.83%, which is unfavorable, suggesting limited profitability relative to equity. The P/E ratio of 27.54 also raises valuation concerns. The company does not pay dividends, likely due to reinvestment in growth and R&D. Its financial leverage and interest coverage are favorable, supporting operational stability.
Which one has the best ratios?
NVIDIA holds a more favorable overall ratio profile with superior profitability and cash flow metrics despite some valuation and liquidity concerns. Tower Semiconductor’s ratios are slightly favorable but reflect modest returns and no dividend payout, indicating a more conservative or growth-focused approach. The choice depends on investors’ preference for growth versus value stability.
Strategic Positioning
This section compares the strategic positioning of NVIDIA Corporation and Tower Semiconductor Ltd., including market position, key segments, and exposure to technological disruption:
NVIDIA Corporation
- Leading market position in semiconductors with high competitive pressure due to innovation demands.
- Diverse segments: Data Center, Gaming, Automotive, Professional Visualization, and OEM products drive growth.
- High exposure to technological disruption through AI, HPC, autonomous driving, and cloud computing platforms.
Tower Semiconductor Ltd.
- Smaller market cap with moderate competition in foundry services and analog semiconductors.
- Focused on analog mixed-signal semiconductors and wafer fabrication for varied industries.
- Exposure concentrated on process technologies like SiGe, BiCMOS, and RF CMOS with incremental innovation.
NVIDIA Corporation vs Tower Semiconductor Ltd. Positioning
NVIDIA employs a diversified strategy across multiple high-growth segments with strong innovation drivers, whereas Tower Semiconductor concentrates on customizable analog and mixed-signal foundry services, offering niche specialization but less diversification.
Which has the best competitive advantage?
NVIDIA demonstrates a very favorable moat with strong value creation and growing profitability, indicating a durable competitive advantage. Tower Semiconductor shows slightly unfavorable moat status, shedding value despite improving profitability.
Stock Comparison
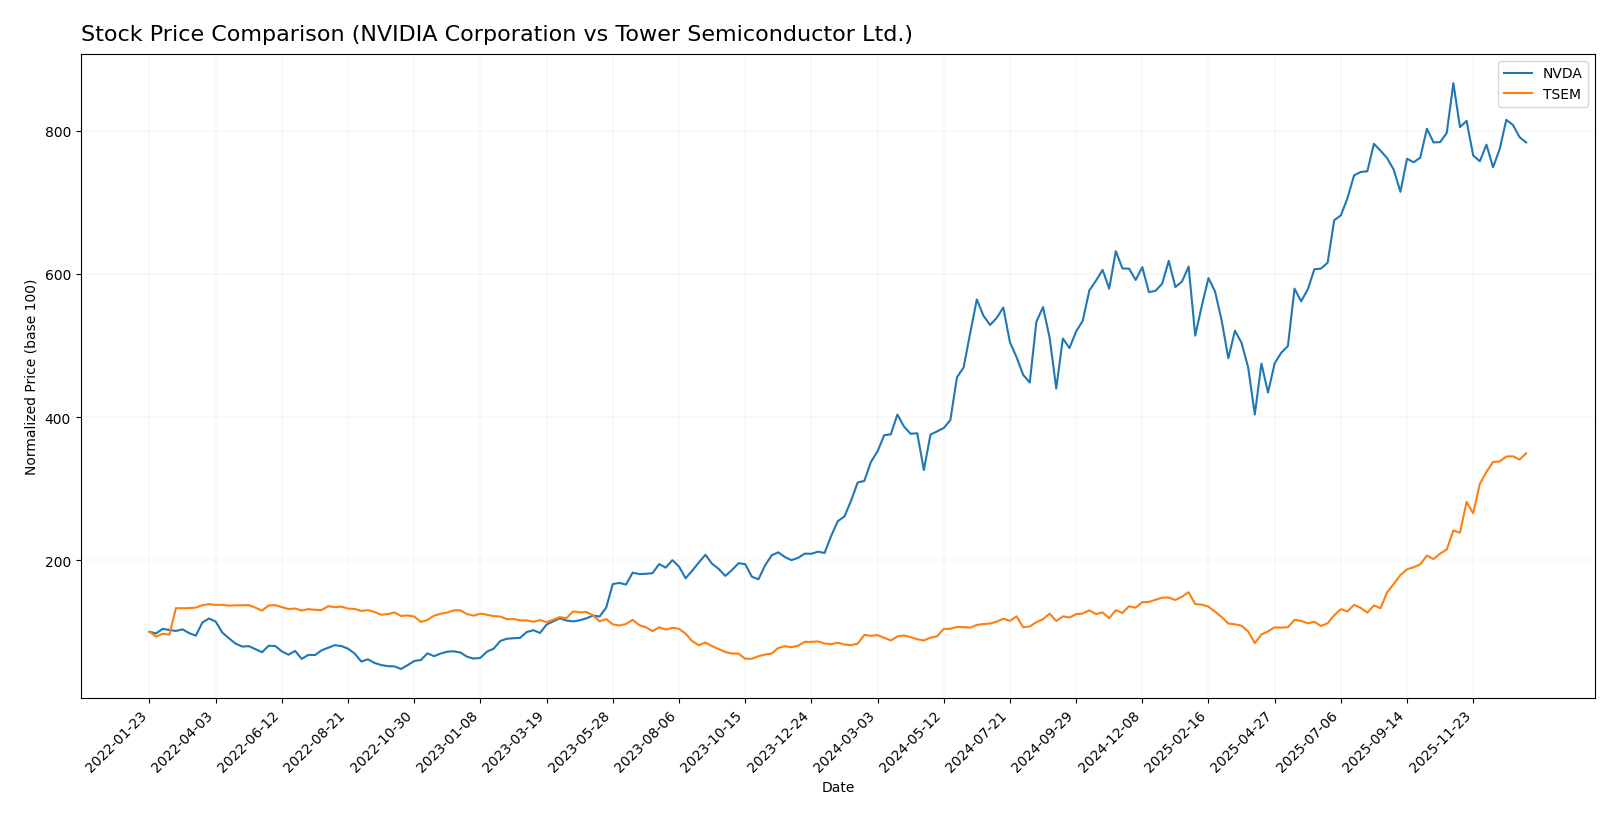
The stock price movements of NVIDIA Corporation and Tower Semiconductor Ltd. over the past 12 months reveal significant gains with contrasting recent dynamics, highlighting varied investor sentiment and trading momentum.
Trend Analysis
NVIDIA Corporation’s stock recorded a bullish trend over the past year with a 132.35% price increase but showed deceleration. The recent period reveals a -9.56% decline, indicating a short-term bearish correction.
Tower Semiconductor Ltd. experienced a stronger bullish trend with a 270.3% price increase over the year and accelerating momentum. Recently, it gained 44.65%, reflecting sustained strong buyer dominance.
Comparing both, Tower Semiconductor outperformed NVIDIA, delivering the highest market performance with more pronounced acceleration and recent gains.
Target Prices
Here is the current target price consensus from verified analysts for NVIDIA Corporation and Tower Semiconductor Ltd.
| Company | Target High | Target Low | Consensus |
|---|---|---|---|
| NVIDIA Corporation | 352 | 140 | 264.34 |
| Tower Semiconductor Ltd. | 125 | 66 | 96 |
Analysts expect NVIDIA’s share price to rise significantly above the current 183.14 USD, reflecting strong growth potential. Tower Semiconductor’s consensus target is slightly below its current 123.2 USD price, indicating more cautious outlooks.
Analyst Opinions Comparison
This section compares analysts’ ratings and grades for NVIDIA Corporation and Tower Semiconductor Ltd.:
Rating Comparison
NVIDIA Corporation Rating
- Rating: B+, classified as Very Favorable by analysts.
- Discounted Cash Flow Score: 3, indicating a Moderate level of valuation confidence.
- ROE Score: 5, showing a Very Favorable efficiency in generating profit from equity.
- ROA Score: 5, reflecting Very Favorable asset utilization to generate earnings.
- Debt To Equity Score: 3, considered Moderate financial risk.
- Overall Score: 3, indicating a Moderate overall financial standing.
Tower Semiconductor Ltd. Rating
- Rating: B+, classified as Very Favorable by analysts.
- Discounted Cash Flow Score: 3, indicating a Moderate level of valuation confidence.
- ROE Score: 3, showing Moderate efficiency in generating profit from equity.
- ROA Score: 4, reflecting a Favorable asset utilization to generate earnings.
- Debt To Equity Score: 4, considered Favorable with lower financial risk.
- Overall Score: 3, indicating a Moderate overall financial standing.
Which one is the best rated?
Both companies share the same overall rating of B+ and a Moderate overall score. NVIDIA leads with higher ROE and ROA scores, while Tower Semiconductor has a more favorable debt-to-equity score, reflecting different strengths in financial metrics.
Scores Comparison
The comparison of NVIDIA and Tower Semiconductor scores highlights their financial stability and strength:
NVIDIA Scores
- Altman Z-Score: 68.04, indicating a safe zone well above distress levels.
- Piotroski Score: 6, categorized as average financial strength.
Tower Semiconductor Scores
- Altman Z-Score: 20.26, also in the safe zone, showing strong financial health.
- Piotroski Score: 7, reflecting strong financial strength.
Which company has the best scores?
Based on the provided data, Tower Semiconductor has a higher Piotroski Score (7 vs. 6), indicating stronger financial strength, while both companies have Altman Z-Scores in the safe zone, with NVIDIA showing a much higher value.
Grades Comparison
Here is a detailed comparison of the latest grades assigned to NVIDIA Corporation and Tower Semiconductor Ltd.:
NVIDIA Corporation Grades
The table below summarizes recent grades from reputable grading companies for NVIDIA Corporation:
| Grading Company | Action | New Grade | Date |
|---|---|---|---|
| Mizuho | Maintain | Outperform | 2026-01-09 |
| Truist Securities | Maintain | Buy | 2025-12-29 |
| Stifel | Maintain | Buy | 2025-12-29 |
| B of A Securities | Maintain | Buy | 2025-12-26 |
| Baird | Maintain | Outperform | 2025-12-26 |
| Bernstein | Maintain | Outperform | 2025-12-26 |
| Truist Securities | Maintain | Buy | 2025-12-19 |
| Tigress Financial | Maintain | Strong Buy | 2025-12-18 |
| Morgan Stanley | Maintain | Overweight | 2025-12-01 |
| Deutsche Bank | Maintain | Hold | 2025-11-20 |
NVIDIA’s grades predominantly range from Buy to Outperform, with one Strong Buy and a single Hold, indicating a broadly positive consensus.
Tower Semiconductor Ltd. Grades
Recent grades from reliable grading companies for Tower Semiconductor Ltd. are as follows:
| Grading Company | Action | New Grade | Date |
|---|---|---|---|
| Benchmark | Maintain | Buy | 2026-01-09 |
| Wedbush | Downgrade | Neutral | 2025-12-31 |
| Benchmark | Maintain | Buy | 2025-11-11 |
| Susquehanna | Maintain | Positive | 2025-11-11 |
| Wedbush | Maintain | Outperform | 2025-11-11 |
| Barclays | Maintain | Equal Weight | 2025-11-11 |
| Benchmark | Maintain | Buy | 2025-09-08 |
| Susquehanna | Maintain | Positive | 2025-08-05 |
| Benchmark | Maintain | Buy | 2025-08-05 |
| Benchmark | Maintain | Buy | 2025-08-04 |
Tower Semiconductor’s grades show variation from Buy to Neutral and Equal Weight, with a downgrade noted recently, signaling a more cautious outlook.
Which company has the best grades?
NVIDIA Corporation holds generally stronger and more consistent grades, including multiple Outperform and Strong Buy ratings, compared to Tower Semiconductor’s mixed Buy and Neutral ratings. This suggests a more favorable analyst sentiment for NVIDIA, which may influence investor confidence and portfolio positioning.
Strengths and Weaknesses
Below is a comparative overview of key strengths and weaknesses for NVIDIA Corporation (NVDA) and Tower Semiconductor Ltd. (TSEM) based on the most recent data.
| Criterion | NVIDIA Corporation (NVDA) | Tower Semiconductor Ltd. (TSEM) |
|---|---|---|
| Diversification | Highly diversified across data center, gaming, automotive, and professional visualization segments with Data Center leading at $115B in 2025. | Less diversified; mainly focused on semiconductor manufacturing without detailed segment revenue publicly available. |
| Profitability | Very high profitability: net margin 55.85%, ROIC 75.28%, ROE 91.87%. | Moderate profitability: net margin 14.47%, ROIC 6.41% (neutral), ROE 7.83% (unfavorable). |
| Innovation | Strong innovation with durable competitive advantage and rapidly growing ROIC (+339%). | Improving profitability with growing ROIC (+44%), but currently destroying value overall. |
| Global presence | Extensive global reach with dominant market share in GPUs and data center chips. | Smaller global footprint; niche player in semiconductor foundry. |
| Market Share | Leading market share in GPUs and AI accelerators, driving massive revenue growth. | Smaller market share in foundry services, facing tough competition. |
Key takeaways: NVIDIA demonstrates a robust competitive moat with strong profitability, diversification, and innovation driving rapid growth. Tower Semiconductor shows improving trends but remains less profitable and less diversified, representing a higher risk profile for investors.
Risk Analysis
Below is a table summarizing the key risks for NVIDIA Corporation (NVDA) and Tower Semiconductor Ltd. (TSEM) based on the latest available data from 2025 and 2024.
| Metric | NVIDIA Corporation (NVDA) | Tower Semiconductor Ltd. (TSEM) |
|---|---|---|
| Market Risk | High beta of 2.314 indicates high volatility and sensitivity to market swings. | Moderate beta of 0.876 suggests lower volatility compared to the market. |
| Debt level | Low debt-to-equity ratio at 0.13, low debt-to-assets 9.2%, strong interest coverage (341x). | Very low debt-to-equity ratio at 0.07, debt-to-assets 5.87%, solid interest coverage (31.57x). |
| Regulatory Risk | Moderate; operates globally including China and Taiwan, sensitive to trade policies and export controls. | Moderate; headquartered in Israel, exposed to regional regulatory shifts and export limitations. |
| Operational Risk | Large global operations with 36K employees; dependency on semiconductor supply chains and technology innovation. | Smaller scale with 5.6K employees; niche in analog/mixed-signal foundry services but exposed to supply chain disruptions. |
| Environmental Risk | Moderate; chip manufacturing is resource-intensive with increasing pressure for sustainable practices. | Moderate; similar environmental challenges in semiconductor fabrication, with increasing regulatory scrutiny. |
| Geopolitical Risk | High; significant exposure to US-China tensions, Taiwan’s geopolitical situation poses risks. | Moderate to high; based in Israel, regionally sensitive to geopolitical conflicts and global trade shifts. |
In summary, the most impactful risks are NVIDIA’s market volatility and geopolitical exposure due to its global footprint and high beta, while Tower Semiconductor faces operational and geopolitical risks linked to its regional base and supply chain dependencies. Both companies maintain low debt, supporting financial stability under current conditions.
Which Stock to Choose?
NVIDIA Corporation (NVDA) displays a strong income evolution with 114.2% revenue growth in one year and favorable profitability metrics, including a 55.85% net margin and 91.87% ROE. Its debt levels are low, supported by a favorable debt-to-equity ratio of 0.13, and its overall rating is very favorable with a B+ score.
Tower Semiconductor Ltd. (TSEM) shows moderate income growth overall but recent declines in revenue and net margin. Profitability is less robust with a 14.47% net margin and 7.83% ROE. The company maintains low debt and a slightly favorable rating of B+, though financial ratios are only slightly favorable overall.
For investors prioritizing high profitability and a durable competitive advantage, NVDA’s very favorable rating and strong income statement might appear more attractive. Conversely, those seeking a smaller company with improving profitability and accelerating stock price trends may find TSEM’s profile more suitable, despite its lower profitability and slightly less favorable rating.
Disclaimer: Investment carries a risk of loss of initial capital. The past performance is not a reliable indicator of future results. Be sure to understand risks before making an investment decision.
Go Further
I encourage you to read the complete analyses of NVIDIA Corporation and Tower Semiconductor Ltd. to enhance your investment decisions: