Home > Comparison > Technology > NVDA vs TXN
The strategic rivalry between NVIDIA Corporation and Texas Instruments Incorporated shapes the semiconductor industry’s future. NVIDIA dominates as a high-growth leader in graphics and AI computing platforms. Texas Instruments operates a capital-intensive model focused on analog and embedded processing chips. This analysis pits growth-driven innovation against steady value generation to identify which trajectory offers superior risk-adjusted returns for diversified portfolios.
Table of contents
Companies Overview
NVIDIA and Texas Instruments anchor the semiconductor sector with distinct market roles and expansive product portfolios.
NVIDIA Corporation: Leader in Visual Computing and AI
NVIDIA dominates as a graphics and AI computing powerhouse. Its core revenue comes from GPUs used in gaming, professional visualization, and data centers. In 2026, NVIDIA emphasizes accelerated computing and AI platforms, expanding its reach in cloud, autonomous vehicles, and virtual worlds with Omniverse software.
Texas Instruments Incorporated: Analog and Embedded Semiconductors Specialist
Texas Instruments excels in analog and embedded semiconductor solutions. It generates revenue through power management, signal processing, and microcontrollers for diverse industrial and automotive applications. The company’s 2026 strategy focuses on enhancing embedded processing and expanding analog product offerings to meet evolving electronics demands worldwide.
Strategic Collision: Innovation vs. Reliability
NVIDIA pursues cutting-edge AI and accelerated computing, leveraging a software-hardware integrated ecosystem. Texas Instruments relies on broad analog and embedded expertise, emphasizing stable, high-volume industrial markets. Both battle for semiconductor dominance, yet NVIDIA targets high-growth innovation sectors while Texas Instruments offers consistent, diversified semiconductor solutions. Their investment profiles reflect a clash between dynamic growth and steady resilience.
Income Statement Comparison
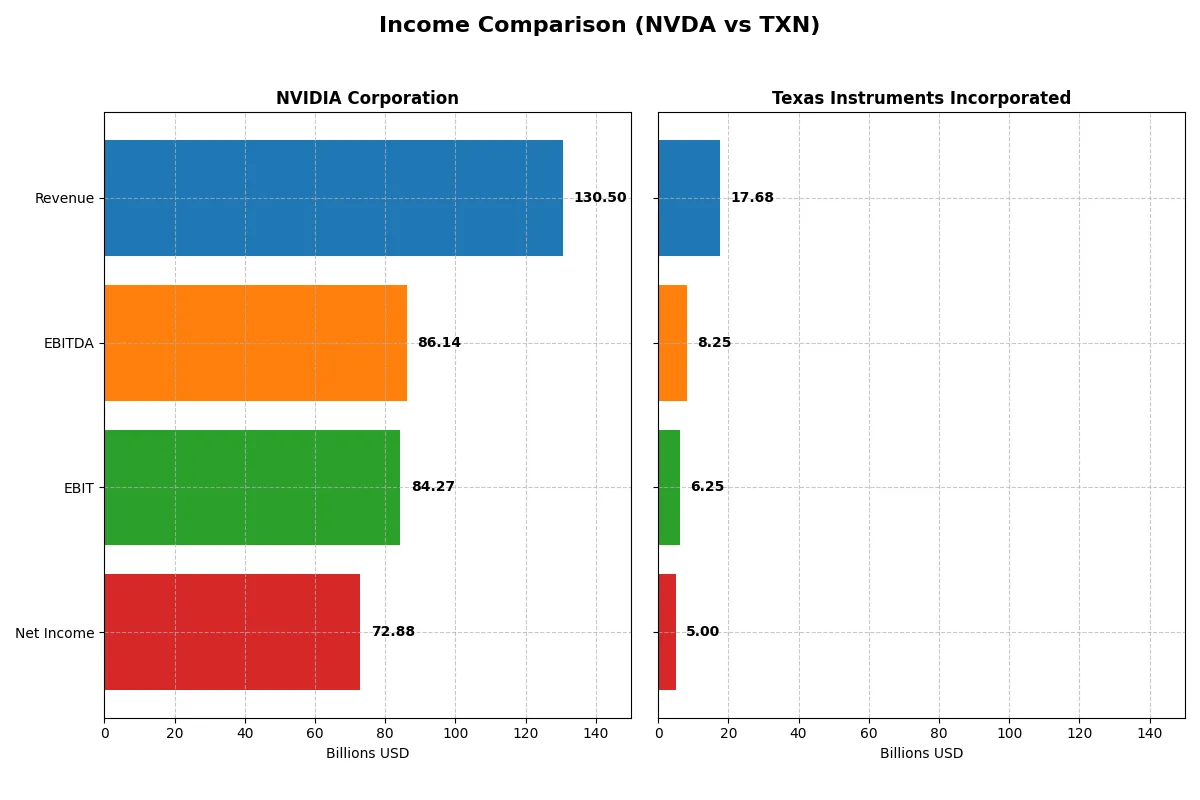
This data dissects the core profitability and scalability of both corporate engines to reveal who dominates the bottom line:
| Metric | NVIDIA Corporation (NVDA) | Texas Instruments Incorporated (TXN) |
|---|---|---|
| Revenue | 130.5B | 17.7B |
| Cost of Revenue | 32.6B | 7.6B |
| Operating Expenses | 16.4B | 4.1B |
| Gross Profit | 97.9B | 10.1B |
| EBITDA | 86.1B | 8.3B |
| EBIT | 84.3B | 6.3B |
| Interest Expense | 247M | 543M |
| Net Income | 72.9B | 5.0B |
| EPS | 2.97 | 5.45 |
| Fiscal Year | 2025 | 2025 |
Income Statement Analysis: The Bottom-Line Duel
This income statement comparison reveals which firm operates with the most efficient and profitable business model in the current market climate.
NVIDIA Corporation Analysis
NVIDIA’s revenue exploded from $27B in 2023 to $130.5B in 2025, showcasing extraordinary growth. Net income surged to $72.9B, lifting net margins to a robust 55.85%. Gross and EBIT margins remain stellar at 74.99% and 64.58%, respectively, reflecting elite operational efficiency and strong momentum through aggressive innovation and scale.
Texas Instruments Incorporated Analysis
Texas Instruments posted steady revenue growth from $18.3B in 2021 to $17.7B in 2025, with net income near $5B. Margins are healthy but more modest: gross margin at 57.02% and EBIT margin at 35.36%. However, net margin declined slightly to 28.28%, suggesting margin pressures and slower profit momentum despite consistent operational control.
Verdict: High-Growth Dominance vs. Stable Margins
NVIDIA clearly outperforms Texas Instruments in top-line expansion and margin amplification, delivering over 1,500% net income growth versus TXN’s 35% decline over five years. NVIDIA’s superior profitability and accelerating EPS growth mark it as the fundamentally stronger engine. Investors favoring rapid growth and margin leadership find NVIDIA’s profile more compelling.
Financial Ratios Comparison
These vital ratios act as a diagnostic tool to expose the underlying fiscal health, valuation premiums, and capital efficiency of the companies compared below:
| Ratios | NVIDIA Corporation (NVDA) | Texas Instruments Incorporated (TXN) |
|---|---|---|
| ROE | 91.87% | 30.73% |
| ROIC | 75.28% | 16.52% |
| P/E | 39.90 | 31.53 |
| P/B | 36.66 | 9.69 |
| Current Ratio | 4.44 | 4.35 |
| Quick Ratio | 3.88 | 2.83 |
| D/E (Debt-to-Equity) | 0.13 | 0.86 |
| Debt-to-Assets | 9.20% | 40.62% |
| Interest Coverage | 329.77 | 11.09 |
| Asset Turnover | 1.17 | 0.51 |
| Fixed Asset Turnover | 16.16 | 1.44 |
| Payout ratio | 1.14% | 99.96% |
| Dividend yield | 0.03% | 3.17% |
| Fiscal Year | 2025 | 2025 |
Efficiency & Valuation Duel: The Vital Signs
Ratios act as a company’s DNA, revealing hidden risks and operational excellence that guide investors in assessing true financial health.
NVIDIA Corporation
NVIDIA posts a stellar ROE of 91.87% and a net margin of 55.85%, signaling exceptional profitability and operational dominance. However, the stock trades at a stretched P/E of 39.9 and an elevated P/B of 36.66, reflecting a premium valuation. Dividends barely yield 0.03%, indicating reinvestment focused on R&D and growth.
Texas Instruments Incorporated
Texas Instruments shows solid profitability with a 30.73% ROE and a 28.28% net margin, illustrating steady earnings power. The P/E of 31.53 and P/B of 9.69 suggest a relatively expensive stock but less stretched than NVIDIA. A healthy 3.17% dividend yield rewards shareholders, reflecting a balanced capital allocation strategy.
Premium Valuation vs. Dividend Strength
NVIDIA’s metrics highlight superior profitability but at a premium valuation, while Texas Instruments offers moderate returns with solid dividends. For those prioritizing growth and operational efficiency, NVIDIA fits better; income-focused investors may prefer Texas Instruments’ reliable payouts.
Which one offers the Superior Shareholder Reward?
I compare NVIDIA and Texas Instruments on dividends, payout ratios, and buybacks. TXN yields 3.17%, almost 110x NVDA’s 0.03%. TXN pays nearly 100% of net income as dividends, raising sustainability concerns. NVDA’s payout ratio is under 2%, preserving cash for growth and share buybacks. NVDA delivers intense buybacks, boosting total returns, while TXN’s buybacks are modest. I see NVDA’s reinvestment in innovation as superior for long-term value despite low yield. TXN offers steady income but risks payout pressure. In 2026, I favor NVDA’s balanced, growth-oriented distribution for superior total shareholder reward.
Comparative Score Analysis: The Strategic Profile
The radar chart reveals the fundamental DNA and trade-offs of NVIDIA Corporation and Texas Instruments Incorporated:
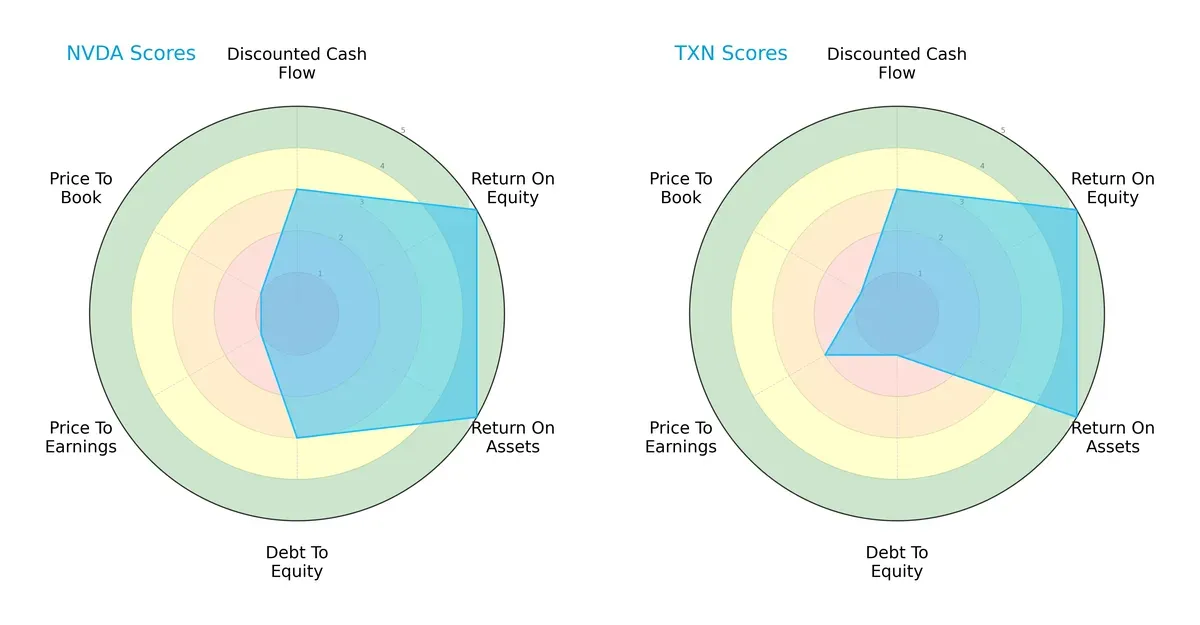
Both firms deliver very favorable returns on equity and assets, highlighting operational excellence. NVIDIA maintains a moderate debt profile, whereas Texas Instruments carries a higher debt burden. NVIDIA’s valuation scores (PE/PB) lag significantly, suggesting overvaluation risk, while Texas Instruments shows a more moderate price-to-earnings score but similarly low price-to-book. Overall, NVIDIA exhibits a balanced strength in profitability and leverage, relying on its growth premium, while Texas Instruments leans more heavily on financial conservatism and stable valuation.
Bankruptcy Risk: Solvency Showdown
The Altman Z-Scores position both companies comfortably in the safe zone, signaling robust solvency to withstand economic cycles:
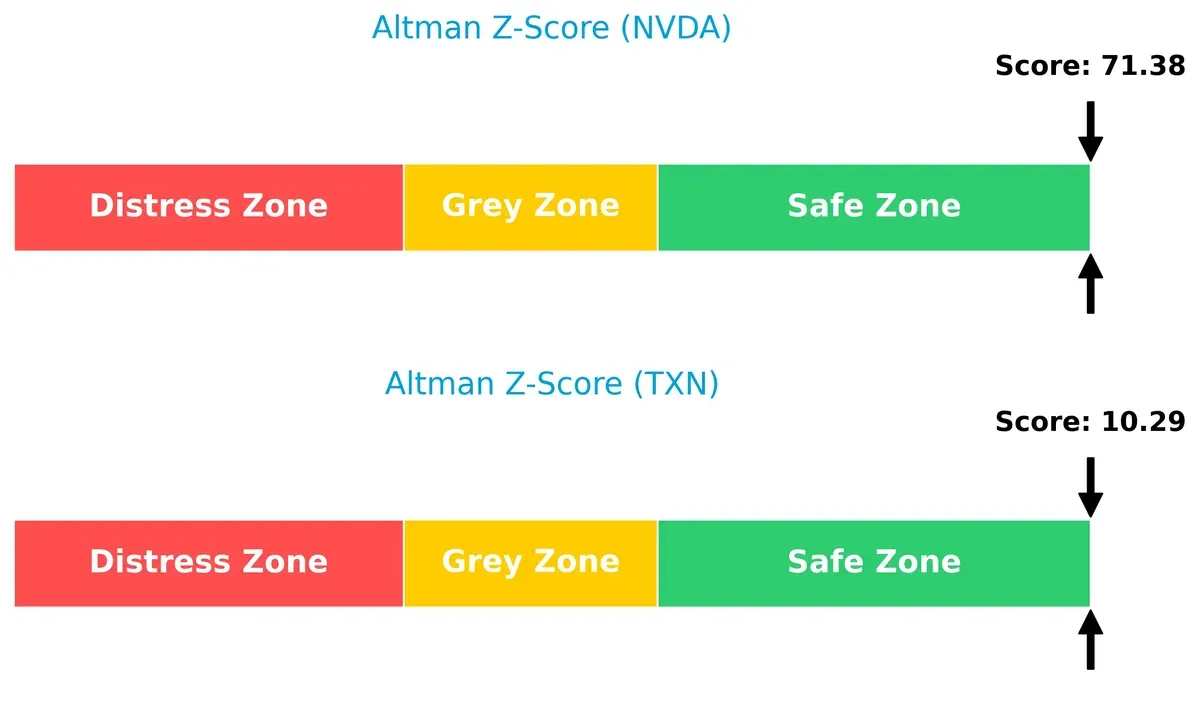
NVIDIA’s exceptionally high score (~71.4) far exceeds Texas Instruments’ strong 10.3, indicating NVIDIA’s exceptional buffer against distress despite its growth investments. Texas Instruments remains solid but with less margin for error in downturns.
Financial Health: Quality of Operations
Texas Instruments edges NVIDIA in Piotroski F-Score, reflecting slightly stronger internal financial metrics and operational quality:
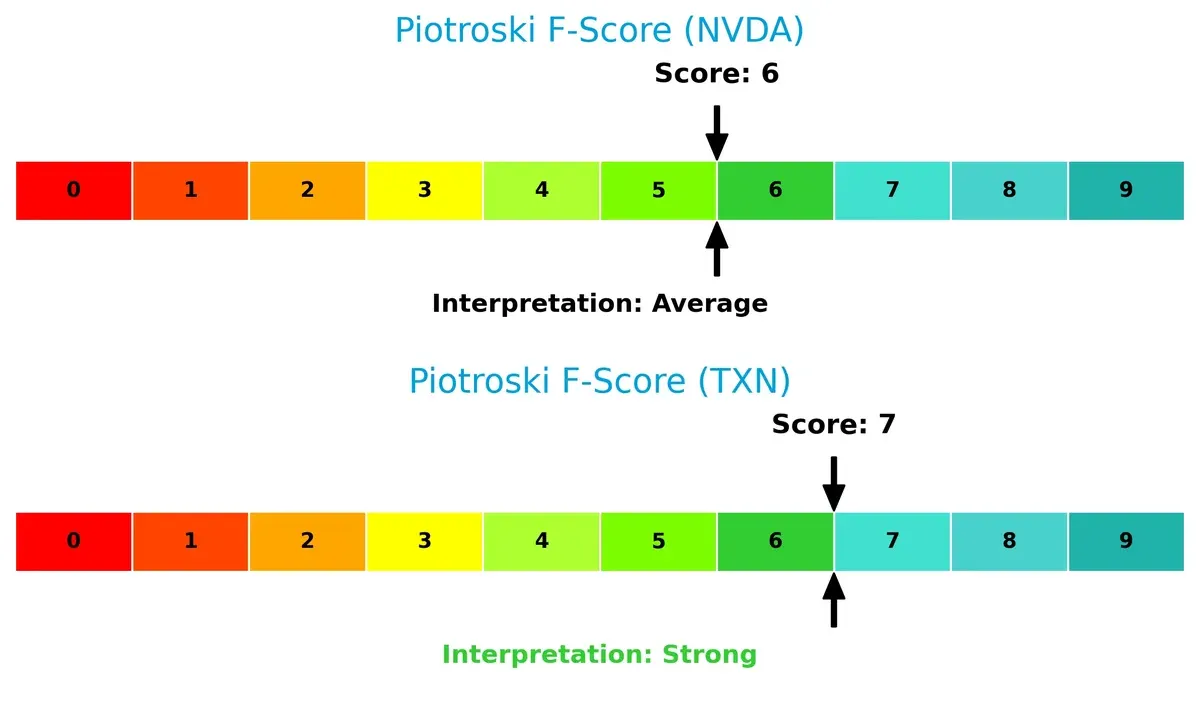
With a score of 7 (strong) versus NVIDIA’s 6 (average), Texas Instruments demonstrates superior fundamentals in profitability, leverage, and efficiency. This suggests NVIDIA may face moderate red flags in internal controls or cash flow stability compared to its peer. Investors should weigh NVIDIA’s growth potential against these operational nuances.
How are the two companies positioned?
This section dissects NVDA and TXN’s operational DNA by comparing revenue distribution and internal dynamics. The goal is to confront their economic moats and pinpoint the most resilient competitive advantage today.
Revenue Segmentation: The Strategic Mix
This visual comparison dissects how NVIDIA Corporation and Texas Instruments Incorporated diversify their income streams and reveals where their primary sector bets lie:
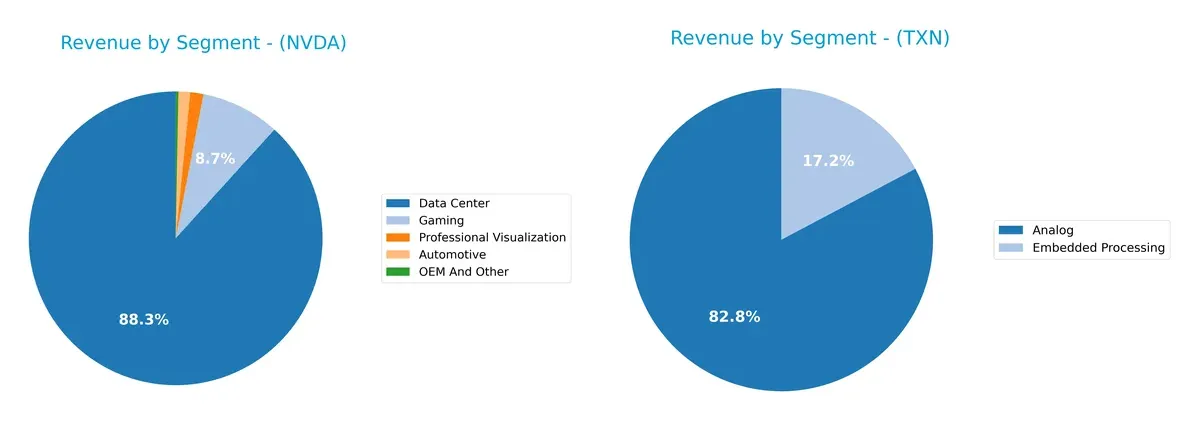
NVIDIA’s revenue pivots heavily on Data Center at $115B, dwarfing its other segments like Gaming at $11.4B. This concentration signals dominance in AI infrastructure but heightens dependence risk. Texas Instruments presents a more balanced spread, with Analog at $12.2B and Embedded Processing at $2.5B, reducing exposure to a single market. TI’s diversification anchors stability, while NVIDIA’s focus fuels rapid growth yet demands vigilance on sector shifts.
Strengths and Weaknesses Comparison
This table compares the strengths and weaknesses of NVIDIA Corporation and Texas Instruments Incorporated:
NVIDIA Corporation Strengths
- High profitability with 55.85% net margin
- Exceptional ROE at 91.87%
- Superior ROIC at 75.28%
- Strong asset and fixed asset turnover
- Low debt-to-assets at 9.2%
- Diverse product segments led by Data Center
Texas Instruments Incorporated Strengths
- Solid profitability with 28.28% net margin
- Good ROE at 30.73%
- Favorable interest coverage
- Attractive dividend yield at 3.17%
- Balanced debt profile with 40.62% debt-to-assets
- Diversified revenue with strong Analog segment
NVIDIA Corporation Weaknesses
- High PE and PB ratios indicating premium valuation
- Elevated weighted average cost of capital (14.73%)
- Unfavorable current ratio despite strong quick ratio
- Minimal dividend yield at 0.03%
- Concentrated geographic revenue in the US
Texas Instruments Incorporated Weaknesses
- Moderate PE and PB ratios still unfavorable
- Neutral debt-to-equity and asset turnover metrics
- Current ratio also unfavorable
- Lower innovation scale compared to NVIDIA
- Geographic revenue more spread but less dominant in key markets
NVIDIA demonstrates dominant profitability and operational efficiency, powered by its Data Center focus. Texas Instruments offers stable returns with a stronger dividend and balanced leverage but lacks NVIDIA’s scale in innovation and margin expansion. Both companies face valuation and liquidity challenges that may influence capital allocation strategies.
The Moat Duel: Analyzing Competitive Defensibility
A structural moat alone shields long-term profits from relentless competitive erosion. Let’s dissect how NVIDIA and Texas Instruments stand guard:
NVIDIA Corporation: Innovation-Driven Network Effects
NVIDIA’s moat stems from powerful network effects in AI and gaming GPUs, delivering sky-high ROIC above WACC by 60%. Its 2026 outlook includes expanding AI platforms, deepening dominance.
Texas Instruments Incorporated: Cost Leadership in Analog Semiconductors
Texas Instruments relies on cost advantage and scale in analog chips, maintaining positive ROIC but with a declining trend. Its moat is narrower, facing pressure to innovate beyond traditional markets.
Verdict: Network Effects vs. Cost Leadership
NVIDIA’s rapidly growing ROIC and expanding AI ecosystem create a wider, deeper moat than Texas Instruments’ cost-focused model. NVIDIA is better positioned to defend and grow market share.
Which stock offers better returns?
The past year saw NVIDIA’s stock more than double, though momentum slowed recently. Texas Instruments showed steady gains with accelerating upward movement.
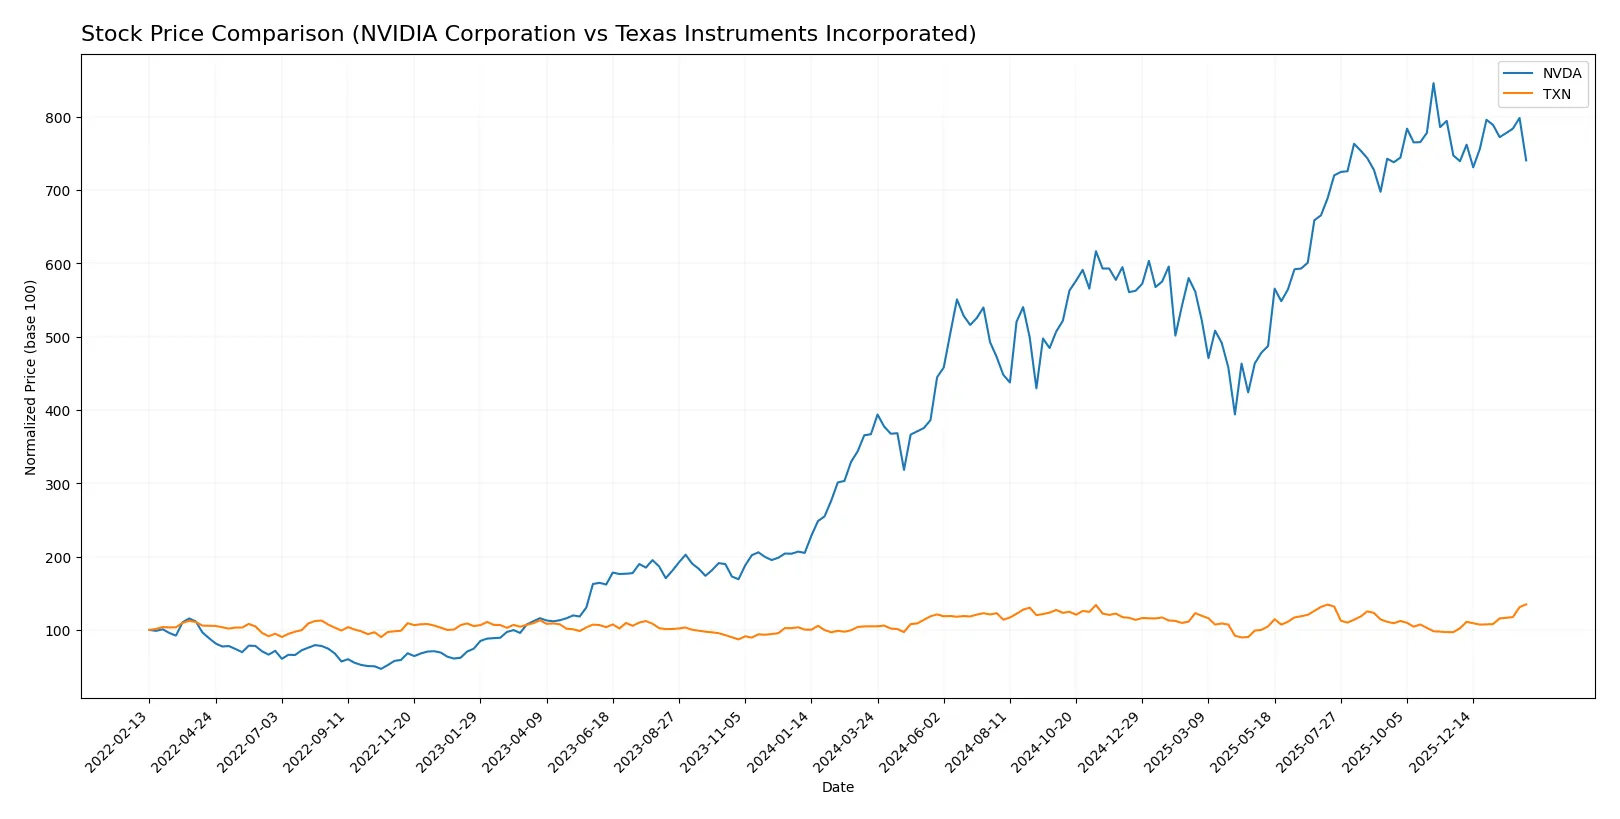
Trend Comparison
NVIDIA’s 12-month trend shows a 101.83% price increase, marking a strong bullish trend but with decelerating momentum. Volatility is high, with a 32.09 standard deviation and a peak at 202.49.
Texas Instruments gained 28.52% over the same period, maintaining a bullish trend with acceleration. Its volatility is moderate at 16.2 standard deviation, reaching a high of 221.72.
Comparing both, NVIDIA delivered the highest market performance with a significantly larger price increase, despite recent deceleration. Texas Instruments’ trend is steadier but less pronounced.
Target Prices
Analysts present a broad but constructive target price consensus for these semiconductor leaders.
| Company | Target Low | Target High | Consensus |
|---|---|---|---|
| NVIDIA Corporation | 140 | 352 | 265.21 |
| Texas Instruments Incorporated | 160 | 260 | 204.64 |
The consensus target for NVIDIA at 265.21 suggests upside from the current 176.36, reflecting strong growth expectations. Texas Instruments’ 204.64 target is modestly below its 221.14 price, indicating potential near-term valuation pressure.

Don’t Let Luck Decide Your Entry Point
Optimize your entry points with our advanced ProRealTime indicators. You’ll get efficient buy signals with precise price targets for maximum performance. Start outperforming now!
How do institutions grade them?
The following tables summarize recent institutional grades for NVIDIA Corporation and Texas Instruments Incorporated:
NVIDIA Corporation Grades
This table shows the latest grades from reputable financial institutions for NVIDIA Corporation.
| Grading Company | Action | New Grade | Date |
|---|---|---|---|
| Jefferies | Maintain | Buy | 2026-01-16 |
| Mizuho | Maintain | Outperform | 2026-01-09 |
| Truist Securities | Maintain | Buy | 2025-12-29 |
| Stifel | Maintain | Buy | 2025-12-29 |
| Baird | Maintain | Outperform | 2025-12-26 |
| Bernstein | Maintain | Outperform | 2025-12-26 |
| B of A Securities | Maintain | Buy | 2025-12-26 |
| Truist Securities | Maintain | Buy | 2025-12-19 |
| Tigress Financial | Maintain | Strong Buy | 2025-12-18 |
| Morgan Stanley | Maintain | Overweight | 2025-12-01 |
Texas Instruments Incorporated Grades
This table presents recent grades from established grading firms for Texas Instruments Incorporated.
| Grading Company | Action | New Grade | Date |
|---|---|---|---|
| Jefferies | Maintain | Hold | 2026-01-28 |
| Cantor Fitzgerald | Maintain | Neutral | 2026-01-28 |
| Goldman Sachs | Maintain | Sell | 2026-01-28 |
| Truist Securities | Maintain | Hold | 2026-01-28 |
| Deutsche Bank | Maintain | Hold | 2026-01-28 |
| Stifel | Maintain | Hold | 2026-01-28 |
| UBS | Maintain | Buy | 2026-01-28 |
| B of A Securities | Upgrade | Neutral | 2026-01-28 |
| Wells Fargo | Maintain | Equal Weight | 2026-01-28 |
| JP Morgan | Maintain | Overweight | 2026-01-28 |
Which company has the best grades?
NVIDIA consistently receives Buy or Outperform ratings, often with strong Buy endorsements. Texas Instruments shows a wider grade spread, including Hold and Sell ratings. This divergence suggests NVIDIA enjoys stronger institutional confidence, potentially influencing investor sentiment and portfolio allocations.
Risks specific to each company
The following categories identify the critical pressure points and systemic threats facing both firms in the 2026 market environment:
1. Market & Competition
NVIDIA Corporation
- Dominates AI and gaming GPU markets but faces intense rivalry from AMD and Intel.
Texas Instruments Incorporated
- Strong position in analog and embedded processing but exposed to commoditization pressures.
2. Capital Structure & Debt
NVIDIA Corporation
- Maintains low debt levels (D/E 0.13) with excellent interest coverage, reducing financial risk.
Texas Instruments Incorporated
- Higher leverage (D/E 0.86) raises financial risk despite manageable interest coverage.
3. Stock Volatility
NVIDIA Corporation
- High beta (2.31) signals significant price swings, increasing investor risk.
Texas Instruments Incorporated
- Near-market beta (0.99) suggests stable stock price relative to broader indices.
4. Regulatory & Legal
NVIDIA Corporation
- Exposure to complex export controls on AI chips and geopolitical tech restrictions.
Texas Instruments Incorporated
- Faces regulatory scrutiny primarily in industrial and automotive semiconductor standards.
5. Supply Chain & Operations
NVIDIA Corporation
- Relies on Taiwanese foundries, vulnerable to geopolitical tensions and capacity constraints.
Texas Instruments Incorporated
- More diversified manufacturing footprint, mitigating supply chain disruption risks.
6. ESG & Climate Transition
NVIDIA Corporation
- Faces pressure to reduce carbon footprint in energy-intensive data centers and AI workloads.
Texas Instruments Incorporated
- Strong ESG programs in power-efficient analog products appeal to sustainability-focused customers.
7. Geopolitical Exposure
NVIDIA Corporation
- High exposure to China and Taiwan risks due to market and supply chain concentration.
Texas Instruments Incorporated
- Diversified global operations lessen direct geopolitical vulnerabilities.
Which company shows a better risk-adjusted profile?
NVIDIA’s greatest risk lies in stock volatility amplified by geopolitical exposure and export controls. Texas Instruments faces capital structure risks from higher leverage. Overall, Texas Instruments offers a steadier risk-adjusted profile, supported by its stable beta and diversified operations. However, NVIDIA’s robust profitability and low debt partially offset its heightened market risks. The recent surge in export restrictions on AI technology underscores NVIDIA’s vulnerability.
Final Verdict: Which stock to choose?
NVIDIA’s superpower lies in its exceptional ability to generate outsized returns on invested capital, signaling a robust and growing economic moat. Its rapid innovation and market leadership in AI chips power strong revenue growth. A point of vigilance remains its elevated valuation multiples, which could pressure returns if growth slows. It suits aggressive growth portfolios aiming for transformative tech exposure.
Texas Instruments stands out with its durable moat rooted in steady cash flow and diversified analog semiconductor products. It offers a more conservative risk profile than NVIDIA, with consistent profitability and a solid dividend yield. Declining ROIC trends warrant caution, but its resilience suits GARP investors seeking stable income combined with moderate growth.
If you prioritize high-growth opportunities and can tolerate valuation risk, NVIDIA outshines with its scalable competitive advantage and accelerating innovation. However, if you seek better stability and income in semiconductors, Texas Instruments offers a safer harbor with steady free cash flow and a proven dividend track record. Both companies create value but cater to distinct investor styles.
Disclaimer: Investment carries a risk of loss of initial capital. The past performance is not a reliable indicator of future results. Be sure to understand risks before making an investment decision.
Go Further
I encourage you to read the complete analyses of NVIDIA Corporation and Texas Instruments Incorporated to enhance your investment decisions: