Home > Comparison > Technology > NVDA vs TER
The strategic rivalry between NVIDIA Corporation and Teradyne, Inc. shapes the semiconductor industry’s evolution. NVIDIA leads as a high-margin innovator in graphics and AI computing, while Teradyne excels as a capital-intensive provider of automated test equipment and industrial robotics. This contrast highlights a battle between cutting-edge growth and specialized industrial value. This analysis will identify which corporate trajectory offers superior risk-adjusted returns for a diversified portfolio in 2026.

Table of contents
Companies Overview
NVIDIA and Teradyne both play pivotal roles in the semiconductor industry, shaping technology’s frontier.
NVIDIA Corporation: Leader in Visual Computing and AI Platforms
NVIDIA dominates with its graphics processing units (GPUs) powering gaming, professional visualization, and data centers. Its revenue engine blends hardware sales with software solutions like AI Enterprise and Omniverse. In 2026, NVIDIA focuses strategically on expanding AI computing and automotive platforms, leveraging its cutting-edge innovation to capture growth across diverse markets.
Teradyne, Inc.: Specialist in Automated Test Equipment
Teradyne specializes in automatic test equipment crucial for semiconductor and wireless device manufacturing. Its revenue stems from testing platforms used in wafer-level, system, and wireless tests, plus industrial automation robotics. The company’s 2026 strategy emphasizes enhancing robotic automation and wireless test solutions to meet rising demand in semiconductor quality and manufacturing efficiency.
Strategic Collision: Similarities & Divergences
NVIDIA pursues an integrated ecosystem centering on AI and graphics, while Teradyne focuses on enabling semiconductor quality through testing and automation. They collide in semiconductor innovation but from different angles—NVIDIA drives chip performance; Teradyne ensures chip reliability. Their investment profiles diverge: NVIDIA offers high growth with elevated volatility; Teradyne provides steady industrial demand with lower beta risk.
Income Statement Comparison
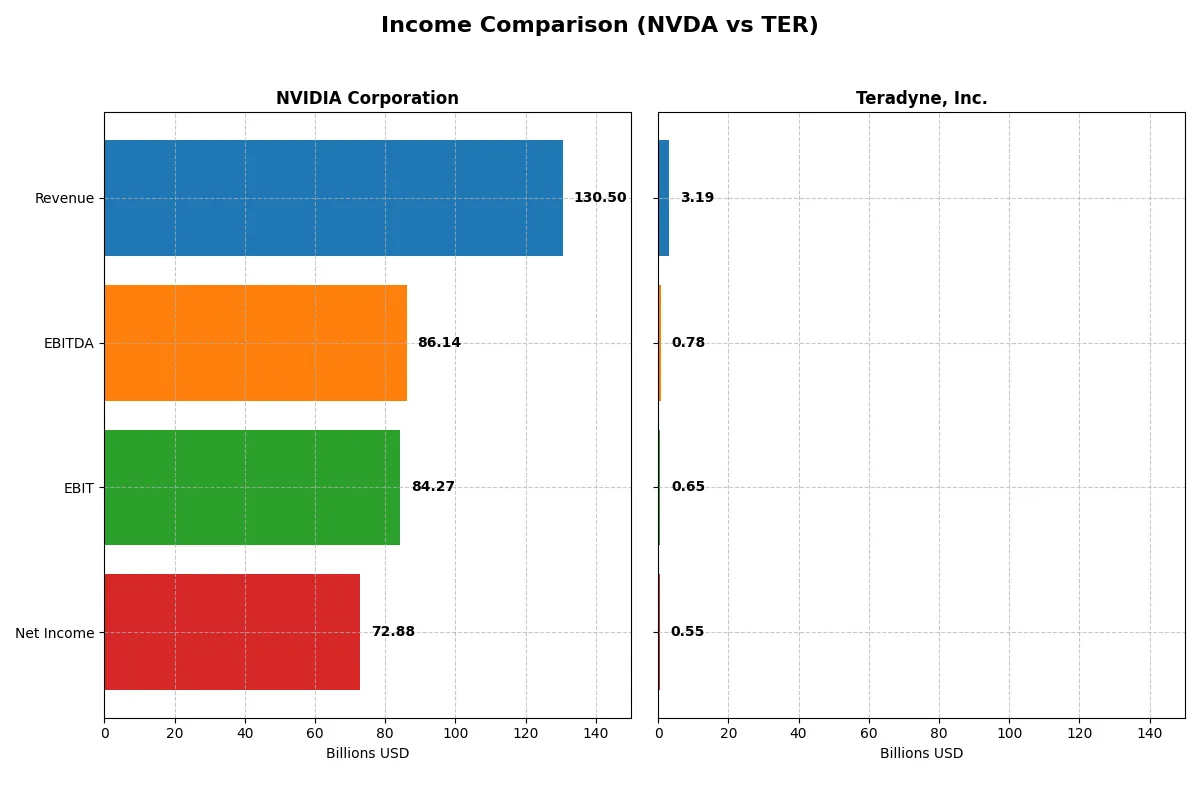
This data dissects the core profitability and scalability of both corporate engines to reveal who dominates the bottom line:
| Metric | NVIDIA Corporation (NVDA) | Teradyne, Inc. (TER) |
|---|---|---|
| Revenue | 130.5B | 3.19B |
| Cost of Revenue | 32.6B | 1.32B |
| Operating Expenses | 16.4B | 1.17B |
| Gross Profit | 97.9B | 1.87B |
| EBITDA | 86.1B | 780M |
| EBIT | 84.3B | 653M |
| Interest Expense | 247M | 8M |
| Net Income | 72.9B | 554M |
| EPS | 2.97 | 3.49 |
| Fiscal Year | 2025 | 2025 |
Income Statement Analysis: The Bottom-Line Duel
This income statement comparison reveals which company converts revenue into profit most efficiently and sustains healthy margins in a competitive landscape.
NVIDIA Corporation Analysis
NVIDIA’s revenue soared from $16.7B in 2021 to $130.5B in 2025, with net income exploding from $4.3B to $72.9B. Gross margin remains robust near 75%, and net margin impressively exceeds 55%, reflecting outstanding operational efficiency. The latest year shows accelerated growth and margin expansion, signaling strong momentum and disciplined cost control.
Teradyne, Inc. Analysis
Teradyne’s revenue modestly declined from $3.7B in 2021 to $3.2B in 2025, while net income fell from $1.0B to $554M. Gross margin holds a solid 58.5%, but net margin lags at 17.4%, indicating less profitability per dollar earned. The recent year shows slight revenue growth but a shrinking net margin, suggesting margin pressure despite operational improvements.
Margin Dominance vs. Revenue Expansion
NVIDIA clearly outpaces Teradyne in both scale and profitability, delivering superior margin health and explosive income growth. Teradyne’s steady revenue contrasts with shrinking profitability, highlighting challenges in capitalizing on sales. For investors seeking robust earnings power and rapid expansion, NVIDIA’s profile is more compelling.
Financial Ratios Comparison
These vital ratios act as a diagnostic tool to expose the underlying fiscal health, valuation premiums, and capital efficiency of each company:
| Ratios | NVIDIA Corporation (NVDA) | Teradyne, Inc. (TER) |
|---|---|---|
| ROE | 91.9% | 0% |
| ROIC | 75.3% | 0% |
| P/E | 39.9 | 54.6 |
| P/B | 36.7 | 0 |
| Current Ratio | 4.44 | 0 |
| Quick Ratio | 3.88 | 0 |
| D/E (Debt-to-Equity) | 0.13 | 0 |
| Debt-to-Assets | 9.2% | 0 |
| Interest Coverage | 330 | 86.4 |
| Asset Turnover | 1.17 | 0 |
| Fixed Asset Turnover | 16.16 | 0 |
| Payout Ratio | 1.14% | 13.8% |
| Dividend Yield | 0.029% | 0.252% |
| Fiscal Year | 2025 | 2025 |
Efficiency & Valuation Duel: The Vital Signs
Financial ratios serve as a company’s DNA, exposing operational strengths and hidden risks that shape investor confidence and valuation.
NVIDIA Corporation
NVIDIA dominates profitability with a stellar 91.87% ROE and a robust 55.85% net margin, signaling exceptional operational efficiency. Yet, its valuation looks stretched, with a high 39.9 P/E and 36.66 P/B ratios. Dividend yield is minimal at 0.03%, reflecting a focus on reinvesting heavily in R&D for sustained growth.
Teradyne, Inc.
Teradyne posts a modest 17.37% net margin but reports zero ROE and ROIC, reflecting underlying profitability challenges or data gaps. Its P/E of 54.64 suggests an expensive stock relative to earnings. A higher dividend yield of 0.25% contrasts with weak liquidity ratios, indicating a riskier operational profile despite shareholder payouts.
Premium Valuation vs. Operational Safety
NVIDIA offers superior profitability and operational efficiency but trades at a premium with stretched valuation metrics. Teradyne’s valuation appears more expensive relative to its earnings, compounded by weaker profitability signals. Investors seeking operational excellence may favor NVIDIA’s profile, while those prioritizing income might scrutinize Teradyne’s dividend despite fundamental weaknesses.
Which one offers the Superior Shareholder Reward?
I see NVIDIA yields a negligible 0.03% dividend with a 1.1% payout ratio, emphasizing buybacks and reinvestment in AI-driven growth. Teradyne offers a higher 0.25% yield and a 13.8% payout, supported by steady dividends and robust buybacks. NVIDIA’s reinvestment fuels superior long-term value, but Teradyne’s balanced cash return plus steady yield suits income-focused investors. For 2026, I favor NVIDIA’s aggressive capital allocation and buybacks, offering superior total return potential despite a lower yield.
Comparative Score Analysis: The Strategic Profile
The radar chart reveals the fundamental DNA and trade-offs of NVIDIA Corporation and Teradyne, Inc., highlighting their core financial strengths and vulnerabilities:
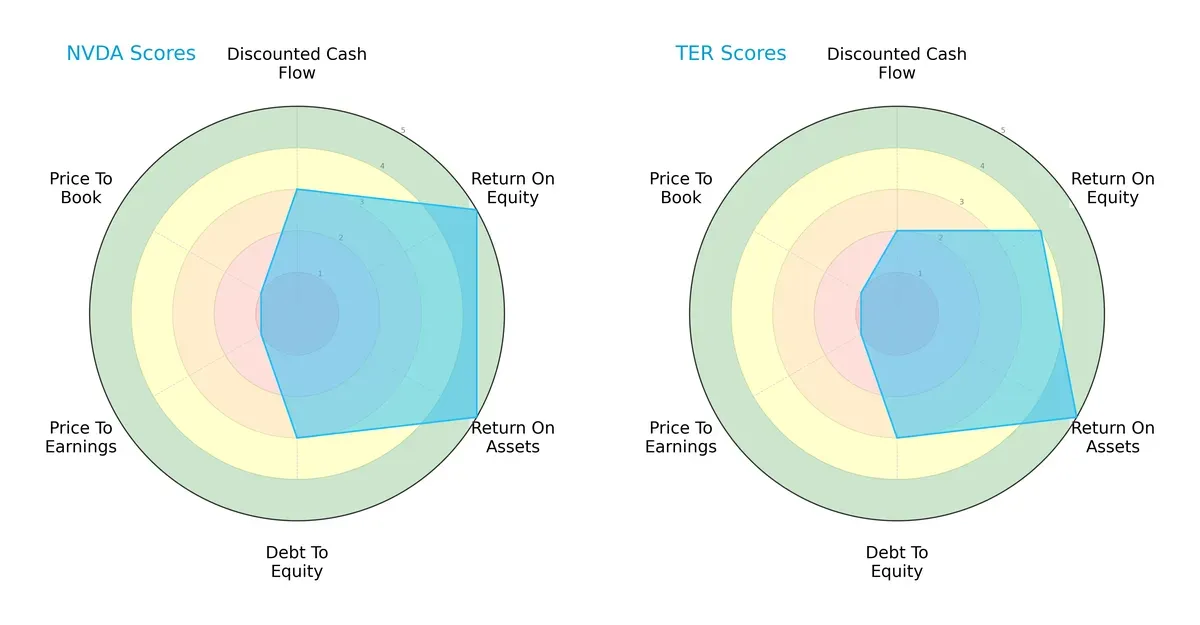
NVIDIA excels with top-tier ROE and ROA scores (5 each), showcasing superior profitability and asset efficiency. Teradyne matches NVIDIA on ROA but lags slightly on ROE (4). Both share moderate debt-to-equity profiles (score 3), indicating balanced leverage. NVIDIA’s discounted cash flow outlook is stronger (3 vs. 2), but both firms suffer from poor valuation metrics (P/E and P/B scores at 1), signaling potential overpricing. NVIDIA’s profile is more sharply focused on operational excellence, while Teradyne leans on a steadier, albeit less dynamic, cash flow base.
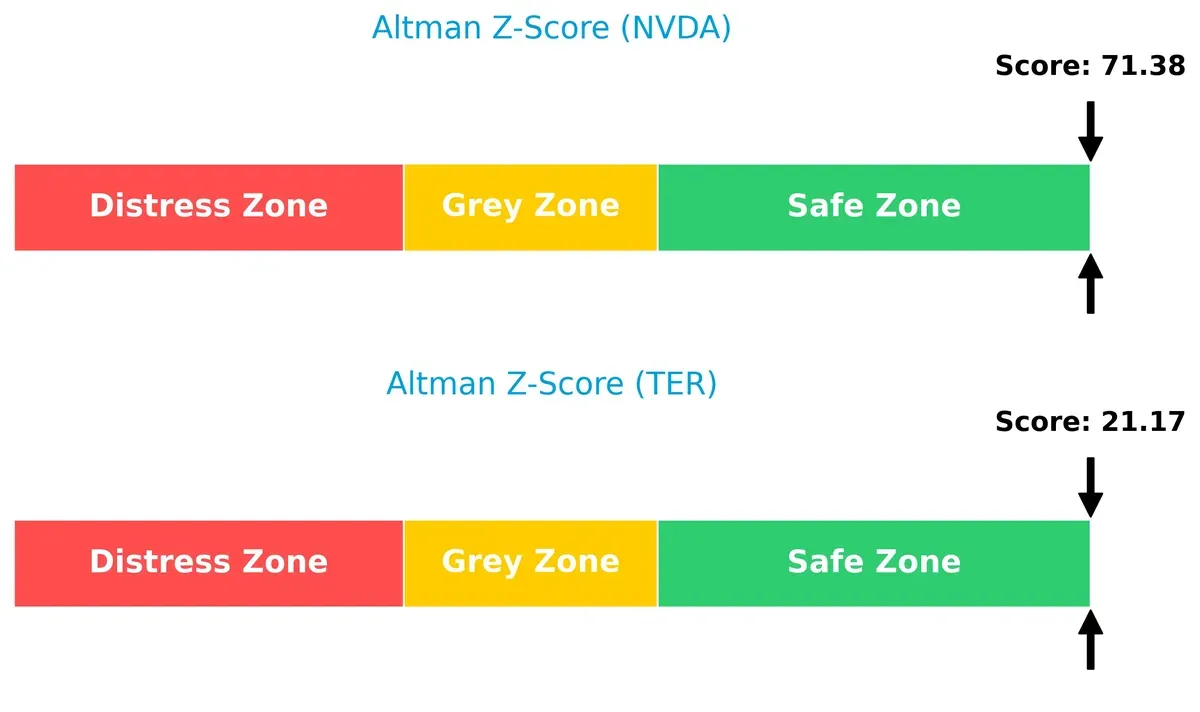
Bankruptcy Risk: Solvency Showdown
The Altman Z-Scores place both NVIDIA (71.4) and Teradyne (21.2) comfortably in the safe zone, signaling robust long-term solvency and minimal bankruptcy risk in this cycle:
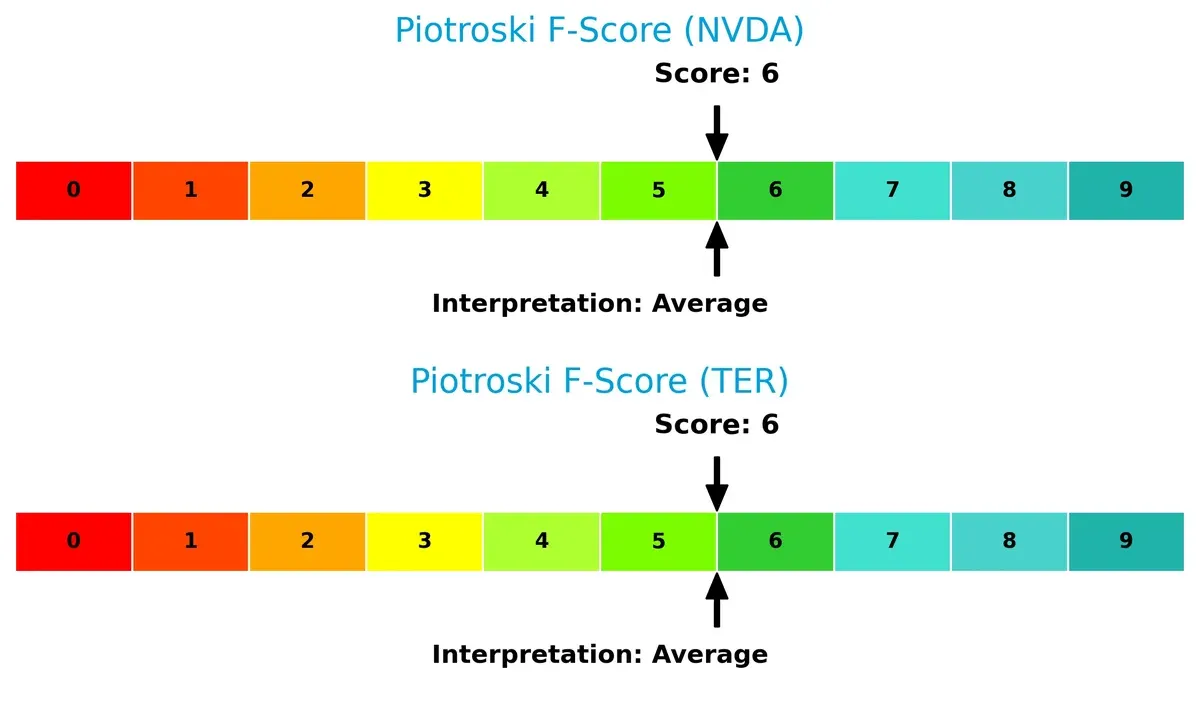
Financial Health: Quality of Operations
Both companies hold identical Piotroski F-Scores of 6, reflecting average financial health without glaring weaknesses or standout strengths in operational quality or balance sheet robustness:
How are the two companies positioned?
This section dissects the operational DNA of NVIDIA and Teradyne by comparing their revenue distribution and internal strengths and weaknesses. The goal is to confront their economic moats and identify which model offers the most resilient competitive advantage today.
Revenue Segmentation: The Strategic Mix
This comparison dissects how NVIDIA Corporation and Teradyne, Inc. diversify their income streams and reveals their primary sector bets:
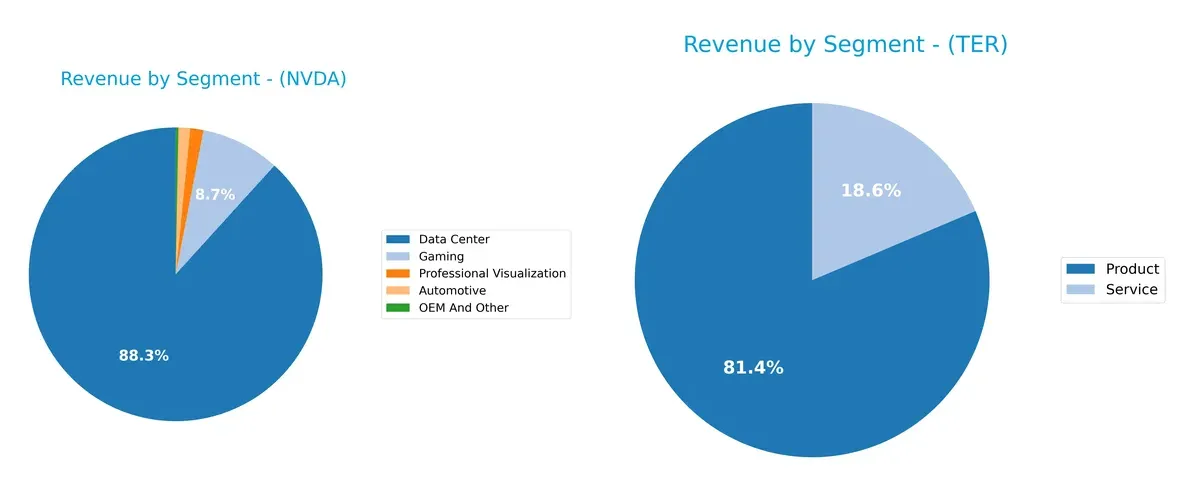
NVIDIA dwarfs Teradyne in scale, with its Data Center segment anchoring $115B in 2025. NVIDIA’s revenue mix remains concentrated, pivoting heavily on Data Center, while Gaming and Automotive add diversification. Teradyne’s split between $2.3B Products and $525M Services shows a more balanced but narrower scope. NVIDIA’s reliance on one dominant segment poses concentration risk, whereas Teradyne’s dual streams may offer steadier resilience amid market cycles.
Strengths and Weaknesses Comparison
This table compares the strengths and weaknesses of NVIDIA Corporation and Teradyne, Inc.:
NVIDIA Corporation Strengths
- High net margin of 55.85%
- Strong ROE at 91.87%
- Robust ROIC at 75.28%
- Low debt-to-assets ratio at 9.2%
- Significant global presence across key markets
- Diversified revenue streams with strong data center segment
Teradyne, Inc. Strengths
- Favorable net margin at 17.37%
- Low debt levels with favorable debt-to-assets
- Positive interest coverage at 81.43
- Product and service revenue diversification
- Presence in multiple geographic markets including Asia and the US
NVIDIA Corporation Weaknesses
- Unfavorable high WACC at 14.73%
- Elevated P/E of 39.9 and P/B of 36.66
- Current ratio of 4.44 flagged as unfavorable
- Very low dividend yield of 0.03%
- Dependence on key segments like data center
Teradyne, Inc. Weaknesses
- Zero ROE and ROIC indicating weak profitability
- Unavailable WACC data
- High P/E at 54.64 considered unfavorable
- Current and quick ratios at zero signal liquidity risks
- Asset turnover metrics unavailable or unfavorable
NVIDIA’s strengths lie in exceptional profitability and global diversification, though valuation and liquidity metrics raise caution. Teradyne shows moderate profitability and solid debt management but faces challenges in returns and liquidity, affecting overall financial health and operational efficiency.
The Moat Duel: Analyzing Competitive Defensibility
A structural moat is the only reliable defense preserving long-term profits from relentless competitive pressure. Let’s dissect the core moats of NVIDIA and Teradyne:
NVIDIA Corporation: Dominant Network Effects and Innovation Powerhouse
NVIDIA’s moat stems from powerful network effects and cutting-edge AI-driven innovation. This fuels a stellar ROIC 60% above WACC, underpinning margin stability and explosive revenue growth. Expansion into AI data centers and automotive AI deepens this moat in 2026.
Teradyne, Inc.: Specialized Automation and Testing Expertise
Teradyne leverages specialized automated test equipment and robotics expertise. Unlike NVIDIA’s broad ecosystem, Teradyne’s moat is narrower and shows weakening ROIC trends. Market disruption risks loom, but industrial automation offers modest growth potential.
Network Effects vs. Automation Specialization: The Moat Battle
NVIDIA’s wider, growing moat outmatches Teradyne’s niche and declining competitive advantage. I see NVIDIA far better positioned to defend and expand market share amid intensifying sector competition.
Which stock offers better returns?
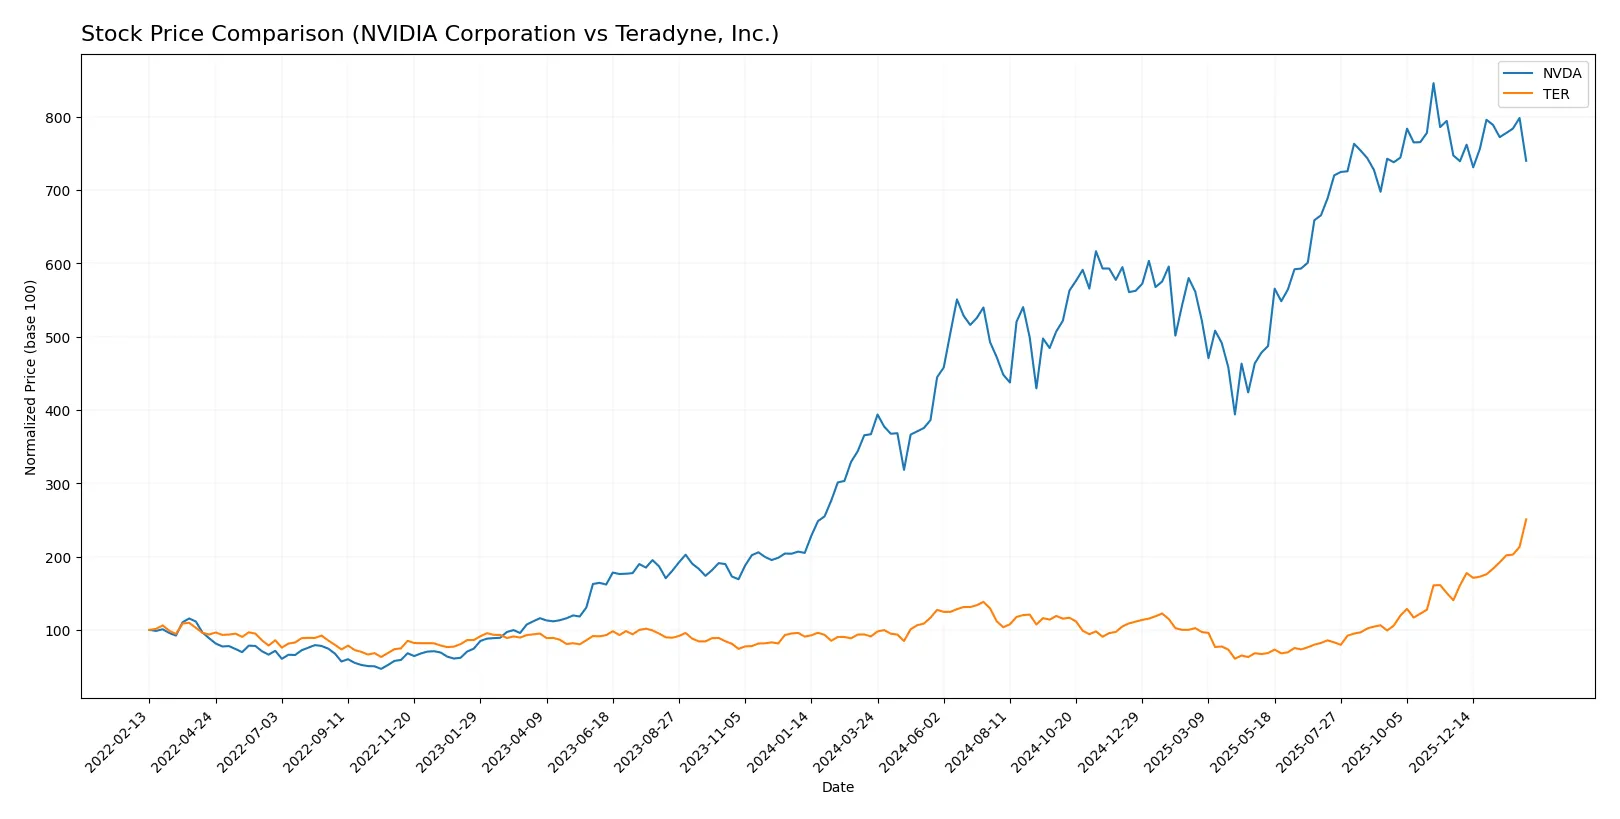
The past year shows strong price appreciation for both stocks, with Teradyne accelerating gains while NVIDIA’s rally slows, reflecting distinct trading dynamics and market sentiment.
Trend Comparison
NVIDIA’s stock rose 101.66% over 12 months, marking a bullish trend with decelerating momentum and volatility at 32.09. The price peaked at 202.49 and bottomed at 76.2.
Teradyne’s stock surged 175.09% over the same period, showing a bullish trend with accelerating gains and higher volatility of 39.74. Its price ranged from 68.72 to 283.51.
Teradyne outperformed NVIDIA in market returns, driven by accelerating price gains and strong buyer dominance in recent months.
Target Prices
Analysts present a robust target price consensus for NVIDIA Corporation and Teradyne, Inc., reflecting optimistic growth prospects.
| Company | Target Low | Target High | Consensus |
|---|---|---|---|
| NVIDIA Corporation | 140 | 352 | 265.21 |
| Teradyne, Inc. | 175 | 305 | 267.33 |
The target consensus for NVIDIA stands well above its current price of $176.73, signaling strong analyst conviction. Teradyne’s consensus is slightly below its $275.15 market price, implying cautious optimism among experts.

Don’t Let Luck Decide Your Entry Point
Optimize your entry points with our advanced ProRealTime indicators. You’ll get efficient buy signals with precise price targets for maximum performance. Start outperforming now!
How do institutions grade them?
The following tables summarize recent institutional grades for NVIDIA Corporation and Teradyne, Inc.:
NVIDIA Corporation Grades
This table presents the latest grades assigned by reputable firms to NVIDIA Corporation shares.
| Grading Company | Action | New Grade | Date |
|---|---|---|---|
| Jefferies | Maintain | Buy | 2026-01-16 |
| Mizuho | Maintain | Outperform | 2026-01-09 |
| Truist Securities | Maintain | Buy | 2025-12-29 |
| Stifel | Maintain | Buy | 2025-12-29 |
| Baird | Maintain | Outperform | 2025-12-26 |
| Bernstein | Maintain | Outperform | 2025-12-26 |
| B of A Securities | Maintain | Buy | 2025-12-26 |
| Truist Securities | Maintain | Buy | 2025-12-19 |
| Tigress Financial | Maintain | Strong Buy | 2025-12-18 |
| Morgan Stanley | Maintain | Overweight | 2025-12-01 |
Teradyne, Inc. Grades
Below are the most recent institutional grades for Teradyne, Inc. shares.
| Grading Company | Action | New Grade | Date |
|---|---|---|---|
| Evercore ISI Group | Maintain | Outperform | 2026-02-03 |
| Cantor Fitzgerald | Maintain | Overweight | 2026-02-02 |
| Stifel | Maintain | Buy | 2026-01-30 |
| UBS | Maintain | Buy | 2026-01-26 |
| B of A Securities | Maintain | Buy | 2026-01-22 |
| Stifel | Maintain | Buy | 2026-01-14 |
| B of A Securities | Maintain | Buy | 2026-01-13 |
| Goldman Sachs | Upgrade | Buy | 2025-12-16 |
| Stifel | Upgrade | Buy | 2025-12-02 |
| Citigroup | Maintain | Buy | 2025-11-12 |
Which company has the best grades?
NVIDIA consistently receives Buy and Outperform ratings with a Strong Buy from Tigress Financial. Teradyne’s grades are also strong but mostly Buy and Outperform without a Strong Buy. NVIDIA’s slightly higher-grade spectrum may attract investors seeking stronger institutional confidence.
Risks specific to each company
The following categories identify the critical pressure points and systemic threats facing both firms in the 2026 market environment:
1. Market & Competition
NVIDIA Corporation
- Dominates GPU and AI markets but faces intense semiconductor competition and cyclic demand.
Teradyne, Inc.
- Operates in automated test equipment niche with slower growth, pressured by tech cycles and industrial automation rivals.
2. Capital Structure & Debt
NVIDIA Corporation
- Maintains low debt-to-equity at 0.13, strong interest coverage of 341x, ensuring financial flexibility.
Teradyne, Inc.
- Zero reported debt, excellent interest coverage at 81x, but lack of leverage may limit growth potential.
3. Stock Volatility
NVIDIA Corporation
- High beta at 2.31 signals significant price swings, raising investor risk amid market turbulence.
Teradyne, Inc.
- Lower beta of 1.82 reflects more moderate volatility, offering relatively stable stock movement.
4. Regulatory & Legal
NVIDIA Corporation
- Faces heightened scrutiny on AI export controls and geopolitical trade restrictions.
Teradyne, Inc.
- Exposure primarily to compliance in industrial and wireless testing, with lower regulatory intensity.
5. Supply Chain & Operations
NVIDIA Corporation
- Global semiconductor supply constraints and reliance on Taiwan pose operational risks.
Teradyne, Inc.
- More diversified supply chain in test equipment, but dependent on chipmakers’ capital spending cycles.
6. ESG & Climate Transition
NVIDIA Corporation
- Invests in energy-efficient AI hardware but faces pressure on carbon footprint and ethical AI use.
Teradyne, Inc.
- Advances in automation support ESG goals but must manage robotics safety and energy consumption concerns.
7. Geopolitical Exposure
NVIDIA Corporation
- Significant exposure to China-US tensions affecting manufacturing and sales.
Teradyne, Inc.
- Limited direct exposure, though global trade tensions could impact supply of components.
Which company shows a better risk-adjusted profile?
NVIDIA’s most impactful risk lies in its market volatility and geopolitical exposure, amplified by high beta and AI export controls. Teradyne’s chief risk is its zero leverage and weaker profitability metrics, limiting growth flexibility. Despite NVIDIA’s higher volatility, its robust capital structure and dominant market position give it a superior risk-adjusted profile. Recent data shows NVIDIA’s interest coverage ratio at a stellar 341x, underscoring financial resilience amid external pressures.
Final Verdict: Which stock to choose?
NVIDIA’s superpower lies in its exceptional ability to generate high returns on invested capital, signaling a robust and sustainable competitive advantage. However, its premium valuation and stretched current ratio warrant caution. It suits investors aiming for aggressive growth, willing to pay for market leadership in AI and semiconductors.
Teradyne’s strategic moat stems from its solid recurring revenue base and operational resilience in industrial automation. It offers a comparatively safer profile than NVIDIA, with more moderate growth expectations. Teradyne fits portfolios focused on growth at a reasonable price, balancing innovation with stability.
If you prioritize rapid value creation and market dominance, NVIDIA outshines with its impressive profitability and growth trajectory despite higher valuation risks. However, if you seek steadier income with less valuation stretch, Teradyne offers better stability and a more balanced risk-return profile. Each presents a compelling scenario depending on your growth tolerance and valuation discipline.
Disclaimer: Investment carries a risk of loss of initial capital. The past performance is not a reliable indicator of future results. Be sure to understand risks before making an investment decision.
Go Further
I encourage you to read the complete analyses of NVIDIA Corporation and Teradyne, Inc. to enhance your investment decisions: