In the fast-evolving semiconductor industry, NVIDIA Corporation and Taiwan Semiconductor Manufacturing Company Limited (TSMC) stand out as two pivotal players shaping the future of technology. NVIDIA leads in advanced graphics and AI computing solutions, while TSMC dominates as a premier chip manufacturer enabling innovation worldwide. This comparison explores their market roles, innovation strategies, and growth potential to help you decide which company merits a spot in your investment portfolio.

Table of contents
Companies Overview
I will begin the comparison between NVIDIA Corporation and Taiwan Semiconductor Manufacturing Company Limited by providing an overview of these two companies and their main differences.
NVIDIA Overview
NVIDIA Corporation focuses on providing graphics, compute, and networking solutions globally. It offers a broad portfolio including GeForce GPUs for gaming, professional workstation graphics, and AI computing platforms for data centers and automotive applications. Headquartered in Santa Clara, California, NVIDIA serves diverse markets such as gaming, professional visualization, datacenter, and automotive, emphasizing innovation in AI and virtual computing.
TSM Overview
Taiwan Semiconductor Manufacturing Company Limited specializes in manufacturing, packaging, and testing integrated circuits and semiconductor devices worldwide. Based in Hsinchu City, Taiwan, TSMC provides advanced wafer fabrication processes and supports customers in high-performance computing, smartphones, IoT, automotive, and digital consumer electronics. It also invests in technology startups and offers engineering support services, maintaining a leading position in semiconductor manufacturing.
Key similarities and differences
Both NVIDIA and TSM operate within the semiconductor industry but differ in their core business models. NVIDIA develops and sells graphics and AI computing hardware and software products, targeting end-user markets like gaming and automotive. Conversely, TSMC operates primarily as a foundry, manufacturing semiconductor chips for other companies using advanced fabrication technologies. While NVIDIA focuses on product innovation and software, TSMC emphasizes manufacturing scale and process technology.
Income Statement Comparison
This table presents a side-by-side comparison of key income statement metrics for NVIDIA Corporation and Taiwan Semiconductor Manufacturing Company Limited for their most recent fiscal years.

| Metric | NVIDIA Corporation (NVDA) | Taiwan Semiconductor Manufacturing Company Limited (TSM) |
|---|---|---|
| Market Cap | 4.46T USD | 1.70T USD |
| Revenue | 130.5B USD | 2.89T TWD |
| EBITDA | 86.1B USD | 1.98T TWD |
| EBIT | 84.3B USD | 1.32T TWD |
| Net Income | 72.9B USD | 1.16T TWD |
| EPS | 2.97 USD | 223.4 TWD |
| Fiscal Year | 2025 | 2024 |
Income Statement Interpretations
NVIDIA Corporation
NVIDIA’s revenue and net income exhibited strong growth from 2021 to 2025, with revenue surging from $16.7B to $130.5B and net income rising from $4.3B to $72.9B. Margins improved significantly, highlighted by a 74.99% gross margin and 55.85% net margin in 2025. The latest year showed exceptional growth, with revenue and profitability more than doubling, reflecting robust operational efficiency and scaling.
Taiwan Semiconductor Manufacturing Company Limited
TSMC demonstrated consistent revenue and net income growth from 2020 to 2024, with revenue increasing from TWD 1.34T to TWD 2.89T and net income from TWD 510.7B to TWD 1.16T. Margins were stable and favorable, with a 56.12% gross margin and 40.02% net margin in 2024. The most recent year posted solid double-digit growth, though net margin improvement was moderate, indicating steady but less dramatic expansion compared to peers.
Which one has the stronger fundamentals?
NVIDIA exhibits more pronounced growth in revenues, net income, and margins, with all income statement metrics rated favorable and substantial margin expansions. TSMC also shows favorable growth and margin stability but with more moderate improvements and some neutral signals in net margin growth. Overall, NVIDIA’s income statement reflects stronger momentum and profitability enhancements over the evaluated period.
Financial Ratios Comparison
The table below compares key financial ratios for NVIDIA Corporation and Taiwan Semiconductor Manufacturing Company Limited based on their most recent fiscal year data.
| Ratios | NVIDIA Corporation (2025) | Taiwan Semiconductor Manufacturing Company Limited (2024) |
|---|---|---|
| ROE | 91.9% | 27.3% |
| ROIC | 75.3% | 20.0% |
| P/E | 39.9 | 29.0 |
| P/B | 36.7 | 7.9 |
| Current Ratio | 4.44 | 2.36 |
| Quick Ratio | 3.88 | 2.14 |
| D/E (Debt to Equity) | 0.13 | 0.25 |
| Debt-to-Assets | 9.2% | 15.6% |
| Interest Coverage | 330 | 126 |
| Asset Turnover | 1.17 | 0.43 |
| Fixed Asset Turnover | 16.16 | 0.88 |
| Payout ratio | 1.14% | 31.3% |
| Dividend yield | 0.03% | 1.08% |
Interpretation of the Ratios
NVIDIA Corporation
NVIDIA shows strong profitability with a net margin of 55.85%, ROE at 91.87%, and ROIC at 75.28%, reflecting excellent returns on equity and invested capital. However, valuation metrics like P/E of 39.9 and P/B of 36.66 are high, indicating expensive stock pricing. The current ratio is elevated at 4.44 but flagged unfavorable. NVIDIA pays a modest dividend yield of 0.03%, which is low relative to its earnings, suggesting limited income focus despite solid free cash flow.
Taiwan Semiconductor Manufacturing Company Limited
TSMC displays solid profitability with a net margin of 40.02%, ROE of 27.29%, and ROIC of 20%, all favorable though less aggressive than NVIDIA. Valuation ratios remain elevated with a P/E of 29.04 and P/B of 7.92, both unfavorable. Liquidity ratios are healthy, with a current ratio of 2.36. TSMC offers a dividend yield of 1.08%, reflecting a more balanced shareholder return policy, supported by good interest coverage and moderate debt levels.
Which one has the best ratios?
NVIDIA’s ratios reflect stronger profitability and efficiency, but its valuation and liquidity ratios are more stretched compared to TSMC. TSMC offers a balanced profile with solid profitability, better liquidity, and a higher dividend yield. Overall, both companies have favorable global ratios, though NVIDIA shows a higher proportion of favorable profitability metrics, while TSMC scores better on liquidity and dividend yield.
Strategic Positioning
This section compares the strategic positioning of NVIDIA and TSMC including market position, key segments, and exposure to technological disruption:
NVIDIA
- Leading semiconductor firm with high market cap and higher beta indicating volatile market.
- Diverse segments: Data Center, Gaming, Automotive, Professional Visualization, OEM.
- Exposure to rapid AI, HPC, and gaming tech disruptions given focus on GPUs and AI software.
TSMC
- Major semiconductor manufacturer with lower beta and significant market cap, less volatile.
- Focused on wafer fabrication, integrated circuits, and other semiconductor products.
- Faces technological challenges in wafer tech but less diversified in end-market applications.
NVIDIA vs TSMC Positioning
NVIDIA’s approach is diversified across multiple high-growth technology segments, leveraging GPUs and AI platforms, while TSMC concentrates on semiconductor manufacturing scale and wafer fabrication. NVIDIA benefits from broad market reach; TSMC from manufacturing specialization.
Which has the best competitive advantage?
NVIDIA shows a very favorable moat with increasing ROIC and strong value creation, whereas TSMC has a slightly favorable moat with declining profitability, indicating NVIDIA currently holds a stronger competitive advantage.
Stock Comparison
The past year has seen significant bullish momentum for both NVIDIA Corporation and Taiwan Semiconductor Manufacturing Company Limited, marked by substantial price gains and contrasting recent trading dynamics.
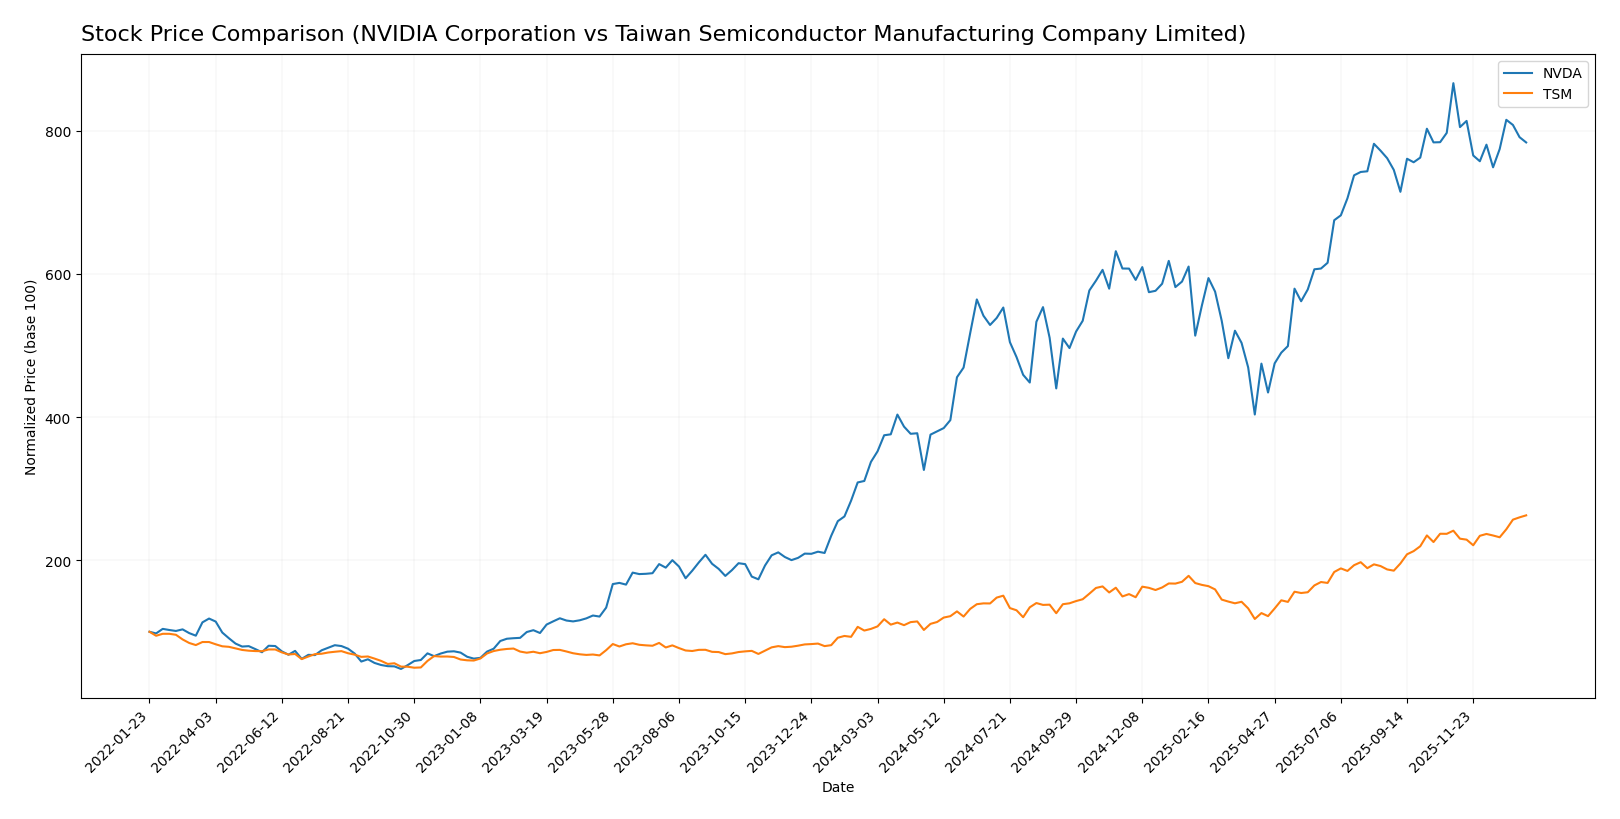
Trend Analysis
NVIDIA Corporation’s stock exhibited a strong bullish trend over the past 12 months with a 132.35% price increase, though this growth is decelerating. The price ranged from a low of 76.2 to a high of 202.49, with recent weeks showing a slight bearish correction of -9.56%.
Taiwan Semiconductor Manufacturing Company Limited’s stock demonstrated an accelerating bullish trend over the same period, with a 152.54% price increase and wider volatility. Its price fluctuated between 127.7 and 327.11, with a recent positive trend gaining 8.88%.
Comparing both, Taiwan Semiconductor Manufacturing Company Limited delivered the highest market performance with a 152.54% gain versus NVIDIA’s 132.35% over the past year.
Target Prices
Analysts present a bullish consensus for both NVIDIA Corporation and Taiwan Semiconductor Manufacturing Company Limited.
| Company | Target High | Target Low | Consensus |
|---|---|---|---|
| NVIDIA Corporation | 352 | 140 | 264.34 |
| Taiwan Semiconductor Manufacturing Company Limited | 400 | 330 | 361.25 |
The target consensus for NVIDIA at 264.34 USD suggests significant upside from its current price of 183.14 USD, while TSM’s consensus of 361.25 USD also indicates upside potential above its current 327.11 USD price.
Analyst Opinions Comparison
This section compares analysts’ ratings and grades for NVIDIA Corporation and Taiwan Semiconductor Manufacturing Company Limited:
Rating Comparison
NVIDIA Corporation Rating
- Rating: B+, considered very favorable by analysts.
- Discounted Cash Flow Score: Moderate at 3 out of 5.
- ROE Score: Very favorable at 5, indicating efficient profit use.
- ROA Score: Very favorable at 5, showing effective asset use.
- Debt To Equity Score: Moderate at 3, reflecting some financial risk.
- Overall Score: Moderate at 3 out of 5.
Taiwan Semiconductor Manufacturing Company Limited Rating
- Rating: A-, also considered very favorable by analysts.
- Discounted Cash Flow Score: Very favorable at 5 out of 5.
- ROE Score: Very favorable at 5, indicating efficient profit use.
- ROA Score: Very favorable at 5, showing effective asset use.
- Debt To Equity Score: Moderate at 3, reflecting some financial risk.
- Overall Score: Favorable at 4 out of 5.
Which one is the best rated?
Based strictly on the provided data, Taiwan Semiconductor (TSM) holds a higher overall score and superior discounted cash flow score compared to NVIDIA (NVDA), making TSM the better rated company in this comparison.
Scores Comparison
Here is a comparison of the Altman Z-Score and Piotroski Score for NVIDIA and TSM:
NVIDIA Scores
- Altman Z-Score: 68.04, indicating a safe zone, very low bankruptcy risk.
- Piotroski Score: 6, rated as average financial strength.
TSM Scores
- Altman Z-Score: 2.94, in the grey zone with moderate bankruptcy risk.
- Piotroski Score: 8, rated as very strong financial strength.
Which company has the best scores?
NVIDIA’s Altman Z-Score is significantly higher, indicating stronger bankruptcy safety, while TSM’s Piotroski Score is higher, reflecting stronger financial health. Each company leads in a different score category based on the data.
Grades Comparison
Here is a summary of the recent grades assigned to NVIDIA Corporation and Taiwan Semiconductor Manufacturing Company Limited:
NVIDIA Corporation Grades
The table below lists the latest grades from recognized financial institutions for NVIDIA Corporation:
| Grading Company | Action | New Grade | Date |
|---|---|---|---|
| Mizuho | Maintain | Outperform | 2026-01-09 |
| Truist Securities | Maintain | Buy | 2025-12-29 |
| Stifel | Maintain | Buy | 2025-12-29 |
| B of A Securities | Maintain | Buy | 2025-12-26 |
| Baird | Maintain | Outperform | 2025-12-26 |
| Bernstein | Maintain | Outperform | 2025-12-26 |
| Truist Securities | Maintain | Buy | 2025-12-19 |
| Tigress Financial | Maintain | Strong Buy | 2025-12-18 |
| Morgan Stanley | Maintain | Overweight | 2025-12-01 |
| Deutsche Bank | Maintain | Hold | 2025-11-20 |
NVIDIA’s grades predominantly indicate a strong buy or outperform consensus, with most institutions maintaining positive ratings.
Taiwan Semiconductor Manufacturing Company Limited Grades
The table below summarizes recent grades from established analysts for Taiwan Semiconductor Manufacturing Company Limited (TSMC):
| Grading Company | Action | New Grade | Date |
|---|---|---|---|
| Bernstein | Maintain | Outperform | 2025-12-08 |
| Needham | Maintain | Buy | 2025-10-27 |
| Barclays | Maintain | Overweight | 2025-10-17 |
| Needham | Maintain | Buy | 2025-10-16 |
| Susquehanna | Maintain | Positive | 2025-10-10 |
| Barclays | Maintain | Overweight | 2025-10-09 |
| Barclays | Maintain | Overweight | 2025-09-16 |
| Needham | Maintain | Buy | 2025-07-17 |
| Susquehanna | Maintain | Positive | 2025-07-14 |
| Needham | Maintain | Buy | 2025-07-01 |
TSMC’s ratings mostly range from buy to outperform and overweight, reflecting consistent positive sentiment from analysts.
Which company has the best grades?
NVIDIA holds a slightly stronger consensus with several “Strong Buy” and “Outperform” ratings, while TSMC’s grades cluster around “Buy” and “Overweight.” This suggests NVIDIA may be viewed as having greater growth potential, which could influence investor preference towards higher expected returns but possibly with differing risk profiles.
Strengths and Weaknesses
Below is a comparative table summarizing the key strengths and weaknesses of NVIDIA Corporation (NVDA) and Taiwan Semiconductor Manufacturing Company Limited (TSM) based on the most recent financial and operational data.
| Criterion | NVIDIA Corporation (NVDA) | Taiwan Semiconductor Manufacturing Company Limited (TSM) |
|---|---|---|
| Diversification | High diversification across Data Center ($115B), Gaming ($11.35B), Automotive ($1.69B), and Professional Visualization segments. | Primarily focused on Wafer manufacturing (~TWD 1.99T) with Other Products (~TWD 380B); less diversified product line. |
| Profitability | Very strong profitability: Net margin 55.85%, ROE 91.87%, ROIC 75.28%. | Strong profitability but less than NVDA: Net margin 40.02%, ROE 27.29%, ROIC 20.0%. |
| Innovation | Demonstrates a durable competitive advantage with very favorable moat and rapidly growing ROIC (+339%). | Slightly favorable moat; profitable but ROIC declining by -10.4%, indicating challenges in maintaining innovation momentum. |
| Global presence | Significant global presence in AI, gaming, and automotive sectors; rapid revenue growth in Data Center segment. | Global leader in semiconductor manufacturing but more sensitive to cyclical chip demand and geopolitical risks. |
| Market Share | Leading market share in GPU and AI accelerators with expanding automotive and professional visualization markets. | Dominant market share in semiconductor foundry services but faces strong competition and cyclical volatility. |
Key takeaways: NVIDIA’s broad diversification, exceptional profitability, and accelerating innovation provide a robust competitive edge. TSM remains a strong value creator with solid profitability, though its slowing ROIC growth signals caution regarding future growth sustainability. Investors should weigh NVDA’s higher growth potential against TSM’s relative stability and market leadership.
Risk Analysis
Below is a comparative risk assessment table for NVIDIA Corporation and Taiwan Semiconductor Manufacturing Company Limited based on the most recent data available.
| Metric | NVIDIA Corporation (NVDA) | Taiwan Semiconductor Manufacturing Company (TSM) |
|---|---|---|
| Market Risk | High volatility (Beta 2.31) | Moderate volatility (Beta 1.27) |
| Debt level | Low debt-to-equity (0.13) | Moderate debt-to-equity (0.25) |
| Regulatory Risk | Moderate, US and global markets | Moderate, geopolitical tensions in Taiwan region |
| Operational Risk | High reliance on innovation | Complex manufacturing operations |
| Environmental Risk | Moderate, industry-related | Moderate, industry-related |
| Geopolitical Risk | Moderate, global supply chains | High, Taiwan’s geopolitical situation |
The most impactful and likely risks are NVIDIA’s high market volatility and TSM’s geopolitical exposure due to Taiwan’s sensitive regional standing. NVIDIA benefits from strong financial health but faces valuation pressures, while TSM shows solid fundamentals but remains vulnerable to geopolitical disruptions.
Which Stock to Choose?
NVIDIA Corporation (NVDA) shows a strong income evolution with a 114.2% revenue growth in 2025 and very favorable profitability metrics, including a 55.85% net margin and a 91.87% ROE. Its debt levels are low, supported by a net debt to EBITDA of 0.02, and it holds a very favorable overall rating of B+. The company demonstrates a very favorable moat with a ROIC well above WACC and a growing profitability trend.
Taiwan Semiconductor Manufacturing Company Limited (TSM) presents steady income growth of 33.89% in 2024, with favorable profitability metrics such as a 40.02% net margin and 27.29% ROE. It maintains a moderate debt profile, with net debt to EBITDA negative (indicating net cash), and a very favorable rating of A-. Its economic moat is slightly favorable, with positive value creation but a declining ROIC trend.
For investors prioritizing rapid growth and strong profitability, NVDA might appear more attractive given its very favorable income evolution, robust financial ratios, and durable competitive advantage. Conversely, investors favoring stability and a solid rating with a slightly more moderate growth profile could view TSM as a favorable option, particularly considering its strong cash position and favorable rating. Thus, the choice may depend on the investor’s risk tolerance and investment strategy focus.
Disclaimer: Investment carries a risk of loss of initial capital. The past performance is not a reliable indicator of future results. Be sure to understand risks before making an investment decision.
Go Further
I encourage you to read the complete analyses of NVIDIA Corporation and Taiwan Semiconductor Manufacturing Company Limited to enhance your investment decisions: