Home > Comparison > Technology > NVDA vs STM
The strategic rivalry between NVIDIA Corporation and STMicroelectronics N.V. shapes the semiconductor industry’s evolution. NVIDIA leads as a high-margin, innovation-driven technology powerhouse, focusing on GPUs, AI, and data centers. STMicroelectronics operates as a diversified semiconductor manufacturer with strengths in automotive and industrial analog solutions. This analysis will clarify which company’s trajectory delivers superior risk-adjusted returns, crucial for portfolio diversification in a rapidly advancing tech landscape.
Table of contents
Companies Overview
NVIDIA and STMicroelectronics stand as key players shaping the global semiconductor landscape.
NVIDIA Corporation: Pioneer in Graphics and AI Computing
NVIDIA dominates the semiconductor sector with a diverse portfolio spanning gaming GPUs, AI data center platforms, and automotive AI systems. Its revenue engine thrives on high-performance hardware and cutting-edge software like GeForce NOW and Omniverse. In 2026, NVIDIA emphasizes expanding AI compute infrastructure and automotive autonomous solutions, solidifying its tech leadership.
STMicroelectronics N.V.: Versatile Semiconductor Innovator
STMicroelectronics leads in integrated circuits for automotive, industrial, and consumer electronics. Its broad product mix includes automotive ICs, analog components, MEMS sensors, and microcontrollers. The company’s 2026 strategy focuses on enhancing analog and power device offerings, targeting growth in electric vehicles and IoT sectors through innovation and regional diversification.
Strategic Collision: Similarities & Divergences
Both companies innovate in semiconductors but diverge in focus: NVIDIA builds a closed ecosystem around AI and graphics, while STMicroelectronics adopts an open, diversified component approach across industries. They compete primarily in automotive and industrial tech markets. NVIDIA offers a high-growth, high-beta profile; STMicroelectronics presents more diversified exposure with steadier returns.
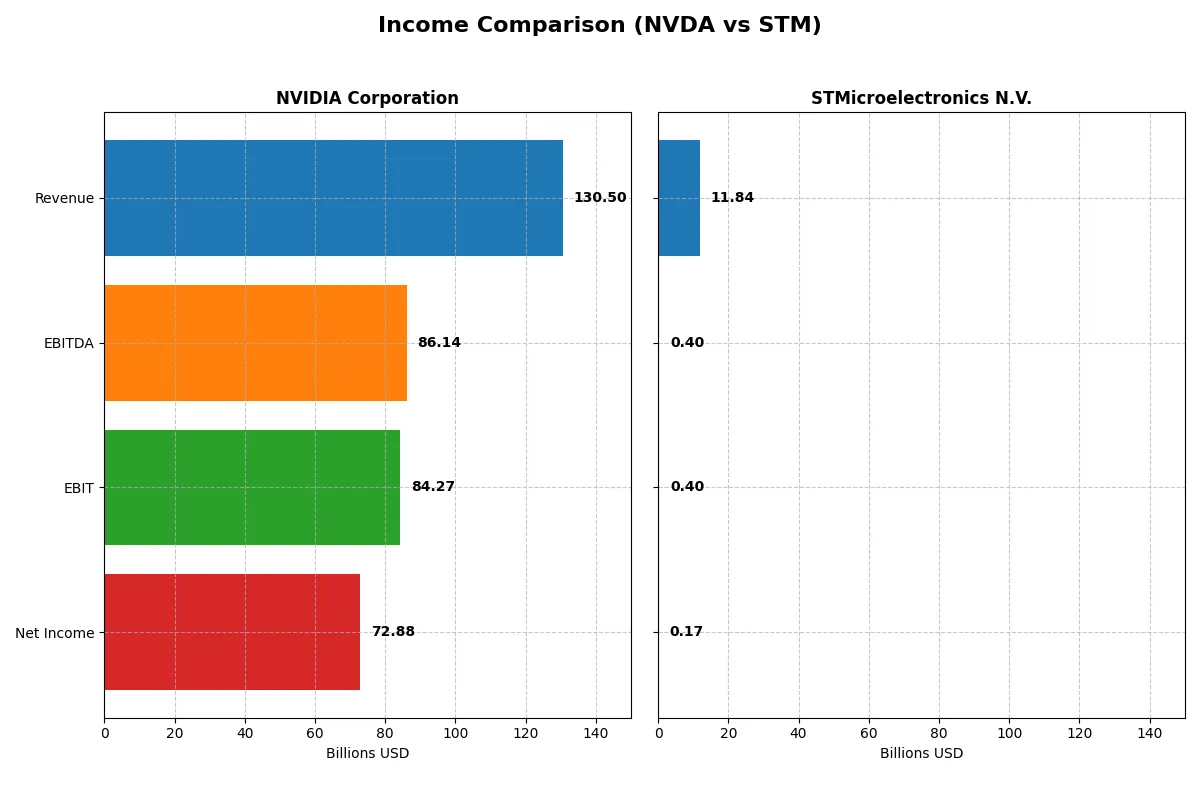
Income Statement Comparison
This data dissects the core profitability and scalability of both corporate engines to reveal who dominates the bottom line:
| Metric | NVIDIA Corporation (NVDA) | STMicroelectronics N.V. (STM) |
|---|---|---|
| Revenue | 130.5B | 11.8B |
| Cost of Revenue | 32.6B | 7.8B |
| Operating Expenses | 16.4B | 3.7B |
| Gross Profit | 97.9B | 4.0B |
| EBITDA | 86.1B | 401M |
| EBIT | 84.3B | 401M |
| Interest Expense | 247M | 0 |
| Net Income | 72.9B | 0 |
| EPS | 2.97 | 0.19 |
| Fiscal Year | 2025 | 2025 |
Income Statement Analysis: The Bottom-Line Duel
This income statement comparison exposes the core efficiency and profitability dynamics driving each company’s financial engine.
NVIDIA Corporation Analysis
NVIDIA’s revenue soared from $16.7B in 2021 to $130.5B in 2025, with net income surging from $4.3B to $72.9B. Its gross margin sustains near 75%, while net margin improved to 55.9%. The latest year shows exceptional momentum, with a 114% revenue jump and strong margin expansion, reflecting operational excellence and aggressive capital allocation.
STMicroelectronics N.V. Analysis
STMicroelectronics’ revenue peaked at $17.3B in 2023 but declined to $11.8B by 2025. Net income plunged from $4.2B to near zero in the same period. Gross margin hovers around 34%, but net margin deteriorated to a mere 1.4%. Recent years reveal shrinking top-line and collapsing profitability, signaling operational challenges and weak cost control amid market pressures.
Margin Dominance vs. Revenue Erosion
NVIDIA clearly outperforms STMicroelectronics with robust revenue growth and superior margins, driving net income growth by over 1500% versus a near-total decline at STM. For investors prioritizing efficiency and scalable profits, NVIDIA’s profile offers far greater fundamental strength and growth potential compared to STM’s struggling turnaround.
Financial Ratios Comparison
These vital ratios act as a diagnostic tool to expose the underlying fiscal health, valuation premiums, and capital efficiency of the companies compared below:
| Ratios | NVIDIA Corporation (NVDA) | STMicroelectronics N.V. (STM) |
|---|---|---|
| ROE | 91.9% | 0.9% |
| ROIC | 75.3% | 0.7% |
| P/E | 39.9 | N/A |
| P/B | 36.7 | N/A |
| Current Ratio | 4.44 | 3.36 |
| Quick Ratio | 3.88 | 2.43 |
| D/E (Debt-to-Equity) | 0.13 | 0.12 |
| Debt-to-Assets | 9.2% | 8.6% |
| Interest Coverage | 330 | 0 |
| Asset Turnover | 1.17 | 0.48 |
| Fixed Asset Turnover | 16.16 | 1.07 |
| Payout Ratio | 1.1% | 0% |
| Dividend Yield | 0.03% | 0% |
| Fiscal Year | 2025 | 2025 |
Efficiency & Valuation Duel: The Vital Signs
Ratios act as a company’s DNA, revealing hidden risks and operational excellence beyond surface-level financials.
NVIDIA Corporation
NVIDIA dominates with an exceptional 91.87% ROE and a robust 55.85% net margin, showcasing superior profitability. However, its valuation appears stretched, with a high P/E of 39.9 and P/B of 36.66. Shareholders receive minimal dividends, reflecting a strategy focused on reinvesting in R&D and growth to sustain its competitive edge.
STMicroelectronics N.V.
STMicroelectronics struggles with weak profitability, posting just 0.93% ROE and a 1.41% net margin. The valuation metrics are favorable due to low multiples, but operational efficiency lags with a modest asset turnover of 0.48. The company offers no dividend, likely prioritizing internal reinvestment amid subdued returns and cautious growth prospects.
Premium Profitability vs. Value Caution
NVIDIA balances high operational efficiency with premium valuation, exposing investors to stretched price risk but superior returns. STMicroelectronics offers a more conservative valuation but suffers from weak profitability and efficiency. Growth-oriented investors may lean toward NVIDIA, while risk-averse profiles might find STMicroelectronics’ valuation more appealing despite operational challenges.
Which one offers the Superior Shareholder Reward?
I compare NVIDIA and STMicroelectronics’ shareholder rewards. NVIDIA pays a negligible dividend yield (~0.03%) with a very low payout ratio (~1.1%), focusing heavily on share buybacks fueled by robust free cash flow (2.5/share). STMicroelectronics yields about 1.28% with a 18.5% payout ratio but struggles with negative free cash flow (-0.24/share in 2025), limiting buyback potential. NVIDIA’s aggressive buyback program and minimal dividend payout sustain long-term value better than STM’s modest dividend and weak cash generation. I conclude NVIDIA offers a superior total return profile in 2026.
Comparative Score Analysis: The Strategic Profile
The radar chart reveals the fundamental DNA and trade-offs of NVIDIA Corporation and STMicroelectronics N.V., highlighting strengths and weaknesses across key financial metrics:
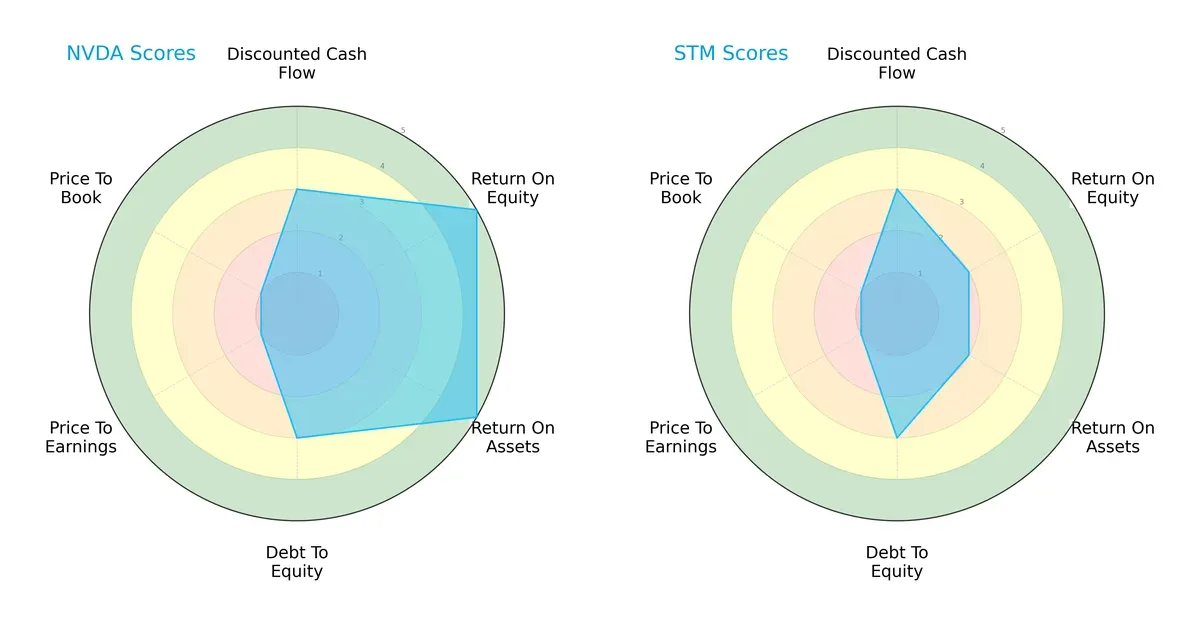
NVIDIA excels in profitability with top ROE and ROA scores (5 each), signaling superior capital efficiency. Both firms share moderate DCF and debt-to-equity profiles (3 each). Valuation metrics (P/E and P/B) are weak for both, scoring 1, indicating potential overvaluation or market skepticism. STMicroelectronics shows a more balanced but modest profile, relying less on profitability and more on stable leverage. NVIDIA’s edge is profitability dominance, while STM presents a steadier but less dynamic stance.
Bankruptcy Risk: Solvency Showdown
NVIDIA’s Altman Z-Score of 71.4 vastly outpaces STM’s 3.9, placing both in the safe zone but with a significant margin favoring NVIDIA’s long-term solvency:
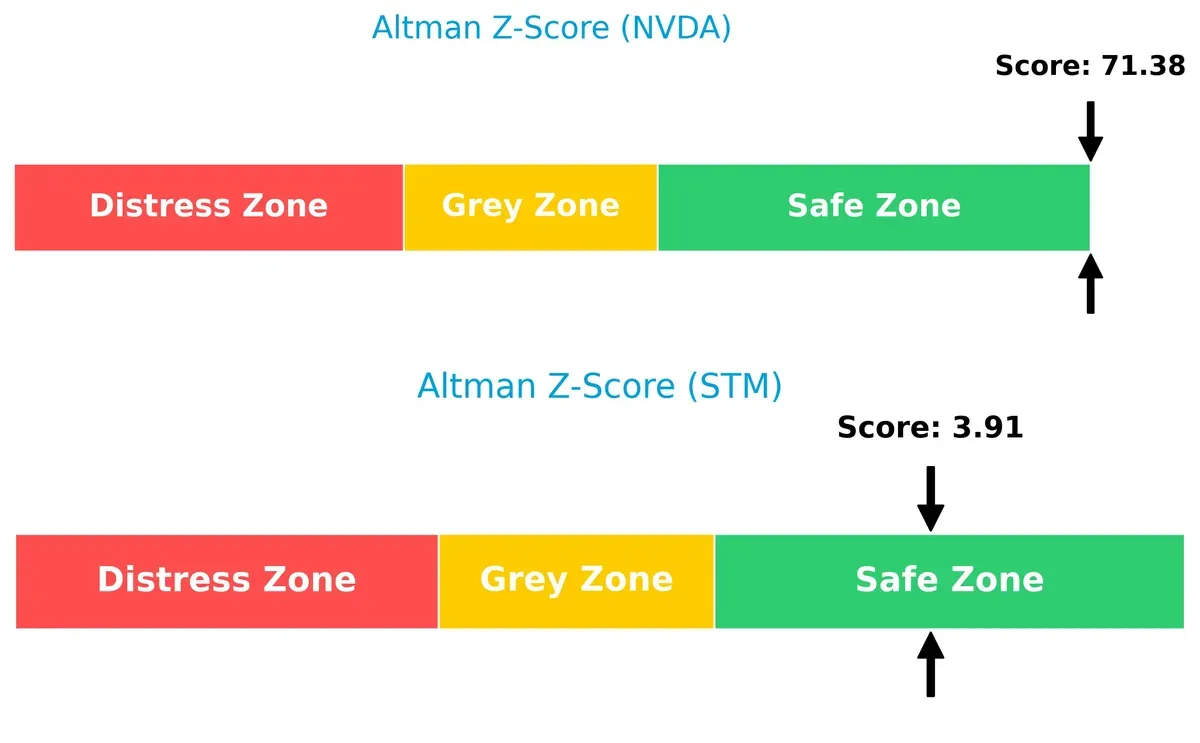
This wide gap reflects NVIDIA’s robust financial health and lower bankruptcy risk. STM, while still safe, operates closer to financial thresholds. Historically, such a delta underlines NVIDIA’s resilience in downturns and STM’s comparatively higher vulnerability to economic shocks.
Financial Health: Quality of Operations
STMicroelectronics scores 8 on the Piotroski F-Score, outperforming NVIDIA’s 6, signaling superior operational quality and internal financial strength:
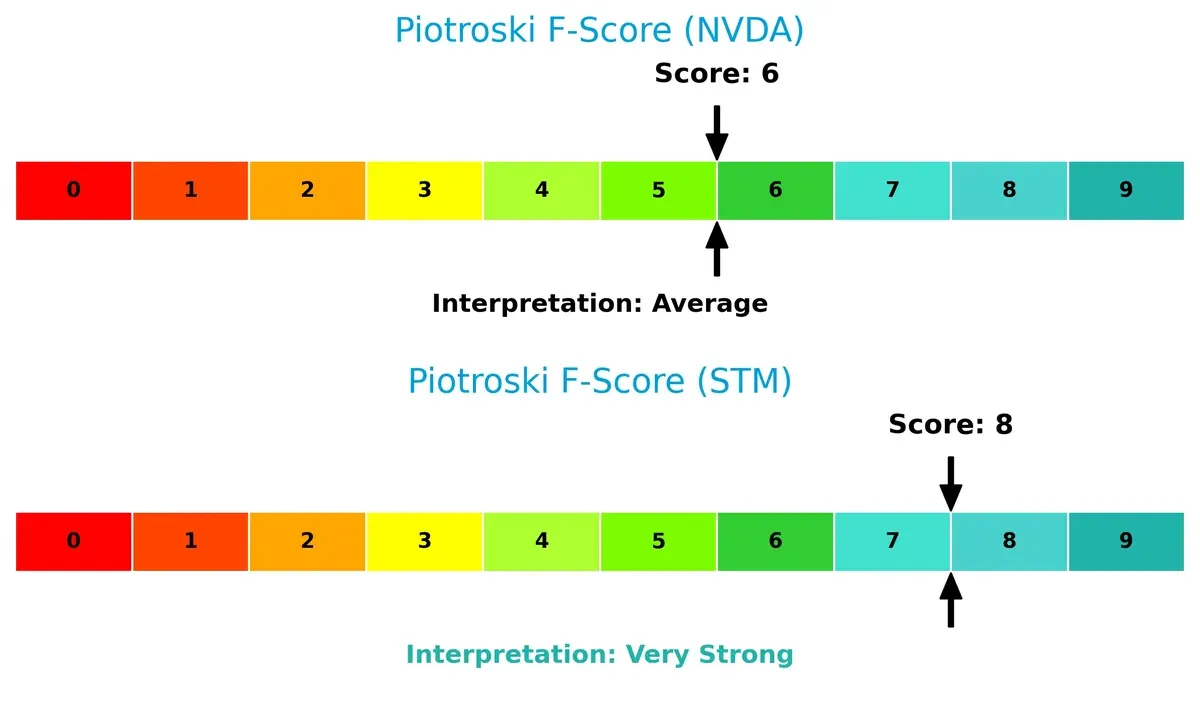
STM’s very strong score indicates solid profitability, liquidity, and efficiency metrics, minimizing red flags. NVIDIA’s average score suggests room for improvement in internal controls or earnings quality. Investors should watch NVIDIA’s operational metrics closely despite its market dominance.
How are the two companies positioned?
This section dissects NVDA and STM’s operational DNA by comparing revenue distribution and internal dynamics. The goal is to confront their economic moats to reveal which model offers the most resilient competitive advantage today.
Revenue Segmentation: The Strategic Mix
This visual comparison dissects how NVIDIA Corporation and STMicroelectronics diversify their income streams and highlights their primary sector bets:
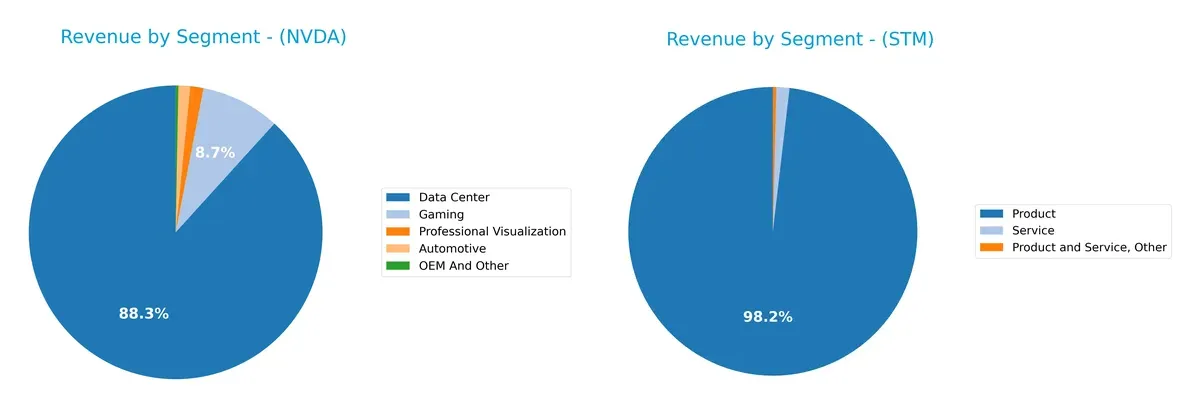
NVIDIA’s revenue pivots heavily on Data Center at $115B, dwarfing other segments like Gaming at $11.35B and Automotive at $1.69B. This concentration signals NVIDIA’s dominance in AI and cloud infrastructure but carries concentration risk. STMicroelectronics shows a more balanced mix, with Products at $13.2B and Services at $196M, reflecting a diversified industrial semiconductor base and less dependency on a single market.
Strengths and Weaknesses Comparison
This table compares the Strengths and Weaknesses of NVIDIA and STMicroelectronics:
NVIDIA Strengths
- High net margin at 56%
- Very strong ROE at 92%
- Superior ROIC at 75% above WACC
- Low debt-to-assets ratio at 9.2%
- Strong quick ratio and interest coverage
- Diverse revenue streams including Data Center and Automotive
STMicroelectronics Strengths
- Favorable PE and PB ratios indicating valuation appeal
- Low debt-to-assets at 8.6%
- Infinite interest coverage ratio
- Positive quick ratio and debt-to-equity control
- Regional sales diversification including Asia and Europe
NVIDIA Weaknesses
- High WACC at 14.7% reduces capital efficiency
- Unfavorable PE and PB ratios imply overvaluation
- Current ratio elevated at 4.44, possibly inefficient asset use
- Minimal dividend yield at 0.03%
- Expensive valuation metrics relative to sector
STMicroelectronics Weaknesses
- Very low profitability metrics: net margin 1.4%, ROE 0.9%, ROIC 0.7%
- Current ratio at 3.36 signals potential liquidity concerns
- Asset turnover weak at 0.48, limiting efficiency
- No dividend yield, limiting income for investors
NVIDIA exhibits robust profitability and capital efficiency but faces valuation and capital cost challenges. STMicroelectronics shows valuation appeal and strong balance sheet metrics but struggles with low profitability and asset efficiency, affecting its competitive positioning.
The Moat Duel: Analyzing Competitive Defensibility
A structural moat is the only thing protecting long-term profits from relentless competitive erosion and market commoditization:
NVIDIA Corporation: Technological Dominance and Network Effects
NVIDIA’s moat stems from cutting-edge GPU innovation and robust network effects in AI and gaming. Its 60%+ ROIC above WACC and 74.99% gross margin confirm durable profitability. Expansion into AI data centers and autonomous vehicles in 2026 should deepen this moat.
STMicroelectronics N.V.: Diversified Product Portfolio with Margin Pressure
STMicroelectronics relies on a diversified semiconductor product range but faces margin compression and a shrinking ROIC trending negative. Its 3.39% EBIT margin pales compared to NVIDIA’s, signaling a weaker moat. Recovery depends on innovation and penetrating emerging markets.
Technological Innovation vs. Product Diversification: Who Holds the Moat Edge?
NVIDIA’s expanding ROIC and margin dominance reveal a wider, deeper moat than STMicroelectronics, whose negative ROIC signals value destruction. NVIDIA is clearly better positioned to defend and grow market share in 2026.
Which stock offers better returns?
Over the past year, NVIDIA’s shares surged over 100%, showing strong gains despite recent deceleration. STMicroelectronics faced a steep 36% decline but gained momentum late in the period.
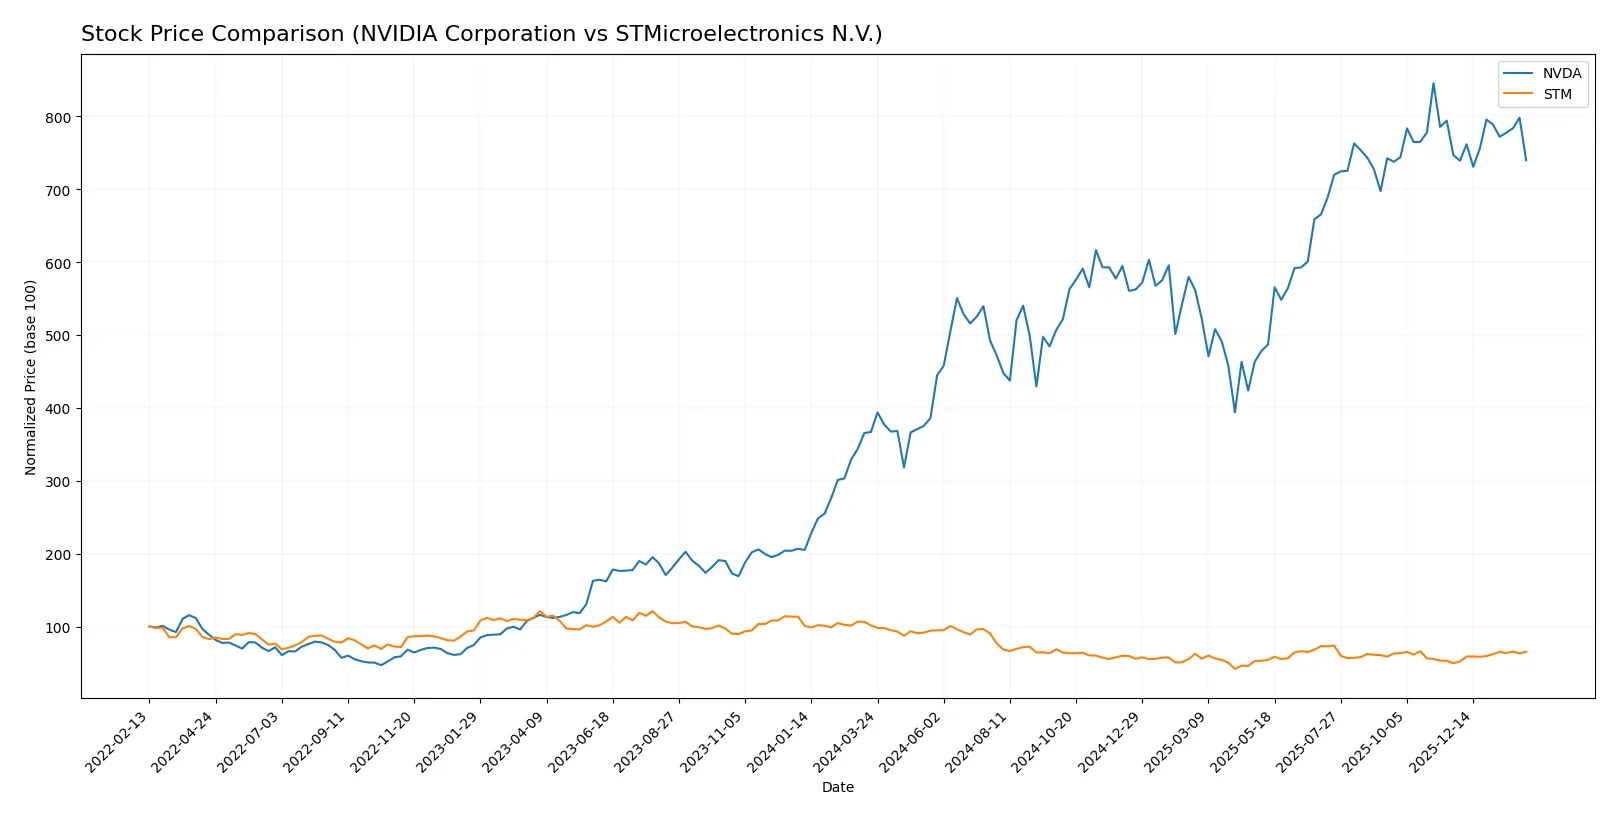
Trend Comparison
NVIDIA’s stock rose 101.66% over 12 months, marking a bullish trend with high volatility. The price peaked at 202.49 and slowed its upward momentum recently.
STMicroelectronics dropped 35.63% in the same period, reflecting a bearish trend. However, recent months show accelerated recovery with a 31.41% gain and reduced volatility.
NVIDIA delivered the highest market performance overall, despite STMicroelectronics’ recent rebound suggesting improving investor sentiment.
Target Prices
Analysts project a wide but optimistic range for NVIDIA Corporation and STMicroelectronics N.V.
| Company | Target Low | Target High | Consensus |
|---|---|---|---|
| NVIDIA Corporation | 140 | 352 | 265.21 |
| STMicroelectronics N.V. | 28 | 45 | 37.67 |
NVIDIA’s target consensus of 265.21 indicates a potential 49% upside from the current 177.9 price. STMicroelectronics shows a modest 30% upside from 28.91.

Don’t Let Luck Decide Your Entry Point
Optimize your entry points with our advanced ProRealTime indicators. You’ll get efficient buy signals with precise price targets for maximum performance. Start outperforming now!
How do institutions grade them?
Here are the latest institutional grades for NVIDIA Corporation and STMicroelectronics N.V.:
NVIDIA Corporation Grades
The following table shows recent grades issued by established financial institutions for NVIDIA:
| Grading Company | Action | New Grade | Date |
|---|---|---|---|
| Jefferies | Maintain | Buy | 2026-01-16 |
| Mizuho | Maintain | Outperform | 2026-01-09 |
| Truist Securities | Maintain | Buy | 2025-12-29 |
| Stifel | Maintain | Buy | 2025-12-29 |
| Baird | Maintain | Outperform | 2025-12-26 |
| Bernstein | Maintain | Outperform | 2025-12-26 |
| B of A Securities | Maintain | Buy | 2025-12-26 |
| Truist Securities | Maintain | Buy | 2025-12-19 |
| Tigress Financial | Maintain | Strong Buy | 2025-12-18 |
| Morgan Stanley | Maintain | Overweight | 2025-12-01 |
STMicroelectronics N.V. Grades
Below are recent grades from recognized grading firms for STMicroelectronics:
| Grading Company | Action | New Grade | Date |
|---|---|---|---|
| TD Cowen | Maintain | Buy | 2025-10-24 |
| Susquehanna | Maintain | Positive | 2025-10-22 |
| Susquehanna | Maintain | Positive | 2025-07-25 |
| Baird | Upgrade | Outperform | 2025-07-22 |
| Susquehanna | Maintain | Positive | 2025-07-22 |
| Jefferies | Upgrade | Buy | 2025-02-19 |
| Bernstein | Downgrade | Market Perform | 2025-02-05 |
| Susquehanna | Maintain | Positive | 2025-01-31 |
| Barclays | Downgrade | Underweight | 2025-01-22 |
| JP Morgan | Downgrade | Neutral | 2024-12-09 |
Which company has the best grades?
NVIDIA consistently receives high marks, including multiple “Buy” and “Outperform” ratings, plus a “Strong Buy” from Tigress Financial. STMicroelectronics shows more mixed opinions, with upgrades balanced by recent downgrades. Investors may view NVIDIA’s stronger consensus as a sign of greater confidence from institutions.
Risks specific to each company
The following categories identify critical pressure points and systemic threats facing NVIDIA Corporation and STMicroelectronics in the 2026 market environment:
1. Market & Competition
NVIDIA Corporation
- Dominates GPU and AI compute markets with strong innovation but faces intense competition and valuation pressures.
STMicroelectronics N.V.
- Competes in diversified semiconductor segments but struggles with lower margins and weaker profitability.
2. Capital Structure & Debt
NVIDIA Corporation
- Maintains low debt-to-equity (0.13) and strong interest coverage (341x), showing solid financial flexibility.
STMicroelectronics N.V.
- Also low leverage (0.12) with infinite interest coverage, indicating strong balance sheet but less efficient capital use.
3. Stock Volatility
NVIDIA Corporation
- High beta (2.31) signals elevated stock price volatility and sensitivity to market swings.
STMicroelectronics N.V.
- Moderate beta (1.32) suggests lower but still significant stock price fluctuations.
4. Regulatory & Legal
NVIDIA Corporation
- Faces increasing scrutiny over AI export controls and geopolitical tech restrictions.
STMicroelectronics N.V.
- Encounters regulatory challenges mainly from European and global semiconductor trade policies.
5. Supply Chain & Operations
NVIDIA Corporation
- Relies heavily on global foundry partners; supply chain disruptions could impact production.
STMicroelectronics N.V.
- Vertically integrated with diverse manufacturing, but exposed to raw material price volatility.
6. ESG & Climate Transition
NVIDIA Corporation
- Focuses on energy-efficient AI chips and sustainable initiatives, but must manage high energy consumption.
STMicroelectronics N.V.
- Advances in green manufacturing and sensor tech support ESG goals, yet industrial exposure adds risks.
7. Geopolitical Exposure
NVIDIA Corporation
- High exposure to US-China tensions affecting semiconductor exports and supply chains.
STMicroelectronics N.V.
- European base buffers some risk but global operations still vulnerable to geopolitical shifts.
Which company shows a better risk-adjusted profile?
NVIDIA’s highest risk is its elevated stock volatility and regulatory scrutiny amid lofty valuations. STMicroelectronics’ main risk lies in weak profitability despite solid balance sheet metrics. Overall, NVIDIA offers a stronger financial foundation but with higher market and regulatory risks. STMicroelectronics presents a more moderate but profit-challenged profile. Recent data show NVIDIA’s return on invested capital at 75%, dwarfing ST’s 0.7%, underscoring NVIDIA’s superior capital efficiency despite volatility concerns. I consider NVIDIA to have a better risk-adjusted profile given its dominant market position and robust financial health, balanced against its valuation and geopolitical risks.
Final Verdict: Which stock to choose?
NVIDIA’s superpower lies in its exceptional capital efficiency and robust competitive moat, demonstrated by a ROIC vastly exceeding its WACC. Its dominant position in AI and graphics chips powers impressive growth. A point of vigilance remains its stretched valuation multiples, which could pressure returns. It suits an aggressive growth portfolio seeking innovation leaders.
STMicroelectronics offers a strategic moat rooted in diversified semiconductor manufacturing and solid balance sheet discipline. Its valuation appears more reasonable, providing relative safety compared to NVIDIA’s premium. However, it faces challenges in profitability and value creation, fitting better in a GARP portfolio that balances growth with measured risk.
If you prioritize high-growth and market leadership backed by a strong moat, NVIDIA outshines with superior profitability and innovation-driven returns despite valuation risks. However, if you seek more stability and value orientation with moderate growth, STMicroelectronics offers a compelling scenario with less premium and steady financial footing.
Disclaimer: Investment carries a risk of loss of initial capital. The past performance is not a reliable indicator of future results. Be sure to understand risks before making an investment decision.
Go Further
I encourage you to read the complete analyses of NVIDIA Corporation and STMicroelectronics N.V. to enhance your investment decisions: