Home > Comparison > Technology > NVDA vs SWKS
The strategic rivalry between NVIDIA Corporation and Skyworks Solutions defines the semiconductor industry’s innovation frontier. NVIDIA operates as a technology powerhouse with a broad portfolio spanning gaming GPUs, AI data centers, and automotive platforms. In contrast, Skyworks specializes in analog semiconductor components serving diverse communication markets. This analysis will dissect their distinct business models to identify which offers superior risk-adjusted returns for a balanced portfolio amid shifting sector dynamics.
Table of contents
Companies Overview
NVIDIA and Skyworks Solutions anchor critical segments of the semiconductor industry with distinct market footprints.
NVIDIA Corporation: Leader in Graphics and AI Computing
NVIDIA dominates the semiconductor sector with its graphics processing units (GPUs) and AI-driven compute platforms. Its revenues stem largely from gaming GPUs, professional visualization, and datacenter AI solutions. In 2026, NVIDIA’s strategic focus remains on expanding AI infrastructure and autonomous vehicle technologies, reinforcing its competitive edge in high-performance computing.
Skyworks Solutions, Inc.: Specialist in Analog Semiconductors
Skyworks Solutions excels in designing and manufacturing proprietary analog semiconductor components used across wireless and broadband markets. The company generates revenue through products like amplifiers, filters, and front-end modules. In 2026, Skyworks targets growth in connected home and automotive sectors, leveraging its broad portfolio to capture increasing demand in wireless connectivity.
Strategic Collision: Similarities & Divergences
NVIDIA pursues a closed ecosystem with integrated software and hardware, while Skyworks adopts an open, component-focused approach. They primarily compete in mobile and automotive semiconductor markets. NVIDIA’s scale and AI prowess contrast with Skyworks’ niche analog expertise, creating distinctly different investment profiles rooted in growth potential versus steady connectivity demand.
Income Statement Comparison
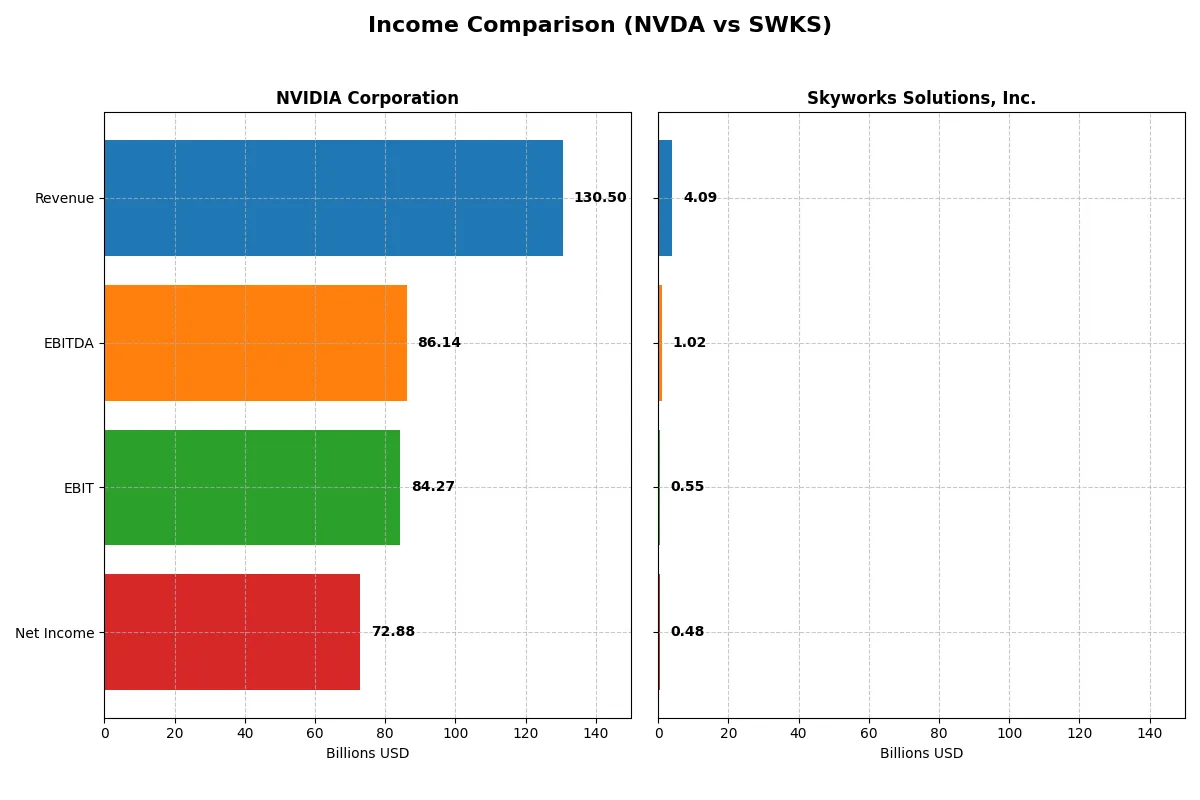
This data dissects the core profitability and scalability of both corporate engines to reveal who dominates the bottom line:
| Metric | NVIDIA Corporation (NVDA) | Skyworks Solutions, Inc. (SWKS) |
|---|---|---|
| Revenue | 130.5B | 4.1B |
| Cost of Revenue | 32.6B | 2.4B |
| Operating Expenses | 16.4B | 1.2B |
| Gross Profit | 97.9B | 1.7B |
| EBITDA | 86.1B | 1.0B |
| EBIT | 84.3B | 554M |
| Interest Expense | 247M | 27M |
| Net Income | 72.9B | 477M |
| EPS | 2.97 | 3.09 |
| Fiscal Year | 2025 | 2025 |
Income Statement Analysis: The Bottom-Line Duel
The income statement comparison reveals which company drives profitability and operational efficiency more effectively in their respective markets.
NVIDIA Corporation Analysis
NVIDIA’s revenue surged from $16.7B in 2021 to $130.5B in 2025, reflecting extraordinary growth. Net income followed suit, soaring from $4.3B to $72.9B. The gross margin held strong near 75%, while net margin expanded to nearly 56%, showcasing exceptional cost control and operating leverage. The latest fiscal year confirms NVIDIA’s momentum and operational prowess.
Skyworks Solutions, Inc. Analysis
Skyworks’ revenue declined from $5.1B in 2021 to $4.1B in 2025, marking a steady contraction. Net income also fell sharply from $1.5B to $477M. Despite a stable gross margin around 41%, net margin shrank to 11.7%, indicating margin pressure. The latest year shows weakening top-line and bottom-line trends, reflecting operational and market challenges.
Growth Juggernaut vs. Margin Compression
NVIDIA dominates with explosive revenue and net income growth, maintaining robust margins above sector averages. Skyworks faces declining sales and shrinking profits, despite decent gross margins. For investors, NVIDIA’s profile embodies high growth and operational efficiency, while Skyworks presents risks from margin erosion and stagnant revenue.
Financial Ratios Comparison
These vital ratios act as a diagnostic tool to expose the underlying fiscal health, valuation premiums, and capital efficiency of these companies:
| Ratios | NVIDIA Corporation (NVDA) | Skyworks Solutions, Inc. (SWKS) |
|---|---|---|
| ROE | 91.9% | 8.3% |
| ROIC | 75.3% | 6.4% |
| P/E | 39.9 | 24.9 |
| P/B | 36.7 | 2.1 |
| Current Ratio | 4.44 | 2.33 |
| Quick Ratio | 3.88 | 1.76 |
| D/E (Debt-to-Equity) | 0.13 | 0.21 |
| Debt-to-Assets | 9.2% | 15.2% |
| Interest Coverage | 330 | 18.5 |
| Asset Turnover | 1.17 | 0.52 |
| Fixed Asset Turnover | 16.2 | 2.95 |
| Payout Ratio | 1.1% | 90.7% |
| Dividend Yield | 0.03% | 3.63% |
| Fiscal Year | 2025 | 2025 |
Efficiency & Valuation Duel: The Vital Signs
Financial ratios act as the company’s DNA, revealing hidden risks and operational excellence behind headline figures.
NVIDIA Corporation
NVIDIA delivers outstanding profitability with a 91.9% ROE and a strong 55.9% net margin, showcasing operational efficiency. However, its valuation is stretched, with a high P/E of 39.9 and P/B of 36.7, signaling premium pricing. Shareholders see minimal dividends (0.03%), indicating capital reinvestment focused on aggressive R&D and growth.
Skyworks Solutions, Inc.
Skyworks posts modest profitability, with an 8.3% ROE and 11.7% net margin, illustrating steady but unspectacular returns. Its valuation is more reasonable, with a P/E of 24.9 and P/B of 2.07, reflecting market caution. The company offers a healthy 3.63% dividend yield, balancing shareholder returns with consistent cash flow.
Premium Valuation vs. Balanced Yield
NVIDIA commands a premium for exceptional returns but carries valuation risk. Skyworks offers a safer valuation with steady dividends but lower profitability. Investors seeking growth may prefer NVIDIA’s innovation profile, while income-focused investors may favor Skyworks’ reliable yield.
Which one offers the Superior Shareholder Reward?
I compare NVIDIA’s modest 0.03% dividend yield and 1.1% payout ratio with Skyworks’ robust 3.6% yield and 91% payout ratio. NVIDIA favors aggressive buybacks fueling growth, while Skyworks delivers high current income but with a less intense buyback program. I see NVIDIA’s low payout and strong free cash flow support sustainable buybacks, enhancing total returns long term. Skyworks’ yield is attractive but risks payout cuts if free cash flow weakens. For 2026, I conclude NVIDIA offers the superior total shareholder reward through balanced distributions and growth reinvestment.
Comparative Score Analysis: The Strategic Profile
The radar chart reveals the fundamental DNA and trade-offs of NVIDIA Corporation and Skyworks Solutions, Inc., highlighting their distinct financial strengths and valuation profiles:
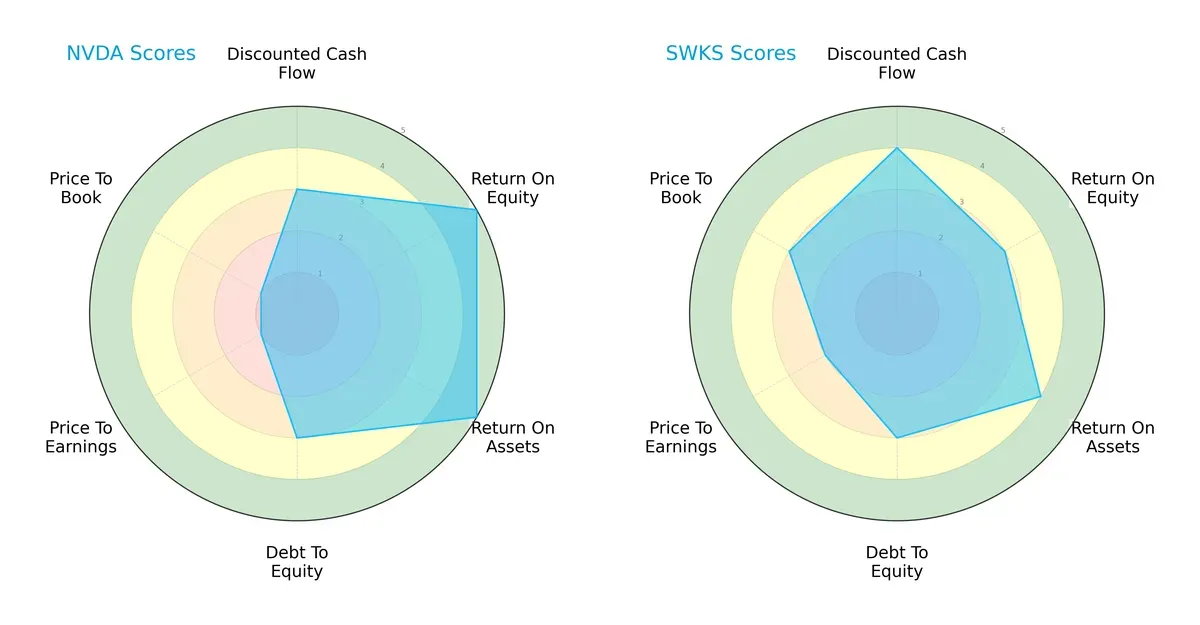
NVIDIA excels in profitability with top ROE and ROA scores (5 each), reflecting superior capital efficiency. Skyworks delivers a more balanced profile, scoring higher on discounted cash flow (4) and valuation metrics (PE at 2, PB at 3), suggesting better relative valuation and future cash flow expectations. Both share moderate debt-to-equity scores (3), but NVIDIA’s valuation appears stretched with low PE and PB scores (1 each), indicating potential overvaluation risk. I see NVIDIA as a profit powerhouse relying on operational excellence, while Skyworks offers a steadier, value-oriented proposition.
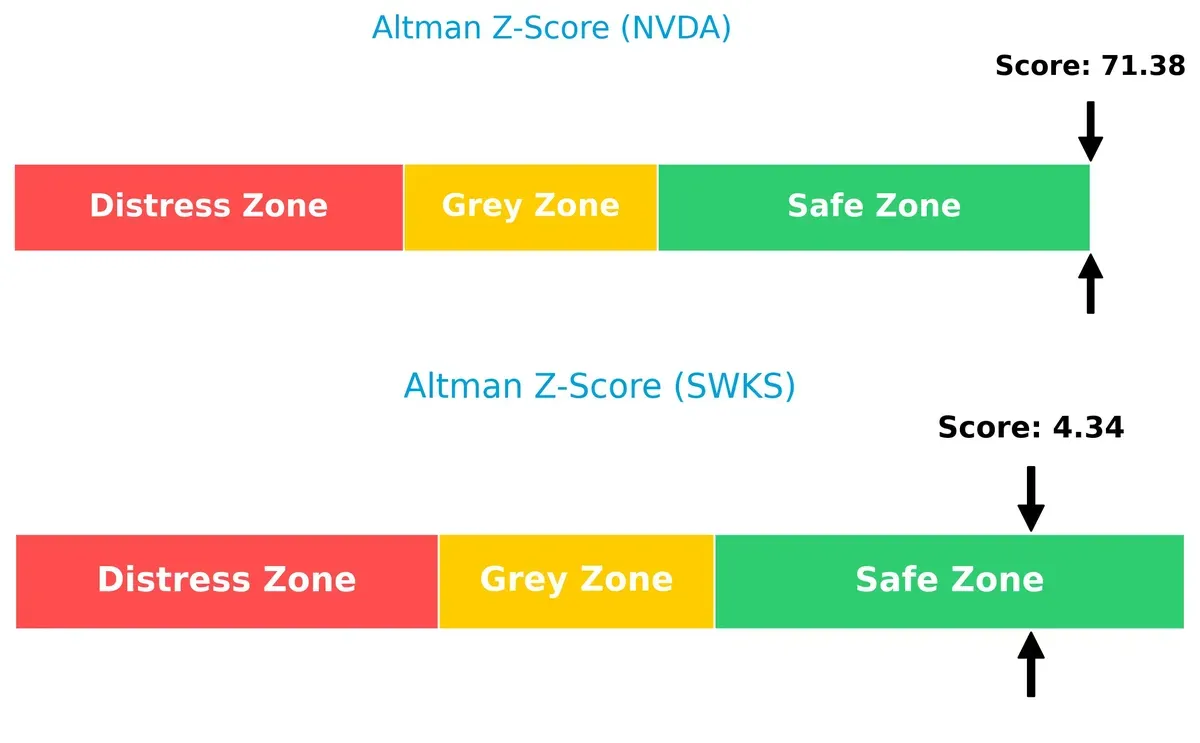
Bankruptcy Risk: Solvency Showdown
The Altman Z-Score gap strongly favors NVIDIA’s robust solvency with a score of 71.4 versus Skyworks’ 4.3, both in the safe zone but highlighting NVIDIA’s exceptional financial stability in this cycle:
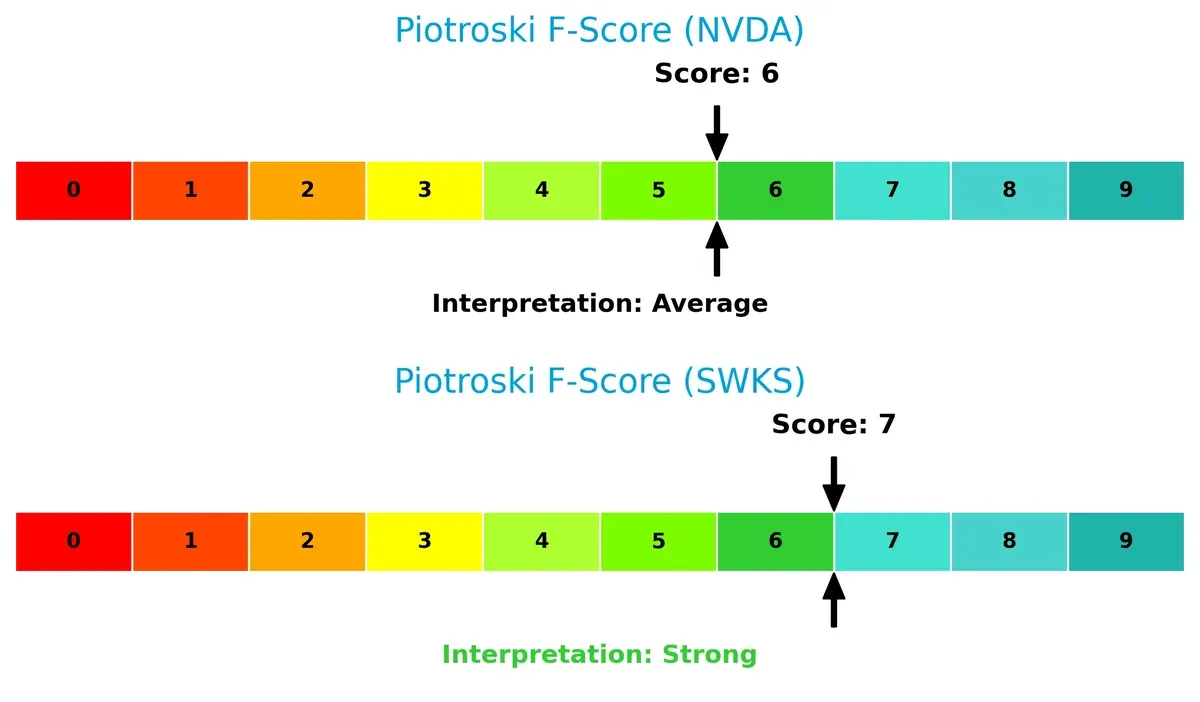
Financial Health: Quality of Operations
Skyworks leads with a Piotroski F-Score of 7, signaling strong internal financial health compared to NVIDIA’s average score of 6, which suggests some room for operational improvement or risk:
How are the two companies positioned?
This section dissects NVDA and SWKS’s operational DNA by comparing revenue distribution and internal dynamics, including strengths and weaknesses. The goal is to confront their economic moats to identify which model offers the most resilient, sustainable advantage today.
Revenue Segmentation: The Strategic Mix
This visual comparison dissects how NVIDIA Corporation and Skyworks Solutions diversify their income streams and where their primary sector bets lie:
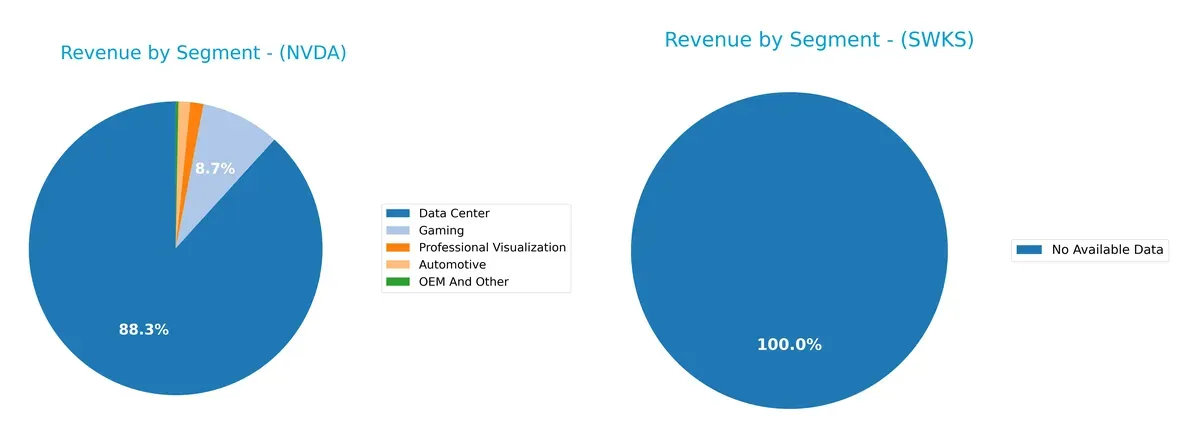
NVIDIA’s revenue pivots heavily on Data Center at $115B, dwarfing its other segments like Gaming at $11.35B and Automotive at $1.69B. This concentration signals a strategic dominance in infrastructure and AI ecosystems. Skyworks Solutions lacks available segmentation data, preventing a direct diversification comparison. NVIDIA’s reliance on one dominant segment carries concentration risk but also showcases strong moat potential through ecosystem lock-in.
Strengths and Weaknesses Comparison
This table compares the Strengths and Weaknesses of NVIDIA Corporation and Skyworks Solutions, Inc.:
NVIDIA Corporation Strengths
- Highly diversified revenue across Data Center, Gaming, Automotive, and Visualization
- Strong profitability with 55.85% net margin and 91.87% ROE
- Favorable leverage and liquidity ratios
- Significant global presence with large US and Asia revenues
- Exceptional asset turnover metrics
Skyworks Solutions, Inc. Strengths
- Favorable current and quick ratios indicating solid liquidity
- Moderate profitability with 11.67% net margin
- Balanced debt levels with favorable interest coverage
- Strong dividend yield of 3.63%
- Global footprint including US, China, and Asia markets
NVIDIA Corporation Weaknesses
- Unfavorable high P/E and P/B ratios suggesting valuation premium
- Elevated WACC at 14.73% compared to ROIC
- Low dividend yield at 0.03%
- High current ratio possibly indicating inefficient asset use
Skyworks Solutions, Inc. Weaknesses
- Low ROE at 8.29% and neutral ROIC at 6.35% reflecting weaker profitability
- Neutral valuation multiples (P/E 24.95, P/B 2.07)
- Moderate asset turnover ratios
- Smaller revenue scale and less diversification compared to NVDA
NVIDIA’s strengths lie in its robust profitability, diversified product segments, and strong global presence, though valuation and capital costs raise caution. Skyworks offers solid liquidity and dividend income but faces challenges in profitability and scale. Both companies reflect distinct strategic focuses affecting their financial profiles.
The Moat Duel: Analyzing Competitive Defensibility
A structural moat is the only shield protecting long-term profits from relentless competition erosion. Let’s dissect the moats of two semiconductor players:
NVIDIA Corporation: Dominant Network Effects and Innovation Powerhouse
NVIDIA’s moat stems from powerful network effects and cutting-edge AI innovation, reflected in a stellar ROIC 60% above WACC. Margin stability and 114% revenue growth in 2025 signal a deepening moat amid expansion in AI and data centers.
Skyworks Solutions, Inc.: Narrow Cost Advantage Under Pressure
Skyworks relies on cost advantages in analog semiconductors but faces a shrinking moat with ROIC below WACC and declining margins. Its 2% revenue drop in 2025 highlights intensifying competition and limited innovation-driven growth, threatening its position.
Moat Strength Showdown: Innovation Ecosystem vs. Cost Efficiency
NVIDIA commands a wider, more durable moat, driven by innovation and network effects, while Skyworks’s cost advantage is eroding. NVIDIA is far better equipped to defend and grow its market share in 2026 and beyond.
Which stock offers better returns?
The past year reveals starkly divergent trajectories. NVIDIA’s shares more than doubled, showing strong gains despite recent deceleration. Skyworks plunged sharply, with accelerating losses and seller dominance in recent trades.
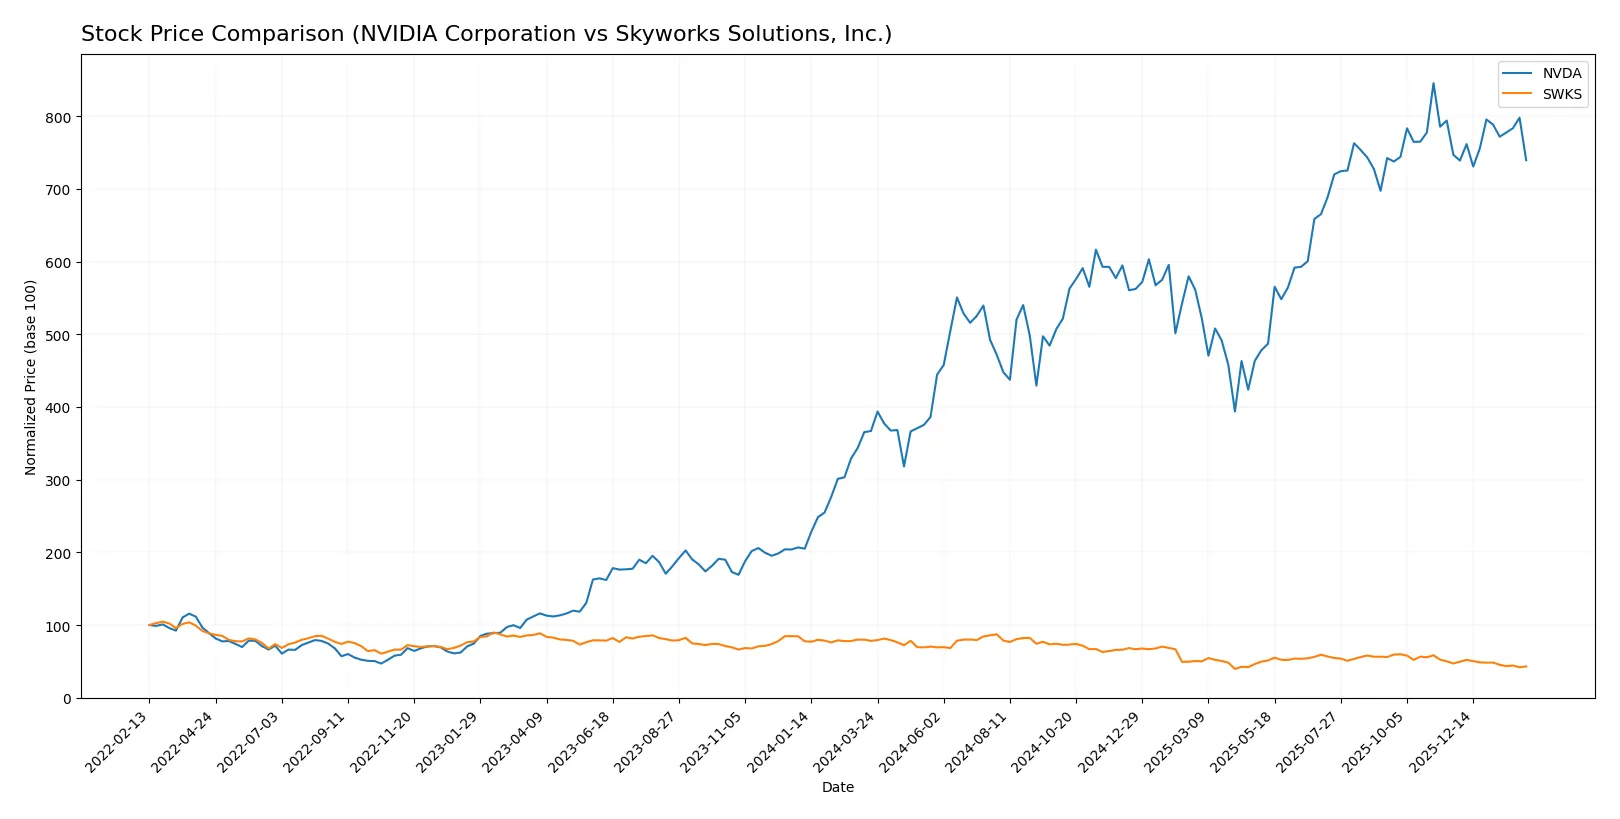
Trend Comparison
NVIDIA’s stock soared 101.66% over the past 12 months, marking a bullish trend with decelerating momentum. The price ranged from a low of 76.2 to a high of 202.49, exhibiting high volatility (32.09 std deviation).
Skyworks’ stock declined 44.99% in the same period, reflecting a bearish trend with decelerating losses. Its price fluctuated between 52.78 and 116.18, showing moderate volatility (16.51 std deviation).
NVIDIA outperformed Skyworks clearly, delivering the highest market return with sustained gains, while Skyworks faced persistent selling pressure and significant value erosion.
Target Prices
Analysts maintain a broad but optimistic target consensus for these semiconductor leaders.
| Company | Target Low | Target High | Consensus |
|---|---|---|---|
| NVIDIA Corporation | 140 | 352 | 265.21 |
| Skyworks Solutions, Inc. | 58 | 140 | 77.36 |
NVIDIA’s consensus target stands roughly 50% above its current 177.46 price, signaling strong growth expectations. Skyworks’ consensus target is notably above its 58.18 price, suggesting upside potential despite recent volatility.

Don’t Let Luck Decide Your Entry Point
Optimize your entry points with our advanced ProRealTime indicators. You’ll get efficient buy signals with precise price targets for maximum performance. Start outperforming now!
How do institutions grade them?
Here are the latest institutional grades for NVIDIA Corporation and Skyworks Solutions, Inc.:
NVIDIA Corporation Grades
This table summarizes recent grades from major financial institutions for NVIDIA Corporation.
| Grading Company | Action | New Grade | Date |
|---|---|---|---|
| Jefferies | Maintain | Buy | 2026-01-16 |
| Mizuho | Maintain | Outperform | 2026-01-09 |
| Truist Securities | Maintain | Buy | 2025-12-29 |
| Stifel | Maintain | Buy | 2025-12-29 |
| Baird | Maintain | Outperform | 2025-12-26 |
| Bernstein | Maintain | Outperform | 2025-12-26 |
| B of A Securities | Maintain | Buy | 2025-12-26 |
| Truist Securities | Maintain | Buy | 2025-12-19 |
| Tigress Financial | Maintain | Strong Buy | 2025-12-18 |
| Morgan Stanley | Maintain | Overweight | 2025-12-01 |
Skyworks Solutions, Inc. Grades
This table shows recent institutional grades for Skyworks Solutions, Inc.
| Grading Company | Action | New Grade | Date |
|---|---|---|---|
| Benchmark | Maintain | Hold | 2026-02-04 |
| Morgan Stanley | Maintain | Equal Weight | 2026-02-02 |
| B. Riley Securities | Maintain | Neutral | 2026-01-26 |
| Mizuho | Maintain | Neutral | 2026-01-26 |
| Susquehanna | Maintain | Neutral | 2026-01-22 |
| UBS | Maintain | Neutral | 2026-01-20 |
| Mizuho | Upgrade | Neutral | 2025-11-11 |
| JP Morgan | Maintain | Neutral | 2025-11-05 |
| UBS | Maintain | Neutral | 2025-11-05 |
| UBS | Maintain | Neutral | 2025-10-29 |
Which company has the best grades?
NVIDIA consistently receives strong Buy and Outperform ratings, indicating robust analyst confidence. Skyworks holds mostly Neutral and Hold grades, reflecting more cautious sentiment. This divergence may influence investor perception and portfolio allocation decisions.
Risks specific to each company
In the volatile 2026 market environment, these categories expose critical pressure points and systemic threats facing NVIDIA Corporation and Skyworks Solutions, Inc.:
1. Market & Competition
NVIDIA Corporation
- Dominates high-performance GPUs and AI data centers but faces fierce innovation cycles and chip supply constraints.
Skyworks Solutions, Inc.
- Competes in analog and mixed-signal semiconductors with niche focus but faces intense pricing pressure and market fragmentation.
2. Capital Structure & Debt
NVIDIA Corporation
- Low debt-to-equity (0.13), strong interest coverage (341x) minimizes financial risk despite high WACC (14.7%).
Skyworks Solutions, Inc.
- Slightly higher leverage (0.21 D/E) but solid interest coverage (20x), reflecting prudent financial management.
3. Stock Volatility
NVIDIA Corporation
- High beta (2.31) signals elevated stock price swings, increasing investor risk during market downturns.
Skyworks Solutions, Inc.
- Lower beta (1.32) implies more stable share price performance relative to the tech sector.
4. Regulatory & Legal
NVIDIA Corporation
- Faces scrutiny over AI technology exports and antitrust concerns amid growing geopolitical tensions.
Skyworks Solutions, Inc.
- Exposed to global regulatory regimes but less impacted by high-profile trade restrictions or antitrust probes.
5. Supply Chain & Operations
NVIDIA Corporation
- Relies on complex supply chains in Taiwan and China, vulnerable to geopolitical disruptions and component shortages.
Skyworks Solutions, Inc.
- Diversified manufacturing footprint reduces single-region dependency but faces raw material price volatility.
6. ESG & Climate Transition
NVIDIA Corporation
- Increasing pressure to reduce carbon footprint across data centers and manufacturing; ESG initiatives still evolving.
Skyworks Solutions, Inc.
- More advanced in ESG disclosures and sustainability efforts, potentially better aligned with investor expectations.
7. Geopolitical Exposure
NVIDIA Corporation
- Substantial exposure to US-China tensions impacting sales, supply chain, and R&D collaborations.
Skyworks Solutions, Inc.
- Operates globally with moderate exposure; geopolitical risks mitigated by diversified customer base.
Which company shows a better risk-adjusted profile?
NVIDIA’s biggest risk lies in high stock volatility and geopolitical tensions affecting supply chains and exports. Skyworks’s chief concern is pricing pressure in a fragmented market. Skyworks’s lower beta and diversified operations yield a superior risk-adjusted profile. Notably, NVIDIA’s beta at 2.31 sharply contrasts with Skyworks’s 1.32, underscoring greater investor risk in NVIDIA’s shares.
Final Verdict: Which stock to choose?
NVIDIA’s superpower lies in its ability to generate outsized returns on invested capital, reflecting a durable competitive edge in high-performance computing. Its premium valuation signals lofty expectations, making it a point of vigilance for risk-sensitive investors. NVIDIA fits portfolios with an appetite for aggressive growth and innovation leadership.
Skyworks Solutions offers a strategic moat through steady recurring revenue and robust free cash flow yield, appealing to those valuing income and balance sheet stability. Its valuation is more moderate, providing a buffer against volatility. Skyworks suits investors focused on GARP—growth at a reasonable price—seeking a blend of stability and modest expansion.
If you prioritize breakthrough innovation and dominant market share, NVIDIA is the compelling choice due to its superior value creation and accelerating revenue growth. However, if you seek a more defensive stance with reliable free cash flow and less valuation risk, Skyworks offers better stability and income potential. Both present distinct profiles but require careful alignment with your risk tolerance.
Disclaimer: Investment carries a risk of loss of initial capital. The past performance is not a reliable indicator of future results. Be sure to understand risks before making an investment decision.
Go Further
I encourage you to read the complete analyses of NVIDIA Corporation and Skyworks Solutions, Inc. to enhance your investment decisions: