NVIDIA Corporation and SkyWater Technology, Inc. are two key players in the semiconductor industry, each carving out distinct niches with innovative approaches. NVIDIA leads with advanced graphics and AI computing solutions, while SkyWater specializes in customized semiconductor manufacturing services. Their shared focus on cutting-edge technology and market overlap makes this comparison particularly relevant. In this article, I will help you determine which company offers the most compelling investment opportunity in 2026.

Table of contents
Companies Overview
I will begin the comparison between NVIDIA and SkyWater Technology by providing an overview of these two companies and their main differences.
NVIDIA Overview
NVIDIA Corporation focuses on providing graphics, compute, and networking solutions globally. Its products include GeForce GPUs for gaming, Quadro/NVIDIA RTX for professional workstations, and automotive platforms for infotainment and autonomous driving. Operating since 1993 and headquartered in Santa Clara, California, NVIDIA serves diverse markets such as gaming, data centers, and automotive with its advanced semiconductor technologies.
SkyWater Technology Overview
SkyWater Technology, founded in 2017 and based in Bloomington, Minnesota, offers semiconductor development and manufacturing services. It supports engineering and process development for silicon-based analog, mixed-signal, power discrete, and rad-hard integrated circuits. SkyWater serves industries including aerospace, automotive, bio-health, and industrial IoT, emphasizing customized semiconductor solutions and collaborative technology development with its clients.
Key similarities and differences
Both companies operate in the semiconductor industry and trade on NASDAQ, but they differ in scale and focus. NVIDIA is a large, diversified technology leader with a market cap exceeding 4.4T and a broad product portfolio spanning gaming to AI. SkyWater is smaller, with a market cap around 1.5B, focusing on semiconductor manufacturing services and engineering support. While NVIDIA targets end markets with finished products, SkyWater primarily offers manufacturing and development services.
Income Statement Comparison
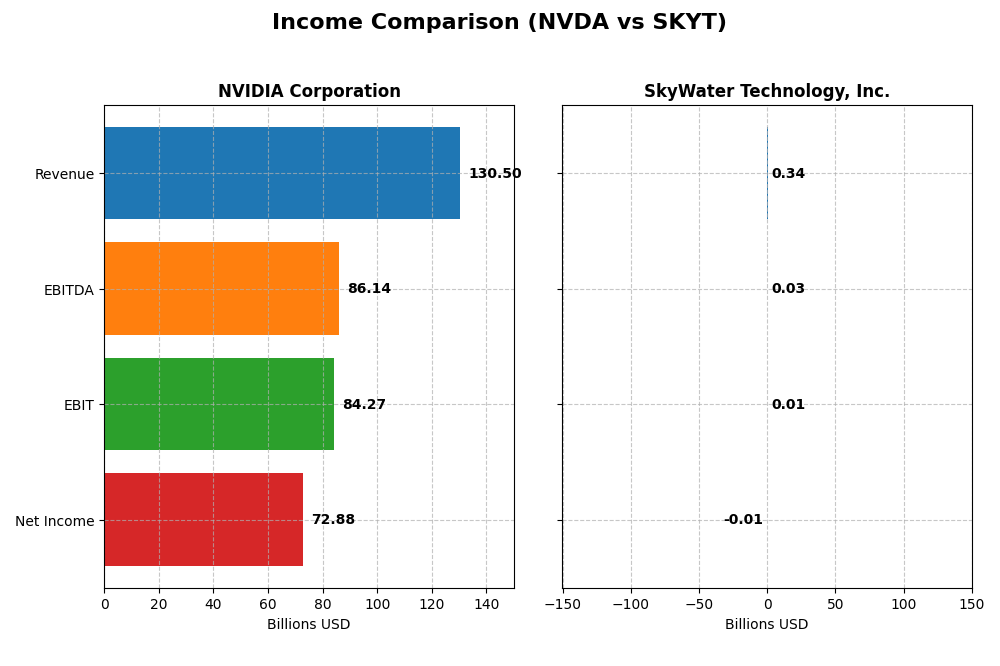
The table below presents a side-by-side comparison of key income statement metrics for NVIDIA Corporation and SkyWater Technology, Inc. for their respective most recent fiscal years.
| Metric | NVIDIA Corporation | SkyWater Technology, Inc. |
|---|---|---|
| Market Cap | 4.46T | 1.46B |
| Revenue | 130.5B | 342.3M |
| EBITDA | 86.1B | 25.3M |
| EBIT | 84.3B | 6.6M |
| Net Income | 72.9B | -6.8M |
| EPS | 2.97 | -0.14 |
| Fiscal Year | 2025 | 2024 |
Income Statement Interpretations
NVIDIA Corporation
NVIDIA exhibited a remarkable upward trend from 2021 to 2025, with revenue soaring from $16.7B to $130.5B and net income climbing from $4.3B to $72.9B. Margins remained robust, with a gross margin near 75% and a net margin above 55%. The 2025 fiscal year showed exceptional growth, with revenue more than doubling and margins improving, reflecting strong operational efficiency.
SkyWater Technology, Inc.
SkyWater’s revenue increased steadily from $140M in 2020 to $342M in 2024, while net income remained negative but improved from a loss of $20.6M to $6.8M loss. Gross margins held steady around 20%, but net margins stayed unfavorable. The latest year showed positive momentum with a nearly 20% revenue increase and significant margin improvements, though profitability remains elusive.
Which one has the stronger fundamentals?
NVIDIA demonstrates far stronger fundamentals with substantial revenue and net income growth, high margins, and consistent profitability. SkyWater, despite growth and margin improvements, continues to report net losses and weaker profitability metrics. While both show favorable revenue trends, NVIDIA’s financial health and operational efficiency position it with superior income statement fundamentals.
Financial Ratios Comparison
The table below presents a side-by-side comparison of key financial ratios for NVIDIA Corporation and SkyWater Technology, Inc., based on their most recent fiscal year data.
| Ratios | NVIDIA Corporation (2025) | SkyWater Technology, Inc. (2024) |
|---|---|---|
| ROE | 91.9% | -11.8% |
| ROIC | 75.3% | 3.4% |
| P/E | 39.9 | -100.3 |
| P/B | 36.7 | 11.8 |
| Current Ratio | 4.44 | 0.86 |
| Quick Ratio | 3.88 | 0.76 |
| D/E | 0.13 | 1.33 |
| Debt-to-Assets | 9.2% | 24.5% |
| Interest Coverage | 330.0 | 0.74 |
| Asset Turnover | 1.17 | 1.09 |
| Fixed Asset Turnover | 16.16 | 2.07 |
| Payout ratio | 1.14% | 0% |
| Dividend yield | 0.029% | 0% |
Interpretation of the Ratios
NVIDIA Corporation
NVIDIA displays mostly strong financial ratios, including a very high return on equity (91.87%) and return on invested capital (75.28%), indicating efficient capital use. However, its elevated price-to-earnings (PE) ratio of 39.9 and price-to-book (PB) ratio of 36.66 suggest a premium valuation which may concern some investors. The company pays a modest dividend with a low yield of 0.03%, supported by solid free cash flow coverage, indicating sustainable but minimal shareholder returns.
SkyWater Technology, Inc.
SkyWater’s financial ratios are largely weak, with negative net margin (-1.98%) and return on equity (-11.79%), reflecting ongoing losses and limited profitability. Its current and quick ratios below 1 reveal liquidity challenges, while a high debt-to-equity ratio of 1.33 signals elevated financial risk. The company does not pay dividends, likely due to its negative earnings and focus on reinvestment and growth in its semiconductor manufacturing services.
Which one has the best ratios?
Between the two, NVIDIA shows a significantly more favorable ratio profile with strong profitability and capital efficiency metrics, despite some valuation concerns. SkyWater struggles with negative profitability, liquidity, and leverage issues, reflected in its mostly unfavorable ratios. Thus, NVIDIA’s financial ratios are substantially stronger compared to SkyWater’s weaker and riskier position.
Strategic Positioning
This section compares the strategic positioning of NVIDIA Corporation and SkyWater Technology, including Market position, Key segments, and disruption:
NVIDIA Corporation
- Leading semiconductor firm with significant competitive scale and global presence.
- Diverse segments: Data Center, Gaming, Automotive, Visualization driving growth.
- Invests heavily in AI, HPC, autonomous driving, gaming platforms, and cloud computing.
SkyWater Technology, Inc.
- Smaller market cap with niche focus, facing higher competitive pressure.
- Concentrated on semiconductor development and wafer manufacturing services.
- Provides engineering and manufacturing services, limited direct product disruption.
NVIDIA Corporation vs SkyWater Technology, Inc. Positioning
NVIDIA pursues a diversified strategy across multiple high-growth tech segments, leveraging scale and innovation, while SkyWater concentrates on specialized semiconductor services, emphasizing customer co-creation and manufacturing. NVIDIA’s approach offers broader market exposure; SkyWater targets niche industrial sectors.
Which has the best competitive advantage?
NVIDIA shows a very favorable economic moat with strong ROIC exceeding WACC and growing profitability, indicating durable competitive advantage. SkyWater’s slightly unfavorable moat reflects value destruction despite improving profitability, suggesting weaker competitive positioning.
Stock Comparison
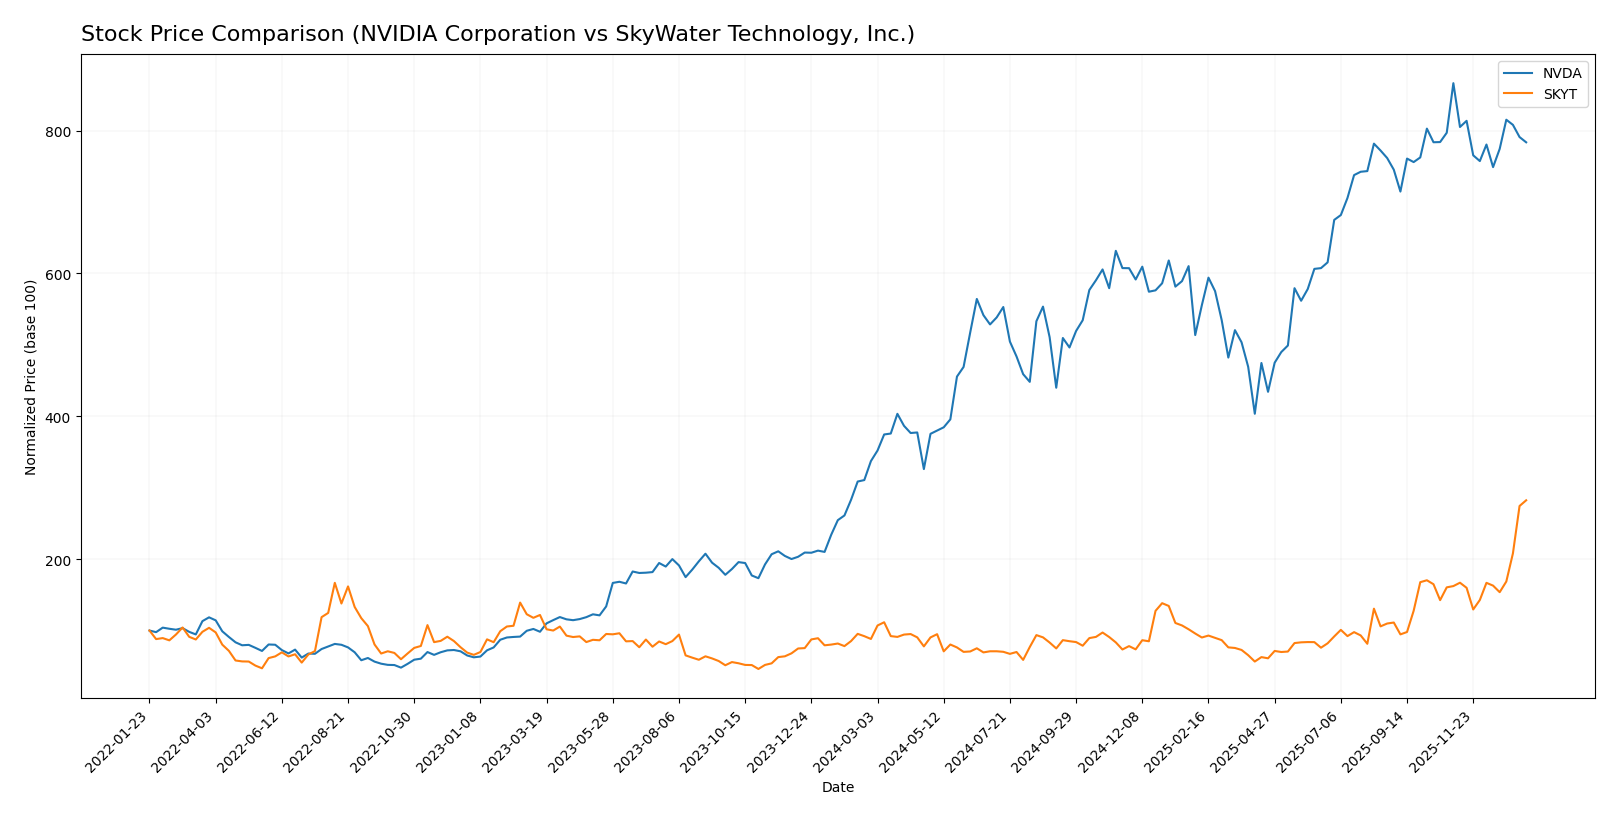
The past year has seen significant price appreciation for both NVIDIA Corporation and SkyWater Technology, Inc., with NVIDIA showing strong growth but recent deceleration, while SkyWater demonstrates accelerated gains and increasing buyer dominance.
Trend Analysis
NVIDIA Corporation’s stock price rose by 132.35% over the past 12 months, indicating a bullish trend with decelerating momentum and a high volatility level reflected by a 32.46 std deviation. The price peaked at 202.49 and troughed at 76.2.
SkyWater Technology, Inc. experienced a 220.08% increase over the same period, a bullish trend with accelerating momentum and lower volatility (4.34 std deviation). The stock reached a high of 30.44 and a low of 6.1, with recent strong gains at 74.04%.
Comparing the two, SkyWater Technology delivered the highest market performance, outperforming NVIDIA with stronger acceleration and buyer dominance in recent trading months.
Target Prices
Analysts present a clear target price consensus for NVIDIA Corporation and SkyWater Technology, Inc.
| Company | Target High | Target Low | Consensus |
|---|---|---|---|
| NVIDIA Corporation | 352 | 140 | 264.34 |
| SkyWater Technology, Inc. | 25 | 25 | 25 |
For NVIDIA, the consensus target price of 264.34 USD suggests significant upside potential compared to its current price of 183.14 USD. SkyWater Technology’s target consensus at 25 USD is below its current price of 30.44 USD, indicating a more cautious outlook from analysts.
Analyst Opinions Comparison
This section compares analysts’ ratings and grades for NVIDIA Corporation and SkyWater Technology, Inc.:
Rating Comparison
NVDA Rating
- Rating: B+ with a very favorable overall evaluation.
- Discounted Cash Flow Score: Moderate at 3, indicating balanced valuation expectations.
- ROE Score: Very favorable at 5, showing strong profit generation from equity.
- ROA Score: Very favorable at 5, reflecting excellent asset utilization.
- Debt To Equity Score: Moderate at 3, implying moderate financial risk from leverage.
- Overall Score: Moderate at 3, summarizing a balanced but cautious investment profile.
SKYT Rating
- Rating: B+ with a very favorable overall evaluation.
- Discounted Cash Flow Score: Very unfavorable at 1, suggesting potential overvaluation concerns.
- ROE Score: Very favorable at 5, indicating efficient profit generation from equity.
- ROA Score: Very favorable at 5, demonstrating effective use of assets to generate earnings.
- Debt To Equity Score: Very unfavorable at 1, indicating higher financial risk due to debt levels.
- Overall Score: Moderate at 3, reflecting a cautious investment stance despite some weaknesses.
Which one is the best rated?
Both companies share the same B+ rating and a moderate overall score of 3. NVDA shows stronger financial stability with better discounted cash flow and debt-to-equity scores, while SKYT faces higher financial risk despite equally strong profitability metrics.
Scores Comparison
The scores comparison between NVIDIA and SkyWater Technology highlights their financial health indicators:
NVIDIA Scores
- Altman Z-Score: 68.04, indicating a safe zone status.
- Piotroski Score: 6, reflecting average financial strength.
SkyWater Technology Scores
- Altman Z-Score: 1.63, indicating a distress zone.
- Piotroski Score: 5, reflecting average financial strength.
Which company has the best scores?
Based on the provided data, NVIDIA has a significantly higher Altman Z-Score, placing it in the safe zone, whereas SkyWater is in the distress zone. Both companies have similar average Piotroski Scores, but NVIDIA’s overall scores suggest stronger financial stability.
Grades Comparison
Here is a comparison of the recent grades assigned to NVIDIA Corporation and SkyWater Technology, Inc.:
NVIDIA Corporation Grades
The table below summarizes recent grades from reputable grading companies for NVIDIA Corporation.
| Grading Company | Action | New Grade | Date |
|---|---|---|---|
| Mizuho | Maintain | Outperform | 2026-01-09 |
| Truist Securities | Maintain | Buy | 2025-12-29 |
| Stifel | Maintain | Buy | 2025-12-29 |
| B of A Securities | Maintain | Buy | 2025-12-26 |
| Baird | Maintain | Outperform | 2025-12-26 |
| Bernstein | Maintain | Outperform | 2025-12-26 |
| Truist Securities | Maintain | Buy | 2025-12-19 |
| Tigress Financial | Maintain | Strong Buy | 2025-12-18 |
| Morgan Stanley | Maintain | Overweight | 2025-12-01 |
| Deutsche Bank | Maintain | Hold | 2025-11-20 |
NVIDIA’s grades consistently show a strong buy and outperform consensus with most firms maintaining positive ratings.
SkyWater Technology, Inc. Grades
The table below summarizes recent grades from reputable grading companies for SkyWater Technology, Inc.
| Grading Company | Action | New Grade | Date |
|---|---|---|---|
| Needham | Maintain | Buy | 2025-11-06 |
| Piper Sandler | Maintain | Overweight | 2025-11-06 |
| TD Cowen | Maintain | Buy | 2025-11-06 |
| Needham | Maintain | Buy | 2025-08-07 |
| Needham | Maintain | Buy | 2025-05-08 |
| Needham | Maintain | Buy | 2025-02-27 |
| Needham | Maintain | Buy | 2024-11-11 |
| Piper Sandler | Maintain | Overweight | 2024-10-25 |
| Piper Sandler | Maintain | Overweight | 2024-08-08 |
| Needham | Maintain | Buy | 2024-05-09 |
SkyWater Technology holds a consistent buy and overweight consensus, with no downgrades reported.
Which company has the best grades?
NVIDIA Corporation has received a broader and stronger set of positive grades, including multiple outperform and strong buy ratings, compared to SkyWater’s consistent buy and overweight ratings. This suggests a stronger analyst conviction for NVIDIA’s growth potential, which may influence investor confidence differently for each stock.
Strengths and Weaknesses
Below is a comparative summary of key strengths and weaknesses for NVIDIA Corporation and SkyWater Technology, Inc., based on their recent financial and operational data.
| Criterion | NVIDIA Corporation (NVDA) | SkyWater Technology, Inc. (SKYT) |
|---|---|---|
| Diversification | Highly diversified with strong Data Center and Gaming segments generating over $115B and $11.35B respectively in 2025. | Limited diversification; revenue mainly from Advanced Technology Services and Wafer Services totaling around $156M in 2024. |
| Profitability | Very high profitability with net margin at 55.85% and ROIC at 75.28% in 2025. | Negative net margin (-1.98%) and low ROIC (3.4%) indicate ongoing losses in 2024. |
| Innovation | Leading in innovation, evidenced by a very favorable economic moat and strong ROIC growth (339% trend). | Improving profitability trend but overall value destroying with negative ROIC vs WACC and slight unfavorable moat status. |
| Global presence | Strong global footprint supported by large-scale data center and automotive markets. | More niche, smaller scale operations with less global reach. |
| Market Share | Dominant player in GPU and AI data center markets with expanding segments. | Smaller market share in semiconductor manufacturing services, focused on wafer fabrication. |
Key takeaways: NVIDIA shows robust diversification, exceptional profitability, and a durable competitive advantage, making it a strong candidate for investment. SkyWater, while showing improving profitability trends, remains a higher-risk option due to ongoing losses and a narrower market focus.
Risk Analysis
Below is a comparative table summarizing key risks for NVIDIA Corporation (NVDA) and SkyWater Technology, Inc. (SKYT) based on the latest available data for 2025 and 2024 respectively:
| Metric | NVIDIA Corporation (NVDA) | SkyWater Technology, Inc. (SKYT) |
|---|---|---|
| Market Risk | Beta 2.31, high volatility in tech sector | Beta 3.49, higher volatility, small-cap exposure |
| Debt Level | Low debt-to-equity 0.13, debt/assets 9.2% | High debt-to-equity 1.33, moderate debt/assets 24.5% |
| Regulatory Risk | Moderate, operates globally with compliance requirements | Moderate, focused on US semiconductor manufacturing |
| Operational Risk | Diversified product lines, strong operational metrics | Smaller scale, reliant on manufacturing contracts |
| Environmental Risk | Growing focus on sustainability, moderate impact | Moderate, industrial manufacturing footprint |
| Geopolitical Risk | Exposure to Taiwan, China markets | Mainly US-based, less geopolitical exposure |
In synthesis, NVIDIA’s most significant risks stem from high market volatility and geopolitical exposure, especially relating to Taiwan and China. SkyWater faces higher financial risk due to elevated debt and operational dependence on specific contracts, compounded by greater market volatility given its smaller size. Investors should weigh NVIDIA’s strong financials against geopolitical and valuation risks, while SkyWater’s distress-zone Altman Z-score signals higher bankruptcy risk despite a moderate Piotroski score.
Which Stock to Choose?
NVIDIA Corporation (NVDA) shows a strong income evolution with a 114.2% revenue growth in one year and a 682.6% increase over five years. Its profitability is robust, supported by a 55.85% net margin and a very favorable return on equity of 91.87%. The company maintains low debt levels with a net debt to EBITDA ratio near 0.02, and its financial ratios are globally favorable, complemented by a very favorable moat rating indicating durable competitive advantage.
SkyWater Technology, Inc. (SKYT) has experienced moderate income growth, with a 19.4% increase in revenue over one year and 143.7% over five years. Profitability remains weak, highlighted by a negative net margin of -1.98% and a negative return on equity of -11.79%. The company carries relatively high debt, with a net debt to EBITDA of 2.29, and its financial ratios are mostly unfavorable. Its moat evaluation is slightly unfavorable, signaling value destruction despite improving profitability.
For investors prioritizing growth and strong financial health, NVDA’s favorable rating, solid income growth, and competitive moat might appear more attractive. Conversely, those with a higher risk tolerance or seeking turnaround opportunities could interpret SKYT’s accelerating price trend and improving profitability as potential signs of future value creation, albeit with higher risk.
Disclaimer: Investment carries a risk of loss of initial capital. The past performance is not a reliable indicator of future results. Be sure to understand risks before making an investment decision.
Go Further
I encourage you to read the complete analyses of NVIDIA Corporation and SkyWater Technology, Inc. to enhance your investment decisions: