NVIDIA Corporation and Silicon Laboratories Inc. stand out as influential players in the semiconductor industry, each driving innovation in distinct but overlapping market segments. NVIDIA leads with advanced graphics and AI computing solutions, while Silicon Labs focuses on mixed-signal and IoT applications. Comparing their strategies and market positions reveals valuable insights for investors seeking growth and stability. Join me as we explore which company offers the most compelling investment opportunity in 2026.
Table of contents
Companies Overview
I will begin the comparison between NVIDIA Corporation and Silicon Laboratories Inc. by providing an overview of these two companies and their main differences.
NVIDIA Overview
NVIDIA Corporation, headquartered in Santa Clara, California, is a leading technology company specializing in graphics, compute, and networking solutions. Its products serve gaming, professional visualization, data center, and automotive markets globally. Founded in 1993, NVIDIA’s offerings include GeForce GPUs, AI platforms, autonomous vehicle technologies, and cloud computing software, positioning it as a major player in the semiconductor industry with a market cap of 4.46T USD.
Silicon Laboratories Overview
Silicon Laboratories Inc., based in Austin, Texas, is a fabless semiconductor company focused on analog-intensive mixed-signal solutions. Founded in 1996, it develops wireless microcontrollers and sensor products primarily for IoT applications such as smart homes, industrial automation, and medical instrumentation. With a market cap of 4.9B USD, Silicon Labs distributes its products through direct sales and a network of representatives, serving a diverse electronic product market.
Key similarities and differences
Both companies operate in the semiconductor sector and serve broad technology markets internationally. NVIDIA is significantly larger with diversified product lines spanning gaming GPUs, AI, and automotive AI solutions, while Silicon Labs focuses on analog and mixed-signal semiconductor solutions targeting IoT applications. NVIDIA’s business model includes extensive software and platform services alongside hardware, contrasting with Silicon Labs’ emphasis on sensor and microcontroller products for specialized embedded systems.
Income Statement Comparison
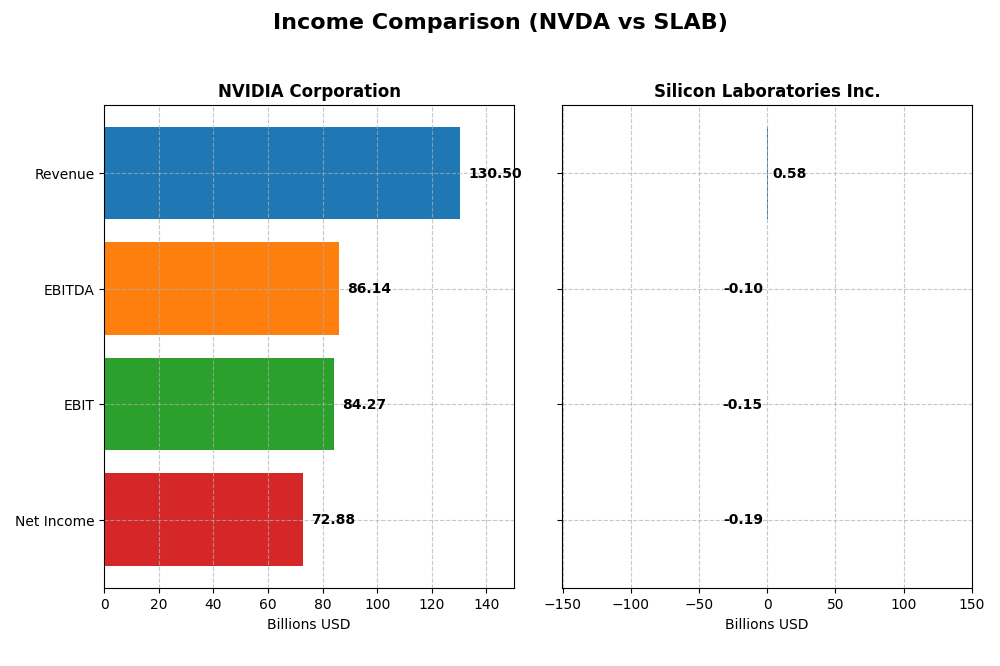
This table compares the most recent fiscal year income statement figures for NVIDIA Corporation and Silicon Laboratories Inc., highlighting key financial metrics.
| Metric | NVIDIA Corporation | Silicon Laboratories Inc. |
|---|---|---|
| Market Cap | 4.46T | 4.90B |
| Revenue | 130.5B | 584M |
| EBITDA | 86.1B | -105M |
| EBIT | 84.3B | -154M |
| Net Income | 72.9B | -191M |
| EPS | 2.97 | -5.93 |
| Fiscal Year | 2025 | 2024 |
Income Statement Interpretations
NVIDIA Corporation
NVIDIA’s revenue and net income surged dramatically from 2021 to 2025, with revenue growing over 680% and net income increasing more than 1500%. Margins improved significantly, with a gross margin near 75% and net margin reaching 56% in 2025, reflecting operational efficiency. The latest fiscal year saw strong revenue growth of 114%, with net margin and EPS also showing favorable expansion.
Silicon Laboratories Inc.
Silicon Laboratories experienced modest overall revenue growth of about 14% between 2020 and 2024 but faced declining profitability, with net income and margins deteriorating sharply. The 2024 fiscal year showed a 25% revenue decline and worsened net margin of -33%, indicating operational challenges. Despite stable gross margin around 53%, the EBIT and net income margins remain negative, reflecting ongoing losses.
Which one has the stronger fundamentals?
NVIDIA displays robust and consistently favorable income statement metrics, including substantial revenue and profit growth alongside strong margins. In contrast, Silicon Laboratories shows unfavorable profitability trends and recent revenue contraction. Based on these income statement evaluations, NVIDIA demonstrates stronger fundamentals driven by effective cost management and significant earnings growth.
Financial Ratios Comparison
The table below presents a side-by-side comparison of key financial ratios for NVIDIA Corporation and Silicon Laboratories Inc. based on the most recent fiscal year data available.
| Ratios | NVIDIA Corporation (NVDA) FY 2025 | Silicon Laboratories Inc. (SLAB) FY 2024 |
|---|---|---|
| ROE | 91.87% | -17.69% |
| ROIC | 75.28% | -18.15% |
| P/E | 39.90 | -21.53 |
| P/B | 36.66 | 3.81 |
| Current Ratio | 4.44 | 6.15 |
| Quick Ratio | 3.88 | 5.07 |
| D/E (Debt-to-Equity) | 0.13 | 0.01 |
| Debt-to-Assets | 9.20% | 1.27% |
| Interest Coverage | 330x | -126x |
| Asset Turnover | 1.17 | 0.48 |
| Fixed Asset Turnover | 16.16 | 4.42 |
| Payout ratio | 1.14% | 0% |
| Dividend yield | 0.03% | 0% |
Interpretation of the Ratios
NVIDIA Corporation
NVIDIA displays strong profitability with a net margin of 55.85% and an impressive ROE of 91.87%, reflecting efficient capital use. However, its high P/E of 39.9 and P/B of 36.66 suggest expensive valuation, and the current ratio of 4.44 is considered unfavorable despite a favorable quick ratio. The company pays a modest dividend with a 0.03% yield, indicating cautious shareholder returns alongside share buybacks supported by robust free cash flow.
Silicon Laboratories Inc.
Silicon Laboratories shows weak financial health with negative net margin (-32.69%) and ROE (-17.69%), signaling losses and poor profitability. Although its low debt-to-equity ratio and quick ratio are favorable, the negative interest coverage and low asset turnover raise concerns about operational efficiency. The company does not pay dividends, likely prioritizing reinvestment in R&D and growth, consistent with its negative earnings and free cash flow trends.
Which one has the best ratios?
Based on the evaluations, NVIDIA exhibits predominantly favorable ratios, including strong profitability and capital efficiency, despite some valuation concerns. Silicon Laboratories faces significant unfavorable metrics, including negative profitability and cash flow challenges. Consequently, NVIDIA holds a more favorable ratio profile compared to Silicon Laboratories in the current period.
Strategic Positioning
This section compares the strategic positioning of NVIDIA and Silicon Laboratories, focusing on Market position, Key segments, and Exposure to technological disruption:
NVIDIA Corporation
- Leading global player in semiconductors with high competitive pressure in GPUs and AI data centers.
- Diverse segments: Data Center, Gaming, Automotive, Professional Visualization, and OEM with strong growth drivers.
- Active in AI, HPC, autonomous driving, and cloud computing software, facing rapid technological changes.
Silicon Laboratories Inc.
- Smaller market cap with moderate competition in analog and mixed-signal semiconductors.
- Concentrated in Industrial & Commercial IoT, wireless microcontrollers, and sensor solutions.
- Focused on IoT and mixed-signal technologies with steady exposure to innovation in connected devices.
NVIDIA vs Silicon Laboratories Positioning
NVIDIA pursues a diversified approach across multiple high-growth segments like AI and gaming, offering broad market exposure, whereas Silicon Laboratories concentrates on niche IoT and industrial markets, potentially limiting scale but focusing on specialized solutions.
Which has the best competitive advantage?
NVIDIA shows a very favorable moat with a growing ROIC well above WACC, indicating a durable competitive advantage. Silicon Laboratories faces a very unfavorable moat with declining ROIC, signaling value destruction and weaker competitive positioning.
Stock Comparison
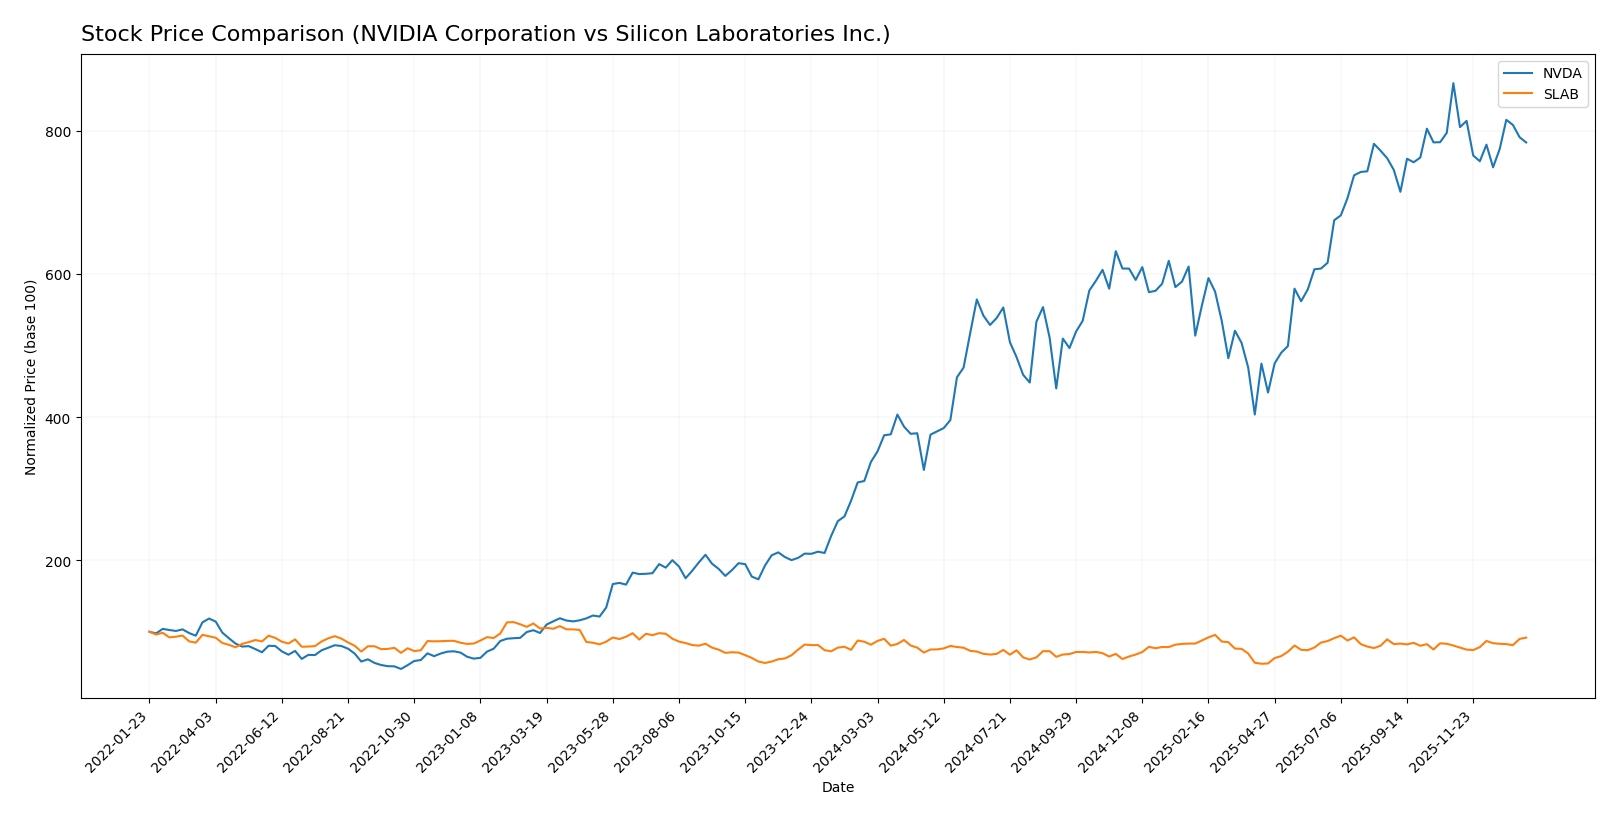
The stock price chart highlights significant bullish momentum for NVIDIA Corporation with a 132.35% increase over the past year, contrasted by Silicon Laboratories Inc.’s moderate 12.08% gain, reflecting differing acceleration patterns and recent trading dynamics.
Trend Analysis
NVIDIA Corporation’s stock shows a strong bullish trend with a 132.35% price increase over the past 12 months, despite a deceleration in momentum. The stock peaked at 202.49 and bottomed at 76.2, with high volatility (std deviation 32.46). Recent weeks reveal a bearish short-term shift with a -9.56% decline.
Silicon Laboratories Inc. exhibits a bullish trend with a 12.08% rise over the past year, accompanied by accelerating momentum. The stock’s price ranged between 89.82 and 155.33, with moderate volatility (std deviation 14.09). Recent data indicates continued strength with a 13.71% increase.
Comparing the two, NVIDIA delivered the highest market performance over the last 12 months, outperforming Silicon Laboratories by a wide margin, despite recent short-term weakness in its stock trend.
Target Prices
Analysts provide a clear target price consensus for NVIDIA Corporation and Silicon Laboratories Inc.
| Company | Target High | Target Low | Consensus |
|---|---|---|---|
| NVIDIA Corporation | 352 | 140 | 264.34 |
| Silicon Laboratories Inc. | 165 | 130 | 151.67 |
The consensus target prices suggest a significant upside for NVIDIA, with a consensus of 264.34 well above its current price of 183.14. Silicon Laboratories also shows moderate upside potential, with a consensus target of 151.67 slightly above its current price of 149.05.
Analyst Opinions Comparison
This section compares analysts’ ratings and grades for NVIDIA Corporation and Silicon Laboratories Inc.:
Rating Comparison
NVDA Rating
- Rating: B+ indicating a very favorable overall rating.
- Discounted Cash Flow Score: Moderate at 3.
- ROE Score: Very favorable at 5, showing high profitability.
- ROA Score: Very favorable at 5, reflecting efficient asset use.
- Debt To Equity Score: Moderate at 3, indicating balanced financial risk.
- Overall Score: Moderate at 3, summarizing financial standing.
SLAB Rating
- Rating: C- with a very unfavorable overall rating.
- Discounted Cash Flow Score: Moderate at 2.
- ROE Score: Very unfavorable at 1, indicating weak profitability.
- ROA Score: Very unfavorable at 1, showing poor asset utilization.
- Debt To Equity Score: Very unfavorable at 1, suggesting high financial risk.
- Overall Score: Very unfavorable at 1, reflecting weak financial health.
Which one is the best rated?
Based strictly on the provided data, NVIDIA Corporation is better rated with a B+ rating and stronger scores in ROE, ROA, and debt-to-equity, while Silicon Laboratories holds a significantly weaker C- rating and lower financial scores.
Scores Comparison
Here is a comparison of the Altman Z-Score and Piotroski Score for NVIDIA and Silicon Laboratories:
NVIDIA Scores
- Altman Z-Score: 68.04, indicating a very safe financial position.
- Piotroski Score: 6, reflecting average financial strength.
Silicon Laboratories Scores
- Altman Z-Score: 15.59, also indicating a safe financial position.
- Piotroski Score: 4, indicating average but lower financial strength.
Which company has the best scores?
NVIDIA shows a much higher Altman Z-Score than Silicon Laboratories, suggesting stronger financial stability. Both have average Piotroski Scores, but NVIDIA’s score is higher, indicating relatively better financial health.
Grades Comparison
Here is the comparison of the latest grades for NVIDIA Corporation and Silicon Laboratories Inc.:
NVIDIA Corporation Grades
The table below lists recent grades from reputable grading companies for NVIDIA Corporation.
| Grading Company | Action | New Grade | Date |
|---|---|---|---|
| Mizuho | Maintain | Outperform | 2026-01-09 |
| Truist Securities | Maintain | Buy | 2025-12-29 |
| Stifel | Maintain | Buy | 2025-12-29 |
| B of A Securities | Maintain | Buy | 2025-12-26 |
| Baird | Maintain | Outperform | 2025-12-26 |
| Bernstein | Maintain | Outperform | 2025-12-26 |
| Truist Securities | Maintain | Buy | 2025-12-19 |
| Tigress Financial | Maintain | Strong Buy | 2025-12-18 |
| Morgan Stanley | Maintain | Overweight | 2025-12-01 |
| Deutsche Bank | Maintain | Hold | 2025-11-20 |
NVIDIA’s grades predominantly show a consensus of Buy and Outperform ratings, with occasional Strong Buy and Overweight recommendations, indicating a generally positive outlook.
Silicon Laboratories Inc. Grades
The table below presents recent grades from recognized grading companies for Silicon Laboratories Inc.
| Grading Company | Action | New Grade | Date |
|---|---|---|---|
| Morgan Stanley | Maintain | Equal Weight | 2025-08-06 |
| Susquehanna | Maintain | Neutral | 2025-08-06 |
| Barclays | Maintain | Equal Weight | 2025-08-05 |
| Susquehanna | Maintain | Neutral | 2025-07-22 |
| Stifel | Maintain | Buy | 2025-07-18 |
| Keybanc | Maintain | Overweight | 2025-07-08 |
| Benchmark | Maintain | Buy | 2025-05-27 |
| Benchmark | Maintain | Buy | 2025-05-14 |
| Susquehanna | Maintain | Neutral | 2025-05-14 |
| Needham | Maintain | Buy | 2025-05-14 |
Silicon Laboratories’ grades mostly range between Neutral and Buy, with some Overweight ratings, reflecting a moderately positive but more cautious stance.
Which company has the best grades?
NVIDIA has received more frequent and higher-tier grades such as Outperform and Strong Buy compared to Silicon Laboratories, which predominantly has Neutral and Buy ratings. This suggests NVIDIA is viewed more favorably by analysts, potentially indicating higher confidence in its growth prospects for investors.
Strengths and Weaknesses
Below is a comparison of key strengths and weaknesses of NVIDIA Corporation and Silicon Laboratories Inc., based on their latest financial and market data.
| Criterion | NVIDIA Corporation (NVDA) | Silicon Laboratories Inc. (SLAB) |
|---|---|---|
| Diversification | Highly diversified with strong segments in Data Center ($115B), Gaming ($11.35B), Automotive ($1.69B), and Professional Visualization ($1.88B) | Limited diversification, primarily focused on Industrial & Commercial segment ($339M) |
| Profitability | Very high profitability: Net margin 55.85%, ROIC 75.28%, ROE 91.87% | Negative profitability: Net margin -32.69%, ROIC -18.15%, ROE -17.69% |
| Innovation | Leading innovation in GPUs and AI chips, demonstrated by strong growth and durable competitive advantage | Innovation challenges reflected in declining ROIC and value destruction |
| Global presence | Strong global footprint with significant market share in multiple high-growth tech sectors | Smaller scale and less global reach, focused largely on niche industrial markets |
| Market Share | Dominant in Data Center and Gaming markets with rapidly growing revenues | Small market share in fragmented industrial semiconductor markets |
Key takeaways: NVIDIA demonstrates a robust competitive moat with diversified revenue streams, exceptional profitability, and strong innovation leadership. Silicon Laboratories faces significant challenges with declining profitability and limited diversification, signaling higher investment risk.
Risk Analysis
Below is a comparative table highlighting key risk metrics for NVIDIA Corporation (NVDA) and Silicon Laboratories Inc. (SLAB) based on the most recent data available.
| Metric | NVIDIA Corporation (NVDA) | Silicon Laboratories Inc. (SLAB) |
|---|---|---|
| Market Risk | High beta of 2.31 indicates significant volatility | Moderate beta of 1.55 suggests moderate volatility |
| Debt level | Low debt-to-equity ratio at 0.13 (favorable) | Very low debt-to-equity ratio at 0.01 (favorable) |
| Regulatory Risk | Moderate, due to global operations including China | Moderate, with international exposure |
| Operational Risk | Diversified product portfolio reduces risk | Smaller scale with niche IoT focus increases risk |
| Environmental Risk | Moderate, with industry pressure on semiconductor manufacturing | Moderate, similarly exposed to semiconductor industry pressures |
| Geopolitical Risk | Significant, due to reliance on global supply chains and markets | Notable, given exposure to U.S.-China tech tensions |
NVIDIA faces the most impactful risks from market volatility and geopolitical tensions affecting its global supply chain, despite strong financial health. Silicon Laboratories, while financially more constrained, is more vulnerable operationally and to regulatory changes in IoT markets. Investors should weigh NVIDIA’s scale and resilience against SLAB’s higher financial risk and narrower market focus.
Which Stock to Choose?
NVIDIA Corporation (NVDA) shows a strong income evolution with a 114.2% revenue growth in one year and a 682.6% increase over five years. Its financial ratios are mostly favorable, including a 55.85% net margin and 91.87% ROE, alongside low debt and a B+ rating indicating very favorable financial health.
Silicon Laboratories Inc. (SLAB) displays a challenging income evolution, with a -25.3% revenue decline in one year and mixed overall growth. Its financial ratios are mostly unfavorable, including a -32.69% net margin and negative ROE, despite low debt levels. The company holds a C- rating, reflecting significant financial difficulties.
For investors, NVDA’s very favorable rating and robust income growth suggest it might appeal to those seeking quality and growth. Conversely, SLAB’s unfavorable financials and rating could be interpreted as higher risk, possibly suiting risk-tolerant investors looking for turnaround opportunities.
Disclaimer: Investment carries a risk of loss of initial capital. The past performance is not a reliable indicator of future results. Be sure to understand risks before making an investment decision.
Go Further
I encourage you to read the complete analyses of NVIDIA Corporation and Silicon Laboratories Inc. to enhance your investment decisions: