NVIDIA Corporation and Qnity Electronics, Inc. are two prominent players in the semiconductor industry, each carving a unique path in technology innovation. NVIDIA leads with advanced graphics and AI computing solutions, while Qnity focuses on electronic materials essential for chip manufacturing. Their market overlap and innovation strategies make them compelling for investors seeking growth in tech. This article will help you decide which company holds the most promise for your investment portfolio.
Table of contents
Companies Overview
I will begin the comparison between NVIDIA Corporation and Qnity Electronics, Inc. by providing an overview of these two companies and their main differences.
NVIDIA Overview
NVIDIA Corporation operates in the semiconductor industry, providing graphics, compute, and networking solutions globally. Its product portfolio includes GPUs for gaming, professional visualization, data centers, and automotive markets. NVIDIA’s mission revolves around advancing AI, autonomous driving, and virtual computing technologies. Headquartered in Santa Clara, California, it is a well-established company with a market cap of approximately 4.46T USD.
Qnity Overview
Qnity Electronics, Inc., also in the semiconductor sector, specializes in electronic solutions and materials for semiconductor chip manufacturing and advanced electronic materials. Formerly known as Novus SpinCo 1, Inc., it changed its name in April 2025. Based in Wilmington, Delaware, Qnity is a newer public company with a market cap near 19B USD and focuses on supplying critical components for chip production.
Key similarities and differences
Both companies operate within the technology sector’s semiconductor industry, supplying essential hardware components. NVIDIA emphasizes diverse end markets including gaming, data centers, and automotive AI, with extensive global reach and product variety. In contrast, Qnity concentrates specifically on materials and solutions for semiconductor manufacturing, representing a narrower but vital niche. Their scale and market presence also differ significantly, with NVIDIA being a market leader by capitalization.
Income Statement Comparison
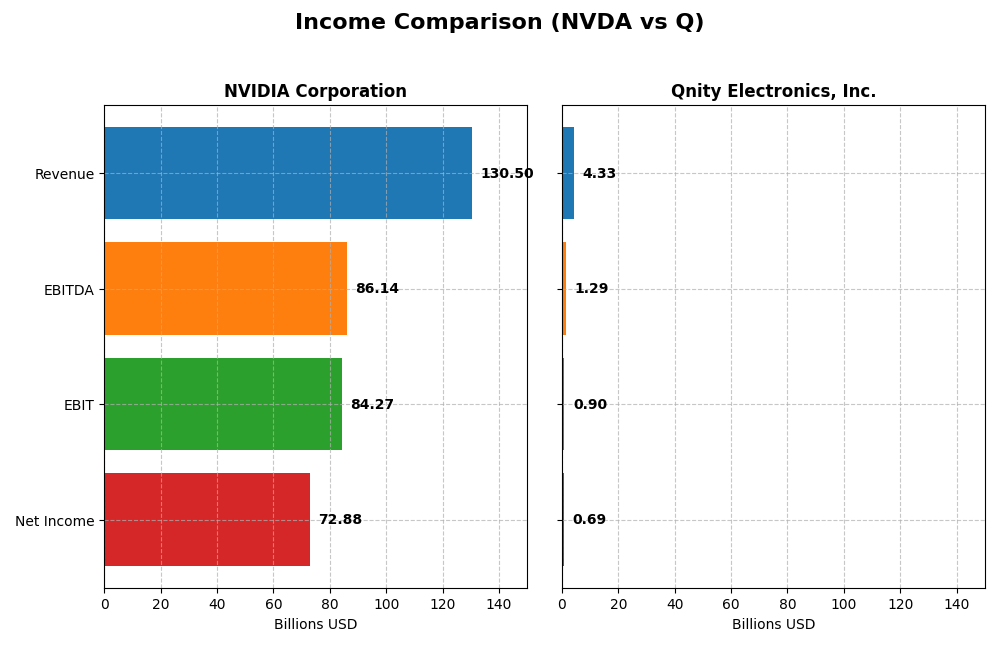
The table below presents a side-by-side comparison of key income statement metrics for NVIDIA Corporation and Qnity Electronics, Inc. for their most recent fiscal years.
| Metric | NVIDIA Corporation | Qnity Electronics, Inc. |
|---|---|---|
| Market Cap | 4.46T | 18.8B |
| Revenue | 130.5B | 4.34B |
| EBITDA | 86.1B | 1.29B |
| EBIT | 84.3B | 898M |
| Net Income | 72.9B | 693M |
| EPS | 2.97 | 3.31 |
| Fiscal Year | 2025 | 2024 |
Income Statement Interpretations
NVIDIA Corporation
NVIDIA experienced exceptional growth in revenue and net income from 2021 to 2025, with revenue soaring from $16.7B to $130.5B and net income rising from $4.3B to $72.9B. Margins improved significantly, with a gross margin near 75% and net margin at 56% in 2025. The latest year showed sustained rapid growth and margin expansion, reflecting strong operational leverage.
Qnity Electronics, Inc.
Qnity Electronics showed moderate revenue growth over the last year, increasing from $4.0B to $4.3B, with net income rising from $507M to $693M. Margins remain stable with a gross margin of 46% and net margin near 16%. However, over the full 2022-2024 period, revenue and net income declined slightly, indicating some challenges despite recent improvements.
Which one has the stronger fundamentals?
NVIDIA’s financials demonstrate robust top-line and bottom-line growth, coupled with superior margins and consistent margin improvement, resulting in a fully favorable income statement evaluation. Qnity Electronics, while showing recent growth and favorable margins, faces declining revenue and net income over the longer term, leading to a mixed evaluation. Hence, NVIDIA’s fundamentals appear stronger based on these income statement metrics.
Financial Ratios Comparison
The table below presents a comparison of key financial ratios for NVIDIA Corporation and Qnity Electronics, Inc. based on their most recent fiscal year data.
| Ratios | NVIDIA Corporation (2025) | Qnity Electronics, Inc. (2024) |
|---|---|---|
| ROE | 91.87% | 6.51% |
| ROIC | 75.28% | 5.92% |
| P/E | 39.90 | 28.80 |
| P/B | 36.66 | 1.88 |
| Current Ratio | 4.44 | 1.77 |
| Quick Ratio | 3.88 | 1.06 |
| D/E (Debt-to-Equity) | 0.13 | 0.02 |
| Debt-to-Assets | 9.20% | 1.56% |
| Interest Coverage | 330.0 | 3.03 |
| Asset Turnover | 1.17 | 0.35 |
| Fixed Asset Turnover | 16.16 | 2.59 |
| Payout Ratio | 1.14% | 0.00% |
| Dividend Yield | 0.03% | 0.00% |
Interpretation of the Ratios
NVIDIA Corporation
NVIDIA shows strong profitability with a net margin of 55.85%, ROE at 91.87%, and ROIC at 75.28%, indicating excellent returns on equity and invested capital. However, high valuations reflected in a PE of 39.9 and PB of 36.66 raise caution, alongside an elevated current ratio of 4.44. Dividend yield remains low at 0.03%, with regular small dividends covered by robust free cash flow, posing minimal distribution risk.
Qnity Electronics, Inc.
Qnity’s ratios reflect moderate profitability with a net margin of 15.99% but lower returns including a 6.51% ROE and 5.92% ROIC, signaling room for operational improvement. The company maintains a healthy balance sheet with a current ratio of 1.77 and very low debt ratios. It does not pay dividends, likely focusing on reinvestment or growth, with no share buybacks reported, consistent with a developing phase.
Which one has the best ratios?
NVIDIA presents a more favorable ratio profile with superior profitability and capital efficiency metrics despite some valuation concerns and a low dividend yield. Qnity shows a more conservative balance sheet and moderate profitability but weaker returns on equity and invested capital, resulting in a slightly favorable overall evaluation compared to NVIDIA’s stronger global rating.
Strategic Positioning
This section compares the strategic positioning of NVIDIA Corporation and Qnity Electronics, Inc., including Market position, Key segments, and Exposure to technological disruption:
NVIDIA Corporation
- Leading market position with significant competitive pressure in semiconductors.
- Diverse segments: Data Center, Gaming, Automotive, Professional Visualization.
- Positioned in advanced AI, HPC, autonomous driving, gaming, and virtual worlds technology.
Qnity Electronics, Inc.
- Smaller market cap, operating in semiconductor chip materials with less competitive pressure.
- Focused on electronic solutions and materials for semiconductor manufacturing.
- Exposure limited to semiconductor chip manufacturing materials, less diversified in technology disruption.
NVIDIA Corporation vs Qnity Electronics, Inc. Positioning
NVIDIA has a diversified business model across multiple technology-driven segments, enhancing growth opportunities but facing intense competition. Qnity focuses narrowly on semiconductor materials, which may limit growth but reduces exposure to multiple market risks.
Which has the best competitive advantage?
NVIDIA demonstrates a very favorable moat with strong value creation and growing ROIC, indicating durable competitive advantage. Qnity shows a neutral moat with stable profitability but no clear competitive edge currently.
Stock Comparison
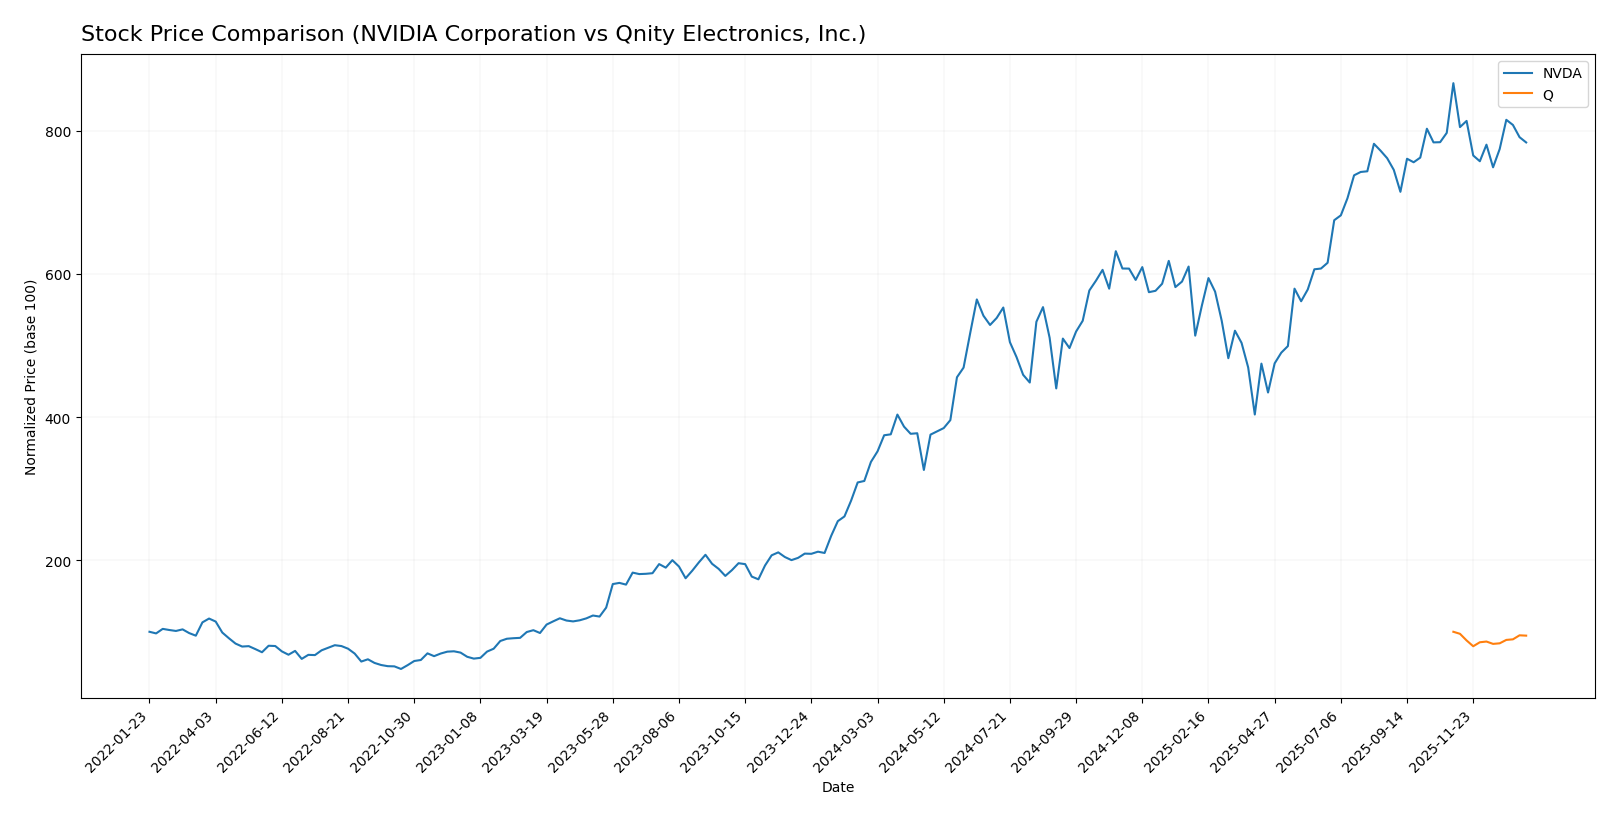
The stock prices of NVIDIA Corporation and Qnity Electronics, Inc. exhibited contrasting movements over the past 12 months, with NVIDIA showing a strong upward trend despite recent pullbacks, while Qnity faced a consistent decline amid stable trading volumes.
Trend Analysis
NVIDIA Corporation’s stock displayed a bullish trend over the past year, with a 132.35% price increase and a deceleration in momentum. The price ranged between $76.2 and $202.49, showing significant growth but some recent weakening.
Qnity Electronics, Inc. experienced a bearish trend with a 5.39% decline in stock price over the same period. Its price fluctuated between $75.8 and $95.0, maintaining a stable but downward trajectory throughout the year.
Comparing the two, NVIDIA delivered the highest market performance with a substantial price increase, while Qnity’s stock trended negatively, reflecting weaker investor sentiment.
Target Prices
The current analyst consensus offers a clear outlook on target prices for NVIDIA Corporation and Qnity Electronics, Inc.
| Company | Target High | Target Low | Consensus |
|---|---|---|---|
| NVIDIA Corporation | 352 | 140 | 264.34 |
| Qnity Electronics, Inc. | 117 | 92 | 105.89 |
Analysts expect NVIDIA’s stock to appreciate significantly from its current price of 183.14 USD, with a consensus target well above the market price. Qnity Electronics’ consensus target of 105.89 USD also suggests upside potential from its current 89.88 USD.
Analyst Opinions Comparison
This section compares analysts’ ratings and grades for NVIDIA Corporation and Qnity Electronics, Inc.:
Rating Comparison
NVIDIA Corporation Rating
- Rating: Both have a B+ rating, indicating a very favorable evaluation.
- Discounted Cash Flow Score: Moderate score of 3, reflecting moderate valuation confidence.
- ROE Score: Very favorable score of 5, showing high efficiency in generating profit.
- ROA Score: Very favorable score of 5, demonstrating excellent asset utilization.
- Debt To Equity Score: Moderate score of 3, indicating balanced financial risk.
- Overall Score: Moderate score of 3, summarizing financial standing as average.
Qnity Electronics, Inc. Rating
- Rating: Both have a B+ rating, indicating a very favorable evaluation.
- Discounted Cash Flow Score: Favorable score of 4, suggesting better valuation prospects.
- ROE Score: Moderate score of 3, indicating average profit generation efficiency.
- ROA Score: Favorable score of 4, reflecting good asset utilization.
- Debt To Equity Score: Moderate score of 3, showing similar financial risk level.
- Overall Score: Moderate score of 3, similarly summarizing average financial standing.
Which one is the best rated?
Both companies share an identical overall rating of B+ and an overall score of 3, indicating moderate financial standing. However, NVIDIA has stronger ROE and ROA scores, while Qnity holds a higher discounted cash flow score. Their debt-to-equity scores are the same.
Scores Comparison
Here is a comparison of the companies’ scores based on the Altman Z-Score and Piotroski Score:
NVIDIA Scores
- Altman Z-Score: 68.04, indicating a safe financial zone with very low bankruptcy risk.
- Piotroski Score: 6, reflecting average financial strength and investment potential.
Qnity Scores
- No data available
- No data available
Which company has the best scores?
NVIDIA shows a very strong Altman Z-Score, placing it well within the safe zone, and an average Piotroski Score of 6. Qnity has no available scores, so based on the data, NVIDIA holds the advantage in financial stability and strength.
Grades Comparison
Here is the comparison of the latest reliable grades for NVIDIA Corporation and Qnity Electronics, Inc.:
NVIDIA Corporation Grades
This table summarizes recent grades assigned by major financial institutions to NVIDIA Corporation:
| Grading Company | Action | New Grade | Date |
|---|---|---|---|
| Mizuho | Maintain | Outperform | 2026-01-09 |
| Truist Securities | Maintain | Buy | 2025-12-29 |
| Stifel | Maintain | Buy | 2025-12-29 |
| B of A Securities | Maintain | Buy | 2025-12-26 |
| Baird | Maintain | Outperform | 2025-12-26 |
| Bernstein | Maintain | Outperform | 2025-12-26 |
| Truist Securities | Maintain | Buy | 2025-12-19 |
| Tigress Financial | Maintain | Strong Buy | 2025-12-18 |
| Morgan Stanley | Maintain | Overweight | 2025-12-01 |
| Deutsche Bank | Maintain | Hold | 2025-11-20 |
NVIDIA’s grades consistently lean towards positive ratings, with dominant Buy and Outperform classifications and a few Hold ratings.
Qnity Electronics, Inc. Grades
The following table shows recent grades for Qnity Electronics, Inc.:
| Grading Company | Action | New Grade | Date |
|---|---|---|---|
| RBC Capital | Maintain | Outperform | 2025-11-25 |
| Mizuho | Maintain | Outperform | 2025-11-20 |
Qnity Electronics has fewer but uniformly positive Outperform ratings.
Which company has the best grades?
NVIDIA Corporation has a broader and more frequent set of grades, mostly Buy and Outperform, with some Hold ratings, while Qnity Electronics has fewer but consistently Outperform grades. NVIDIA’s more extensive coverage suggests stronger market analyst confidence, potentially reflecting greater investor interest and liquidity.
Strengths and Weaknesses
The table below compares key strengths and weaknesses of NVIDIA Corporation and Qnity Electronics, Inc. based on recent financial and strategic data.
| Criterion | NVIDIA Corporation | Qnity Electronics, Inc. |
|---|---|---|
| Diversification | Highly diversified with strong segments in Data Center ($115B), Gaming ($11.35B), Automotive ($1.69B), and Professional Visualization ($1.88B) | Limited diversification; primarily focused on electronics with smaller scale operations |
| Profitability | Very high profitability: Net margin 55.85%, ROIC 75.28%, ROE 91.87% | Moderate profitability: Net margin 15.99%, ROIC 5.92%, ROE 6.51% |
| Innovation | Strong innovation evidenced by durable competitive advantage and rapidly growing ROIC (339% growth) | Neutral innovation position with stable ROIC and no clear competitive advantage |
| Global presence | Extensive global footprint, especially in data centers and gaming markets | More regional or niche presence, less global scale |
| Market Share | Leading market share in GPUs and AI chips with strong growth in data center segment | Smaller market share, niche player with limited growth |
NVIDIA stands out with its strong diversification, exceptional profitability, and robust innovation, indicating a durable competitive advantage. In contrast, Qnity Electronics shows moderate profitability and a stable but unremarkable market position, suggesting higher risk and less growth potential.
Risk Analysis
The table below summarizes key risks for NVIDIA Corporation and Qnity Electronics, Inc. based on the most recent data from 2025 and 2024 respectively.
| Metric | NVIDIA Corporation (NVDA) | Qnity Electronics, Inc. (Q) |
|---|---|---|
| Market Risk | High beta (2.314) indicates higher volatility | Beta is 0, suggesting low market volatility risk |
| Debt level | Low debt-to-equity (0.13), low debt-to-assets (9.2%) | Very low debt-to-equity (0.02), very low debt-to-assets (1.56%) |
| Regulatory Risk | Moderate, due to global operations including China and Taiwan | Moderate, as a newer company in semiconductor materials |
| Operational Risk | High complexity in diverse product lines and AI/datacenter dependency | Moderate, still scaling operations as a recent IPO |
| Environmental Risk | Moderate, semiconductor manufacturing impacts | Moderate, focus on advanced materials with environmental considerations |
| Geopolitical Risk | Elevated due to exposure to US-China tech tensions | Moderate, US-based but in a sensitive supply chain sector |
NVIDIA faces the most impactful risks from market volatility and geopolitical tensions affecting supply chains and international sales. Its low debt is a strength, but valuation metrics remain stretched. Qnity Electronics shows lower market risk and financial leverage but carries operational risks typical of a newly public company in a highly specialized industry. Investors should weigh volatility and geopolitical exposure heavily when considering NVIDIA, while monitoring Qnity’s operational execution and market acceptance.
Which Stock to Choose?
NVIDIA Corporation (NVDA) has shown remarkable income growth with a 682.6% revenue increase over five years and a 55.85% net margin in 2025. Its financial ratios are mostly favorable, including a very strong ROE of 91.87%, low debt levels, and a solid quick ratio. The company maintains a very favorable rating (B+) and demonstrates a very favorable economic moat with a high ROIC exceeding WACC significantly.
Qnity Electronics, Inc. (Q) displays moderate income growth with a 7.4% revenue rise last year but an overall decline over three years, and a 15.99% net margin in 2024. Its financial ratios are slightly favorable, with strengths in low debt and liquidity but weaker returns on equity and assets. The company holds a favorable rating (B+) and a neutral moat status, indicating stable but limited competitive advantage.
For investors prioritizing high growth potential and strong profitability, NVDA’s robust income evolution and very favorable financial and moat indicators might appear more attractive. Conversely, those seeking a company with moderate growth and lower valuation multiples could find Q’s profile more aligned with their investment preferences. The choice may depend on the investor’s risk tolerance and strategic focus.
Disclaimer: Investment carries a risk of loss of initial capital. The past performance is not a reliable indicator of future results. Be sure to understand risks before making an investment decision.
Go Further
I encourage you to read the complete analyses of NVIDIA Corporation and Qnity Electronics, Inc. to enhance your investment decisions: