In the rapidly evolving semiconductor industry, NVIDIA Corporation and Onto Innovation Inc. stand out for their distinct yet overlapping roles in technology innovation. NVIDIA leads with cutting-edge graphics and AI computing solutions, while Onto Innovation specializes in precision process control tools essential for semiconductor manufacturing. This comparison explores their market positions and innovation strategies to help you decide which company offers the most compelling investment opportunity today.

Table of contents
Companies Overview
I will begin the comparison between NVIDIA and Onto Innovation by providing an overview of these two companies and their main differences.
NVIDIA Overview
NVIDIA Corporation, headquartered in Santa Clara, CA, is a leading player in the semiconductor industry focused on graphics, compute, and networking solutions. Founded in 1993, NVIDIA offers products like GeForce GPUs for gaming and PCs, data center platforms for AI and HPC, and automotive AI technologies. With a market cap of 4.46T USD and 36,000 employees, it serves diverse sectors including gaming, professional visualization, data centers, and automotive markets globally.
Onto Innovation Overview
Onto Innovation Inc., based in Wilmington, MA, specializes in process control tools for semiconductor manufacturing, including macro defect inspection, optical metrology, lithography systems, and analytical software. Established in 1940 and formerly known as Rudolph Technologies, Onto Innovation supports device manufacturers with process and yield management solutions. The company has a market cap of about 9.9B USD and employs around 1,550 people, focusing on advanced packaging and semiconductor process control worldwide.
Key similarities and differences
Both NVIDIA and Onto Innovation operate within the semiconductor sector, providing technology solutions critical to chip manufacturing and applications. However, NVIDIA emphasizes high-performance GPUs, AI computing, and automotive technologies, while Onto Innovation concentrates on process control equipment and software for semiconductor fabrication. Their market caps and workforce sizes differ significantly, reflecting NVIDIA’s broader product scope and global reach compared to Onto’s specialized manufacturing focus.
Income Statement Comparison
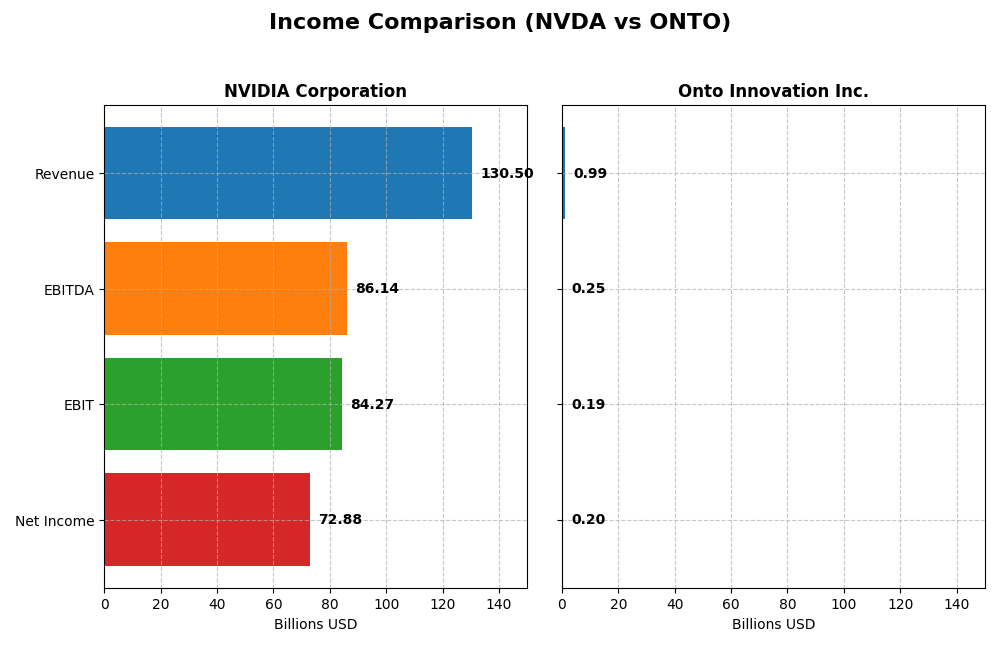
Below is a side-by-side comparison of the most recent fiscal year income statement figures for NVIDIA Corporation and Onto Innovation Inc., highlighting key financial metrics.
| Metric | NVIDIA Corporation | Onto Innovation Inc. |
|---|---|---|
| Market Cap | 4.46T | 9.91B |
| Revenue | 130.5B | 987.3M |
| EBITDA | 86.1B | 249.4M |
| EBIT | 84.3B | 187.1M |
| Net Income | 72.9B | 201.7M |
| EPS | 2.97 | 4.09 |
| Fiscal Year | 2025 | 2024 |
Income Statement Interpretations
NVIDIA Corporation
NVIDIA’s revenue surged from $16.7B in 2021 to $130.5B in 2025, with net income climbing from $4.3B to $72.9B over the same period. Margins remained robust, gross margin at 75% and net margin near 56% in 2025, reflecting strong profitability. The latest fiscal year saw exceptional growth, with revenue and net income more than doubling, signaling accelerating momentum and margin expansion.
Onto Innovation Inc.
Onto Innovation’s revenue grew steadily from $557M in 2020 to $987M in 2024, with net income rising from $31M to $202M. Margins improved moderately, with a gross margin of 52% and net margin of 20% in 2024. The most recent year showed solid growth rates around 20% in revenue and over 60% in EBIT, indicating healthy operational leverage and margin improvement despite a smaller scale.
Which one has the stronger fundamentals?
Both companies demonstrate favorable income statement trends and margin improvements, but NVIDIA’s scale and growth rates vastly outpace Onto Innovation’s. NVIDIA’s superior gross, EBIT, and net margins coupled with explosive revenue and earnings growth provide it with more substantial fundamental strength. Onto Innovation shows commendable progress but on a much smaller revenue base and with more modest profitability metrics.
Financial Ratios Comparison
Below is a comparison of key financial ratios for NVIDIA Corporation and Onto Innovation Inc. based on their most recent fiscal year data.
| Ratios | NVIDIA Corporation (2025) | Onto Innovation Inc. (2024) |
|---|---|---|
| ROE | 91.9% | 10.5% |
| ROIC | 75.3% | 8.8% |
| P/E | 39.9 | 41.8 |
| P/B | 36.7 | 4.37 |
| Current Ratio | 4.44 | 8.69 |
| Quick Ratio | 3.88 | 7.00 |
| D/E (Debt-to-Equity) | 0.13 | 0.008 |
| Debt-to-Assets | 9.2% | 0.7% |
| Interest Coverage | 330 | 0 |
| Asset Turnover | 1.17 | 0.47 |
| Fixed Asset Turnover | 16.2 | 7.16 |
| Payout Ratio | 1.14% | 0% |
| Dividend Yield | 0.029% | 0% |
Interpretation of the Ratios
NVIDIA Corporation
NVIDIA’s financial ratios are predominantly strong, with favorable metrics including a high net margin of 55.85%, ROE at 91.87%, and ROIC at 75.28%, reflecting excellent profitability and efficient capital use. However, its high valuation ratios such as PE of 39.9 and PB of 36.66, alongside a low dividend yield of 0.03%, are potential concerns. NVIDIA pays dividends, but the yield is low, suggesting a cautious payout policy balanced with share buybacks supported by strong free cash flow coverage.
Onto Innovation Inc.
Onto Innovation exhibits a mixed ratio profile with a favorable net margin of 20.43% and strong liquidity ratios, but neutral returns on equity (10.47%) and invested capital (8.77%) indicate moderate profitability. Its high PE ratio of 41.76 and elevated current ratio of 8.69 are less favorable, signaling valuation and operational efficiency risks. Onto does not pay dividends, likely prioritizing reinvestment and R&D to support growth, with no share buyback reported.
Which one has the best ratios?
NVIDIA demonstrates a more favorable overall ratio profile, with a majority of strong profitability and efficiency indicators, despite some valuation and liquidity concerns. Onto Innovation shows a balanced but less robust set of ratios, with neutral returns and more mixed signals. Therefore, NVIDIA’s ratios appear stronger and more advantageous based on the available data.
Strategic Positioning
This section compares the strategic positioning of NVIDIA and Onto Innovation including market position, key segments, and exposure to technological disruption:
NVIDIA Corporation
- Leading semiconductor firm with a dominant global market cap of 4.46T, facing high competitive pressure.
- Diverse segments: Data Center (115B), Gaming (11.3B), Automotive (1.7B), and Professional Visualization.
- Invested in AI, HPC, autonomous driving, and cloud computing platforms, indicating high exposure to tech disruption.
Onto Innovation Inc.
- Smaller semiconductor company with a market cap of 9.91B, operating under moderate competitive pressure.
- Focus on process control tools, lithography, and software for semiconductor manufacturing and packaging.
- Offers process control and metrology solutions, with moderate exposure to technological changes in semiconductor manufacturing.
NVIDIA Corporation vs Onto Innovation Inc. Positioning
NVIDIA pursues a diversified strategy across multiple high-growth segments, leveraging broad technology innovation. Onto Innovation concentrates on specialized process control systems, which may limit scale but focus expertise. NVIDIA’s scale offers extensive market reach, Onto benefits from niche specialization.
Which has the best competitive advantage?
NVIDIA demonstrates a very favorable moat with growing ROIC well above WACC, indicating a durable competitive advantage. Onto Innovation shows slightly unfavorable moat status with ROIC below WACC but improving profitability, reflecting weaker competitive positioning.
Stock Comparison
The stock prices of NVIDIA Corporation and Onto Innovation Inc. have demonstrated significant divergent dynamics over the past year, with NVIDIA showing strong gains but recent softness, while Onto Innovation has accelerated its upward momentum more recently.

Trend Analysis
NVIDIA Corporation’s stock showed a bullish trend over the past 12 months with a 132.35% increase but has recently declined by 9.56%, indicating a deceleration in momentum despite high volatility. Onto Innovation Inc. experienced a bullish overall trend with a 13.31% increase, and its recent 49.83% gain shows accelerating upward momentum amid higher volatility. Comparing the two, NVIDIA delivered the highest market performance over the year, although Onto Innovation’s recent surge outpaced NVIDIA’s recent decline.
Target Prices
The current analyst consensus provides a clear outlook on both NVIDIA Corporation and Onto Innovation Inc.
| Company | Target High | Target Low | Consensus |
|---|---|---|---|
| NVIDIA Corporation | 352 | 140 | 264.34 |
| Onto Innovation Inc. | 200 | 160 | 178 |
Analysts expect NVIDIA’s stock to appreciate significantly from its current price of 183.14 USD, reflecting strong growth potential. Onto Innovation’s consensus target is slightly below its current price of 202.21 USD, indicating cautious optimism.
Analyst Opinions Comparison
This section compares analysts’ ratings and grades for NVIDIA Corporation and Onto Innovation Inc.:
Rating Comparison
NVIDIA Corporation Rating
- Rating: B+, assessed as Very Favorable overall
- Discounted Cash Flow Score: 3, indicating a Moderate valuation
- ROE Score: 5, signifying Very Favorable profit generation from equity
- ROA Score: 5, showing Very Favorable asset utilization
- Debt To Equity Score: 3, representing Moderate financial risk
- Overall Score: 3, classified as Moderate
Onto Innovation Inc. Rating
- Rating: B+, assessed as Very Favorable overall
- Discounted Cash Flow Score: 3, indicating a Moderate valuation
- ROE Score: 3, reflecting Moderate profit generation from equity
- ROA Score: 4, indicating a Favorable asset utilization
- Debt To Equity Score: 4, indicating Favorable financial risk
- Overall Score: 3, classified as Moderate
Which one is the best rated?
Both NVIDIA and Onto share the same overall rating of B+ and an identical overall score of 3, indicating moderate standing. However, NVIDIA scores higher on ROE and ROA, while Onto has a better debt-to-equity score, reflecting differences in profitability versus financial risk.
Scores Comparison
Here is a comparison of the Altman Z-Score and Piotroski Score for NVIDIA and Onto Innovation:
NVIDIA Scores
- Altman Z-Score: 68.04, indicating a safe zone status.
- Piotroski Score: 6, reflecting an average financial strength.
Onto Innovation Scores
- Altman Z-Score: 34.16, also indicating safe zone.
- Piotroski Score: 4, reflecting an average financial strength.
Which company has the best scores?
Both NVIDIA and Onto Innovation have Altman Z-Scores in the safe zone, with NVIDIA’s score substantially higher. In Piotroski Scores, NVIDIA’s 6 surpasses Onto’s 4, indicating relatively stronger financial health for NVIDIA based on these metrics.
Grades Comparison
Here is a detailed comparison of the recent grades assigned by reputable grading companies for NVIDIA Corporation and Onto Innovation Inc.:
NVIDIA Corporation Grades
The table below shows the latest grades assigned to NVIDIA Corporation by various grading companies.
| Grading Company | Action | New Grade | Date |
|---|---|---|---|
| Mizuho | Maintain | Outperform | 2026-01-09 |
| Truist Securities | Maintain | Buy | 2025-12-29 |
| Stifel | Maintain | Buy | 2025-12-29 |
| B of A Securities | Maintain | Buy | 2025-12-26 |
| Baird | Maintain | Outperform | 2025-12-26 |
| Bernstein | Maintain | Outperform | 2025-12-26 |
| Truist Securities | Maintain | Buy | 2025-12-19 |
| Tigress Financial | Maintain | Strong Buy | 2025-12-18 |
| Morgan Stanley | Maintain | Overweight | 2025-12-01 |
| Deutsche Bank | Maintain | Hold | 2025-11-20 |
Overall, NVIDIA’s grades predominantly reflect a strong buying sentiment, with multiple “Buy” and “Outperform” ratings and one “Strong Buy,” indicating generally positive analyst confidence.
Onto Innovation Inc. Grades
The table below details the recent grades assigned to Onto Innovation Inc. by recognized grading firms.
| Grading Company | Action | New Grade | Date |
|---|---|---|---|
| Needham | Maintain | Buy | 2026-01-06 |
| Jefferies | Maintain | Buy | 2025-12-15 |
| Needham | Maintain | Buy | 2025-11-18 |
| B. Riley Securities | Maintain | Buy | 2025-11-18 |
| Evercore ISI Group | Maintain | Outperform | 2025-11-05 |
| Oppenheimer | Maintain | Outperform | 2025-10-14 |
| Stifel | Maintain | Hold | 2025-10-13 |
| B. Riley Securities | Maintain | Buy | 2025-10-10 |
| Jefferies | Upgrade | Buy | 2025-09-23 |
| Benchmark | Maintain | Buy | 2025-08-08 |
Onto Innovation’s grades mainly indicate a positive outlook with multiple “Buy” and “Outperform” ratings, and a recent upgrade from “Hold” to “Buy,” reflecting improving analyst sentiment.
Which company has the best grades?
NVIDIA Corporation has received a larger volume of “Buy” and “Outperform” grades, including a “Strong Buy,” while Onto Innovation Inc. shows a consistent “Buy” and “Outperform” consensus but fewer total ratings. Investors might view NVIDIA’s broader analyst support as reflecting higher confidence, although both companies maintain positive outlooks.
Strengths and Weaknesses
Below is a comparative overview of the strengths and weaknesses of NVIDIA Corporation and Onto Innovation Inc. based on recent financial performance and market positioning.
| Criterion | NVIDIA Corporation | Onto Innovation Inc. |
|---|---|---|
| Diversification | Highly diversified with strong segments in Data Center ($115B), Gaming ($11.35B), Automotive ($1.7B), and Professional Visualization ($1.88B) | Less diversified, mainly focused on Systems and Software ($850M), Parts ($76M), and Services ($60M) |
| Profitability | Very high net margin (56%) and ROIC (75%), indicating strong profitability | Moderate net margin (20%) and ROIC (9%), profitability improving but still modest |
| Innovation | Leading in AI, GPUs, and data center technologies with rapidly growing ROIC (340% increase) | Growing ROIC trend (344%) but currently value-destroying, indicating innovation yet to translate fully to profits |
| Global presence | Extensive global reach with dominant market share in GPU and AI sectors | Smaller global presence, more niche industrial instrumentation market |
| Market Share | Large market share in GPUs, AI, and data centers, sustained by strong competitive moat | Smaller, specialized market share with potential for growth but currently limited |
NVIDIA’s key strengths lie in its diversified revenue streams and dominant market position with exceptional profitability and a durable competitive advantage. Onto Innovation shows promising growth and innovation but currently struggles with profitability and scale, indicating higher investment risk.
Risk Analysis
Below is a comparative table of key risks for NVIDIA Corporation and Onto Innovation Inc. based on the most recent data available in 2026:
| Metric | NVIDIA Corporation | Onto Innovation Inc. |
|---|---|---|
| Market Risk | High beta (2.31) indicates high market volatility risk | Moderate beta (1.46) shows medium market sensitivity |
| Debt level | Low debt-to-equity (0.13), low debt-to-assets (9.2%) | Very low debt-to-equity (0.01), very low debt-to-assets (0.72%) |
| Regulatory Risk | Moderate, due to global operations and tech sector regulations | Moderate, focused on semiconductor manufacturing compliance |
| Operational Risk | High complexity in AI & automotive sectors; supply chain dependencies | Moderate, reliant on specialized process control technology |
| Environmental Risk | Moderate; semiconductor manufacturing has environmental impacts | Moderate; similar industry environmental concerns |
| Geopolitical Risk | High, due to global exposure including Taiwan and China markets | Moderate, primarily US based but industry subject to global trade tensions |
The most impactful risks for NVIDIA are its high market volatility and geopolitical exposure, particularly linked to semiconductor supply chains in Asia. Onto Innovation’s risks are lower in scale but include operational dependence on niche markets and moderate regulatory challenges. Both companies maintain low debt levels, reducing financial risk.
Which Stock to Choose?
NVIDIA Corporation (NVDA) exhibits a strong income evolution with a 682.59% revenue growth over five years and a 1582.36% net income increase. Its profitability is high, marked by a 55.85% net margin and a 91.87% ROE, supported by low debt and a very favorable overall rating (B+).
Onto Innovation Inc. (ONTO) shows moderate income growth with a 77.42% revenue increase and a 550.02% net income rise over five years. Profitability is lower, with a 20.43% net margin and 10.47% ROE. Its debt is minimal, and it holds a very favorable rating (B+), though with more neutral financial ratios.
For investors, NVDA might appear more suitable for those seeking robust growth and high profitability, supported by a durable competitive advantage and very favorable ratings. ONTO could be more appealing for those valuing moderate growth with lower financial leverage and a stable but less pronounced profitability profile.
Disclaimer: Investment carries a risk of loss of initial capital. The past performance is not a reliable indicator of future results. Be sure to understand risks before making an investment decision.
Go Further
I encourage you to read the complete analyses of NVIDIA Corporation and Onto Innovation Inc. to enhance your investment decisions: