The semiconductor industry remains a cornerstone of technological advancement, with NVIDIA Corporation and ON Semiconductor Corporation standing out as key players. NVIDIA excels in graphics processing and AI-driven computing, while ON Semiconductor focuses on power solutions and intelligent sensing, especially for automotive electrification. Their overlapping yet distinct innovation strategies make this comparison compelling. In this article, I will help you identify which company presents the most attractive investment opportunity in 2026.

Table of contents
Companies Overview
I will begin the comparison between NVIDIA and ON Semiconductor by providing an overview of these two companies and their main differences.
NVIDIA Overview
NVIDIA Corporation focuses on providing advanced graphics, compute, and networking solutions globally. Its product portfolio includes GPUs for gaming, professional visualization, and data center applications, as well as software platforms for AI, virtual computing, and autonomous vehicles. Headquartered in Santa Clara, California, NVIDIA serves a diverse client base, including OEMs, cloud providers, automotive manufacturers, and start-ups, positioning itself as a key player in semiconductors and AI technologies.
ON Semiconductor Overview
ON Semiconductor Corporation delivers intelligent sensing and power solutions worldwide, emphasizing electrification for automotive and sustainable energy markets. Its offerings include analog and mixed-signal semiconductors, power modules, image sensors, and ASICs designed to support electric vehicles, fast-charging systems, and industrial power applications. Based in Scottsdale, Arizona, ON Semiconductor operates through multiple segments and serves various end-markets, focusing on energy efficiency and sensor technologies.
Key similarities and differences
Both NVIDIA and ON Semiconductor operate in the semiconductor industry, providing technology solutions essential for automotive and industrial applications. NVIDIA emphasizes high-performance graphics, AI, and networking platforms, while ON Semiconductor concentrates on power management, sensing, and electrification technologies. The companies differ significantly in scale, with NVIDIA’s market cap exceeding $4.4T compared to ON’s $25B, reflecting their distinct market positions and product focuses within the technology sector.
Income Statement Comparison
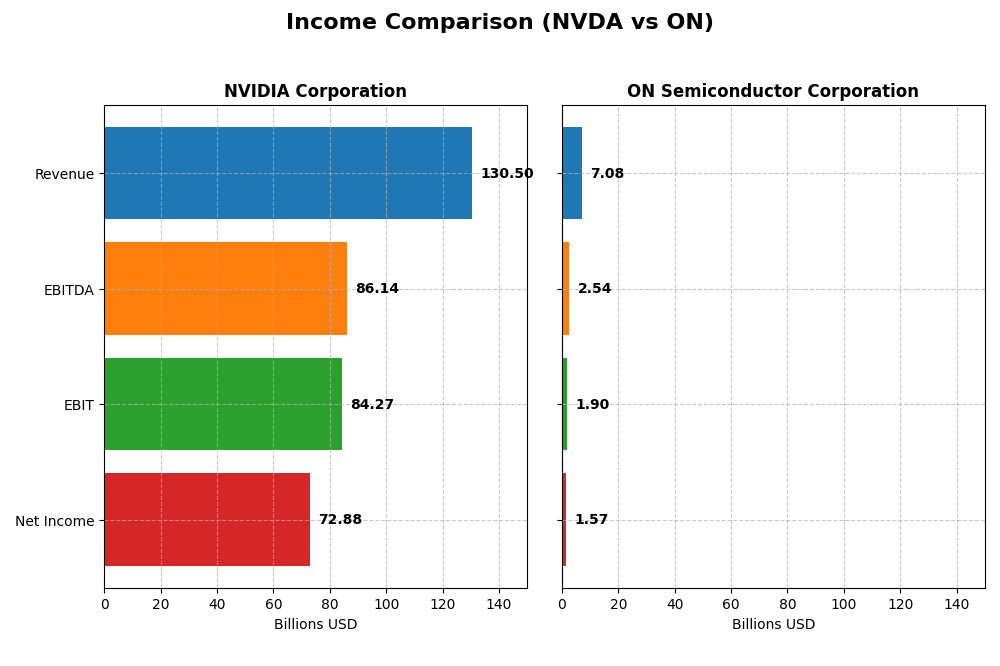
Below is a comparison of the most recent fiscal year income statement metrics for NVIDIA Corporation and ON Semiconductor Corporation.
| Metric | NVIDIA Corporation | ON Semiconductor Corporation |
|---|---|---|
| Market Cap | 4.46T | 24.8B |
| Revenue | 130.5B | 7.08B |
| EBITDA | 86.1B | 2.54B |
| EBIT | 84.3B | 1.90B |
| Net Income | 72.9B | 1.57B |
| EPS | 2.97 | 3.68 |
| Fiscal Year | 2025 | 2024 |
Income Statement Interpretations
NVIDIA Corporation
NVIDIA demonstrated robust revenue growth from $16.7B in 2021 to $130.5B in 2025, with net income rising strongly from $4.3B to $72.9B. Margins improved significantly, with a gross margin near 75% and net margin exceeding 55% in 2025. The latest fiscal year showed exceptional growth rates, including a 114% revenue increase, reflecting accelerated profitability and operational efficiency.
ON Semiconductor Corporation
ON Semiconductor’s revenue increased moderately over the 2020-2024 period, peaking at $8.3B in 2023 before declining to $7.1B in 2024. Net income followed a similar trend, rising from $234M in 2020 to $2.2B in 2023, then falling to $1.57B in 2024. Margins remain favorable but lower than NVIDIA’s, with net margin around 22% in 2024; recent revenue and earnings growth slowed, showing negative growth rates in the latest year.
Which one has the stronger fundamentals?
NVIDIA exhibits stronger fundamentals with higher and expanding margins, robust revenue, and net income growth, reflecting superior profitability and scale. ON Semiconductor, while profitable with decent margins, experienced a recent decline in revenue and net income growth. Overall, NVIDIA’s income statement portrays a more consistently favorable financial trajectory compared to ON’s mixed recent performance.
Financial Ratios Comparison
The table below compares key financial ratios for NVIDIA Corporation and ON Semiconductor Corporation based on their most recent fiscal year data, facilitating a straightforward side-by-side analysis.
| Ratios | NVIDIA Corporation (2025) | ON Semiconductor Corporation (2024) |
|---|---|---|
| ROE | 91.87% | 17.88% |
| ROIC | 75.28% | 11.88% |
| P/E | 39.90 | 17.13 |
| P/B | 36.66 | 3.06 |
| Current Ratio | 4.44 | 5.06 |
| Quick Ratio | 3.88 | 3.38 |
| D/E (Debt-to-Equity) | 0.13 | 0.38 |
| Debt-to-Assets | 9.20% | 23.90% |
| Interest Coverage | 330.0 | 28.37 |
| Asset Turnover | 1.17 | 0.50 |
| Fixed Asset Turnover | 16.16 | 1.61 |
| Payout Ratio | 1.14% | 0% |
| Dividend Yield | 0.029% | 0% |
Interpretation of the Ratios
NVIDIA Corporation
NVIDIA shows a strong financial profile with favorable net margin (55.85%), ROE (91.87%), and ROIC (75.28%), indicating excellent profitability and capital efficiency. However, high valuation multiples like PE (39.9) and PB (36.66) and an elevated current ratio (4.44) raise caution. Dividend yield is low at 0.03%, reflecting minimal shareholder payout.
ON Semiconductor Corporation
ON Semiconductor demonstrates decent profitability with net margin at 22.21%, ROE at 17.88%, and ROIC at 11.88%, though these are modest compared to NVIDIA. The company has a slightly favorable overall ratio profile, with a neutral PE (17.13). It does not pay dividends, likely focusing resources on growth and R&D, with no current shareholder distributions.
Which one has the best ratios?
NVIDIA holds the advantage in profitability and capital returns, supported by strong efficiency ratios despite some unfavorable valuation metrics. ON Semiconductor’s ratios are more moderate with balanced leverage and liquidity, but lower profitability. Overall, NVIDIA presents a more favorable ratio profile, while ON shows a slightly favorable but more cautious outlook.
Strategic Positioning
This section compares the strategic positioning of NVIDIA Corporation and ON Semiconductor Corporation including Market position, Key segments, and exposure to disruption:
NVIDIA Corporation
- Leading semiconductor firm with a market cap of 4.46T USD, facing intense competition in high-growth AI and gaming markets.
- Key segments include Data Center (115B USD), Gaming (11.35B USD), Automotive (1.69B USD), and Professional Visualization, driving diversified growth.
- Exposure to technological disruption via AI, accelerated computing, and virtual worlds platforms, with strategic collaborations for innovation.
ON Semiconductor Corporation
- Smaller player with a market cap of 25B USD, operating under moderate competitive pressure in power and sensing semiconductors.
- Focused on Power Solutions (3.35B USD), Analog Solutions (2.61B USD), and Intelligent Sensing (1.13B USD), centered on electrification and sensing.
- Faces disruption in electrification and sustainable energy sectors, developing analog and sensing technologies for automotive and industrial applications.
NVIDIA Corporation vs ON Semiconductor Corporation Positioning
NVIDIA pursues a diversified strategy across AI, gaming, and automotive sectors, benefiting from large-scale innovation. ON Semiconductor concentrates on power and sensing solutions, focusing on automotive electrification, with less market breadth but targeted growth drivers.
Which has the best competitive advantage?
NVIDIA holds a very favorable moat with strong ROIC growth and significant value creation, signaling a durable competitive advantage. ON Semiconductor shows slightly favorable moat with improving profitability but currently lacks a strong competitive edge.
Stock Comparison
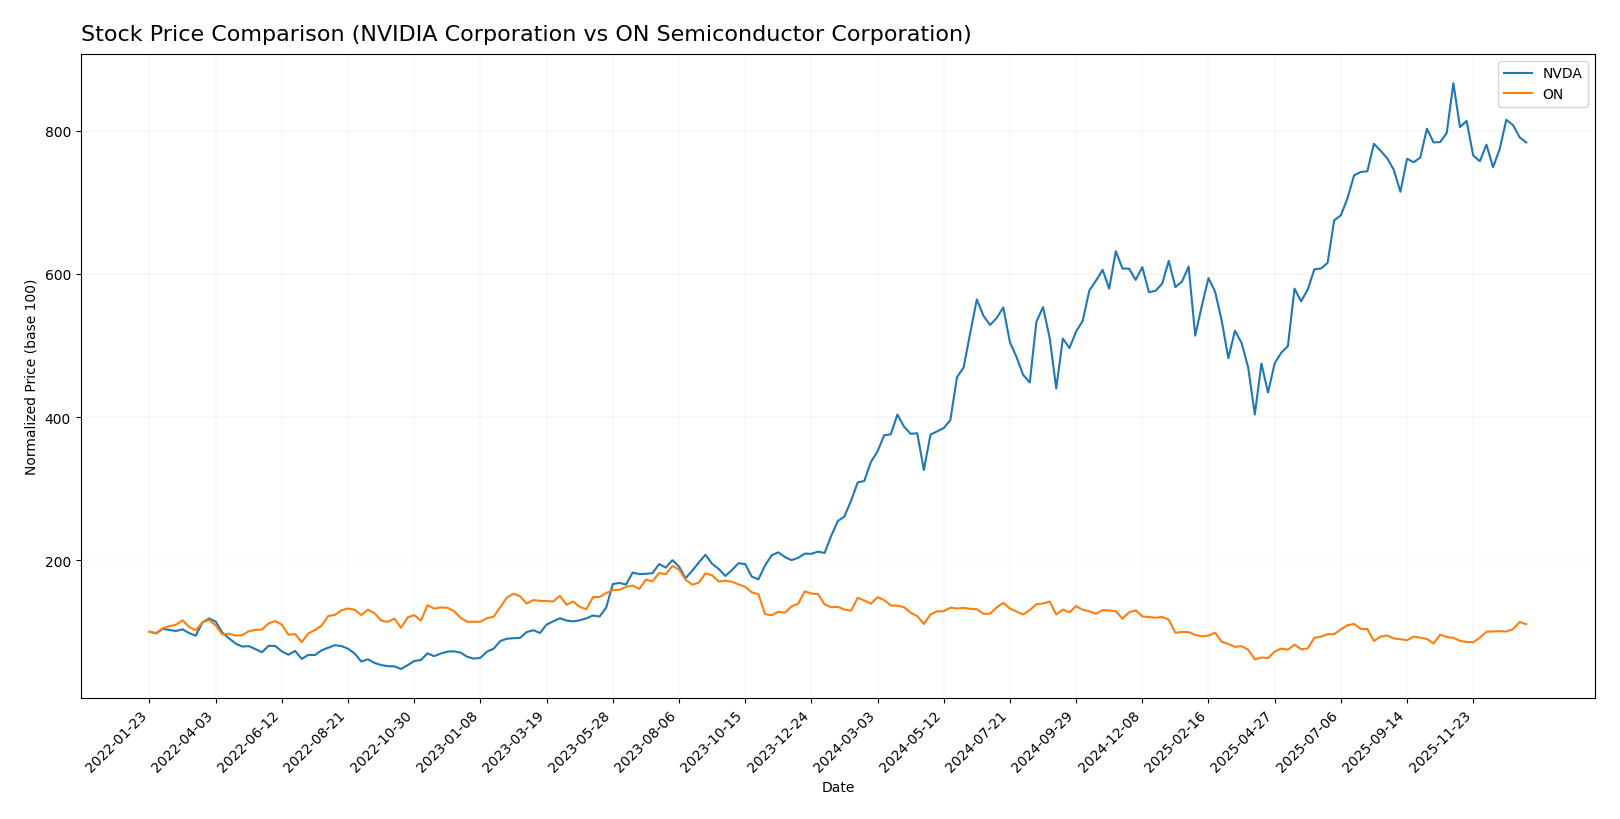
The stock price chart over the past 12 months reveals NVIDIA Corporation’s strong bullish momentum despite recent deceleration, while ON Semiconductor Corporation exhibits an overall bearish trajectory with signs of recent recovery.
Trend Analysis
NVIDIA Corporation’s stock price increased by 132.35% over the past year, indicating a bullish trend with decelerating momentum. The price ranged from 76.2 to 202.49, showing significant volatility with a standard deviation of 32.46.
ON Semiconductor Corporation experienced a 20.49% decline over the same period, reflecting a bearish trend with accelerating downward movement. The stock price fluctuated between 33.7 and 81.14, with a standard deviation of 11.97.
Comparing both stocks, NVIDIA delivered the highest market performance with a strong bullish trend, while ON showed a negative overall return despite recent gains.
Target Prices
The consensus target prices for NVIDIA Corporation and ON Semiconductor Corporation reflect optimistic analyst expectations for both stocks.
| Company | Target High | Target Low | Consensus |
|---|---|---|---|
| NVIDIA Corporation | 352 | 140 | 264.34 |
| ON Semiconductor Corporation | 64 | 51 | 58.33 |
Analysts foresee NVIDIA’s price moving significantly higher than its current 183.14 USD, while ON Semiconductor’s consensus target price is slightly below its current 60.58 USD, indicating mixed short-term sentiment.
Analyst Opinions Comparison
This section compares analysts’ ratings and grades for NVIDIA Corporation and ON Semiconductor Corporation:
Rating Comparison
NVIDIA Corporation Rating
- Rating: B+ indicating a very favorable outlook.
- Discounted Cash Flow Score: 3, assessed as moderate.
- ROE Score: 5, very favorable, showing efficient profit generation.
- ROA Score: 5, very favorable, demonstrating effective asset use.
- Debt To Equity Score: 3, moderate financial risk.
- Overall Score: 3, moderate financial standing.
ON Semiconductor Corporation Rating
- Rating: B- indicating a very favorable outlook.
- Discounted Cash Flow Score: 3, assessed as moderate.
- ROE Score: 2, moderate, reflecting lower efficiency.
- ROA Score: 3, moderate, indicating average asset utilization.
- Debt To Equity Score: 2, moderate, slightly better balance sheet strength.
- Overall Score: 2, moderate financial standing.
Which one is the best rated?
Based strictly on provided data, NVIDIA has higher ratings in ROE and ROA, and a better overall score, while ON Semiconductor scores slightly better in debt to equity. Overall, NVIDIA is rated more favorably.
Scores Comparison
Here is a comparison of the financial scores for NVIDIA Corporation and ON Semiconductor Corporation:
NVDA Scores
- Altman Z-Score: 68.04, indicating a strong safe zone.
- Piotroski Score: 6, reflecting average financial health.
ON Scores
- Altman Z-Score: 4.84, also in the safe zone.
- Piotroski Score: 6, reflecting average financial health.
Which company has the best scores?
Both NVIDIA and ON Semiconductor are in the safe zone for Altman Z-Score, with NVIDIA’s score significantly higher. Their Piotroski Scores are equal at 6, indicating similar average financial strength. Overall, NVIDIA shows a stronger financial stability by Altman’s measure.
Grades Comparison
Here is a comparison of the latest professional grades assigned to NVIDIA Corporation and ON Semiconductor Corporation:
NVIDIA Corporation Grades
The table below presents recent grades from reputable financial institutions for NVIDIA Corporation.
| Grading Company | Action | New Grade | Date |
|---|---|---|---|
| Mizuho | Maintain | Outperform | 2026-01-09 |
| Truist Securities | Maintain | Buy | 2025-12-29 |
| Stifel | Maintain | Buy | 2025-12-29 |
| B of A Securities | Maintain | Buy | 2025-12-26 |
| Baird | Maintain | Outperform | 2025-12-26 |
| Bernstein | Maintain | Outperform | 2025-12-26 |
| Truist Securities | Maintain | Buy | 2025-12-19 |
| Tigress Financial | Maintain | Strong Buy | 2025-12-18 |
| Morgan Stanley | Maintain | Overweight | 2025-12-01 |
| Deutsche Bank | Maintain | Hold | 2025-11-20 |
NVIDIA’s grades predominantly indicate strong positive sentiment, with multiple “Buy” and “Outperform” ratings and a few “Hold” ratings, reflecting overall confidence.
ON Semiconductor Corporation Grades
The table below shows recent grades from established grading companies for ON Semiconductor Corporation.
| Grading Company | Action | New Grade | Date |
|---|---|---|---|
| Piper Sandler | Maintain | Overweight | 2026-01-07 |
| Truist Securities | Maintain | Hold | 2025-12-19 |
| Morgan Stanley | Maintain | Equal Weight | 2025-11-24 |
| Truist Securities | Maintain | Hold | 2025-11-04 |
| Baird | Maintain | Neutral | 2025-11-04 |
| Rosenblatt | Maintain | Neutral | 2025-11-04 |
| Morgan Stanley | Maintain | Equal Weight | 2025-11-04 |
| TD Cowen | Maintain | Buy | 2025-11-04 |
| UBS | Maintain | Neutral | 2025-10-27 |
| B of A Securities | Maintain | Neutral | 2025-09-05 |
ON Semiconductor grades mostly range from “Hold”/”Neutral” to “Overweight” with only one “Buy,” indicating a more cautious market view compared to NVIDIA.
Which company has the best grades?
NVIDIA Corporation has received a higher concentration of favorable grades such as “Buy,” “Outperform,” and “Strong Buy,” indicating stronger positive analyst sentiment. ON Semiconductor’s grades are more mixed and generally more conservative. This disparity may influence investors’ perception of growth potential and risk between the two stocks.
Strengths and Weaknesses
Below is a comparison of key strengths and weaknesses for NVIDIA Corporation (NVDA) and ON Semiconductor Corporation (ON) based on the most recent financial and operational data.
| Criterion | NVIDIA Corporation (NVDA) | ON Semiconductor Corporation (ON) |
|---|---|---|
| Diversification | Highly diversified with major revenue from Data Center ($115B), Gaming ($11.35B), Automotive ($1.69B), and Professional Visualization ($1.88B) | Moderately diversified across Power Solutions ($3.35B), Analog Solutions ($2.61B), and Intelligent Sensing ($1.13B) |
| Profitability | Very high net margin of 55.85%, ROIC 75.28%, ROE 91.87%, indicating strong profitability and efficient capital use | Good profitability with net margin 22.21%, ROIC 11.88%, ROE 17.88%, showing positive but lower margins than NVDA |
| Innovation | Leading innovation evidenced by growing ROIC trend (340%) and strong economic moat status | Improving innovation with growing ROIC trend (156%) but still only slightly favorable moat status |
| Global presence | Strong global presence supported by leadership in data centers and gaming markets | Global reach with emphasis on power and analog semiconductor markets, growing but less dominant |
| Market Share | Dominant market share in GPUs and data center chips, rapidly expanding automotive segment | Competitive in power and analog semiconductors but smaller share compared to NVDA in high-growth segments |
NVIDIA stands out with exceptional profitability, a durable competitive advantage, and significant diversification in high-growth areas like data centers and gaming. ON Semiconductor shows promising growth and improving profitability but remains less diversified and with a narrower moat. Investors should weigh NVDA’s premium valuation against its strong fundamentals and ON’s potential for value creation as it scales.
Risk Analysis
Below is a comparative risk table for NVIDIA Corporation (NVDA) and ON Semiconductor Corporation (ON) based on the most recent 2025-2024 data.
| Metric | NVIDIA Corporation (NVDA) | ON Semiconductor Corporation (ON) |
|---|---|---|
| Market Risk | High beta 2.31, volatile price range (86.62-212.19) | Moderate beta 1.54, price range 31.04-63.63 |
| Debt level | Low debt-to-equity 0.13, debt/assets 9.2% (favorable) | Moderate debt-to-equity 0.38, debt/assets 23.9% (favorable) |
| Regulatory Risk | Moderate, global tech sector scrutiny and export controls | Moderate, automotive and energy sectors face evolving regulations |
| Operational Risk | High complexity in AI, data center, and automotive segments | Diverse product lines but less operational complexity |
| Environmental Risk | Moderate, growing focus on sustainable tech manufacturing | Moderate, emphasis on electrification and sustainable energy solutions |
| Geopolitical Risk | High exposure to Taiwan and China markets | Moderate exposure, mainly US-based with global sales |
NVIDIA’s high market volatility and geopolitical exposure, particularly in Taiwan and China, represent the most impactful risks. ON Semiconductor’s risks are more balanced but include regulatory and debt considerations due to its automotive and power solutions focus. Both companies maintain solid financial health, but investors should carefully monitor geopolitical tensions and sector-specific regulatory changes.
Which Stock to Choose?
NVIDIA Corporation (NVDA) exhibits a strong income evolution with a 114.2% revenue growth in one year and a 682.6% increase over five years. Its financial ratios are mostly favorable, including a high ROE of 91.9% and low debt levels. Profitability is robust with a 55.9% net margin, and its rating stands at a very favorable B+.
ON Semiconductor Corporation (ON) shows mixed income trends, with a recent 14.2% revenue decline but a 34.8% growth over five years. Its financial ratios are slightly favorable overall, featuring a 17.9% ROE and moderate debt. Profitability is more modest with a 22.2% net margin, and it holds a very favorable B- rating.
For investors prioritizing strong profitability and durable competitive advantages, NVDA might appear more favorable due to its higher rating and superior income and ratio metrics. Meanwhile, ON could be seen as more suitable for those open to moderate risk with an interest in a company showing improving profitability despite recent setbacks.
Disclaimer: Investment carries a risk of loss of initial capital. The past performance is not a reliable indicator of future results. Be sure to understand risks before making an investment decision.
Go Further
I encourage you to read the complete analyses of NVIDIA Corporation and ON Semiconductor Corporation to enhance your investment decisions: