Home > Comparison > Technology > NVDA vs NXPI
The strategic rivalry between NVIDIA Corporation and NXP Semiconductors defines the current trajectory of the semiconductor sector. NVIDIA operates as a high-growth innovator focused on GPUs and AI-driven data center solutions. In contrast, NXP Semiconductors emphasizes diversified semiconductor products with strong automotive and IoT applications. This analysis will clarify which company’s operational model offers superior risk-adjusted returns for a balanced, technology-focused portfolio.
Table of contents
Companies Overview
NVIDIA and NXP Semiconductors shape critical segments of the global semiconductor industry in 2026.
NVIDIA Corporation: Leader in AI-Driven Graphics and Computing
NVIDIA dominates the semiconductor space with its graphics and AI compute platforms. It generates revenue through GeForce GPUs, data center AI systems, and automotive AI solutions. In 2026, NVIDIA sharpens its strategic focus on expanding AI infrastructure and virtual worlds creation, leveraging its Omniverse software and accelerated computing technologies.
NXP Semiconductors N.V.: Specialist in Embedded and Connectivity Solutions
NXP Semiconductors excels in microcontrollers and wireless connectivity for automotive and industrial IoT markets. Its revenue streams rely on application processors, RF power amplifiers, and security controllers. In 2026, NXP prioritizes advancing secure connectivity and embedded sensor technologies, targeting automotive and communication infrastructure growth.
Strategic Collision: Similarities & Divergences
NVIDIA pursues an AI-centric, high-performance computing ecosystem, while NXP focuses on embedded systems and secure connectivity. Their competition converges in automotive tech and industrial IoT but diverges by NVIDIA’s emphasis on AI platforms versus NXP’s sensor and communication solutions. Investors face distinct profiles: NVIDIA offers growth in AI innovation, NXP provides stability through diversified embedded systems.
Income Statement Comparison
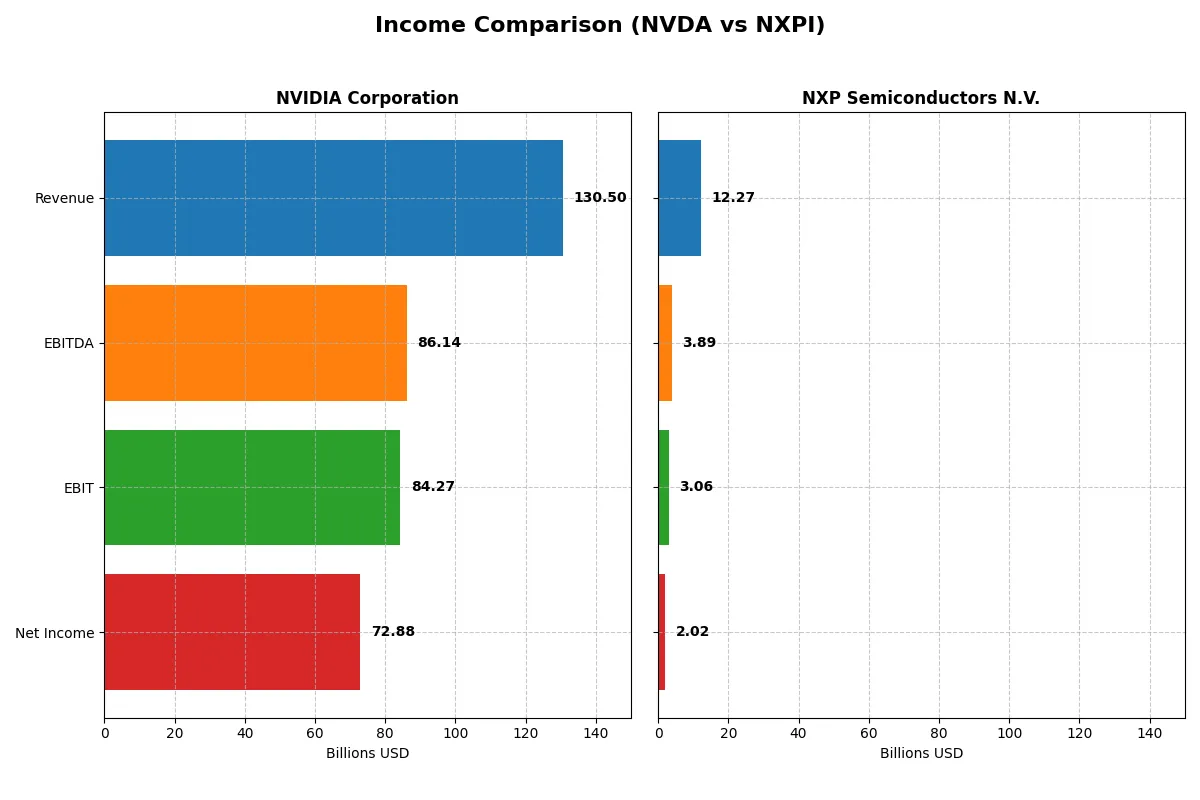
The following data dissects the core profitability and scalability of both corporate engines to reveal who dominates the bottom line:
| Metric | NVIDIA Corporation (NVDA) | NXP Semiconductors N.V. (NXPI) |
|---|---|---|
| Revenue | 130.5B | 12.3B |
| Cost of Revenue | 32.6B | 5.6B |
| Operating Expenses | 16.4B | 3.4B |
| Gross Profit | 97.9B | 6.7B |
| EBITDA | 86.1B | 3.9B |
| EBIT | 84.3B | 3.1B |
| Interest Expense | 0.25B | 0.38B |
| Net Income | 72.9B | 2.0B |
| EPS | 2.97 | 8.00 |
| Fiscal Year | 2025 | 2025 |
Income Statement Analysis: The Bottom-Line Duel
This income statement comparison reveals how efficiently each company transforms revenue into profits, exposing their underlying corporate engine’s strength.
NVIDIA Corporation Analysis
NVIDIA’s revenue surged from $16.7B in 2021 to an impressive $130.5B in 2025, showcasing extraordinary growth momentum. Net income exploded from $4.3B to $72.9B, reflecting robust profitability expansion. Gross margins hold firm at 75%, while net margins climbed to 56%, highlighting outstanding margin health and operational efficiency in 2025.
NXP Semiconductors N.V. Analysis
NXP’s revenue modestly increased from $11.1B in 2021 to $12.3B in 2025 but showed slight decline in the latest year. Net income grew slowly to $2.0B, with net margins steady at 16.5%. Gross margins near 54% indicate decent cost control, yet recent margin contractions and negative one-year growth signal operational challenges.
Margin Dominance vs. Revenue Momentum
NVIDIA clearly outperforms with stellar revenue growth and superior margins, delivering outsized net income gains. NXP’s stable but slower expansion and thinner margins lag behind. For investors, NVIDIA’s profile of rapid scale and high profitability offers a more compelling fundamental growth story.
Financial Ratios Comparison
These vital ratios act as a diagnostic tool to expose the underlying fiscal health, valuation premiums, and capital efficiency of the companies analyzed:
| Ratios | NVIDIA Corporation (NVDA) | NXP Semiconductors N.V. (NXPI) |
|---|---|---|
| ROE | 91.87% | 20.10% |
| ROIC | 75.28% | 11.03% |
| P/E | 39.90 | 27.14 |
| P/B | 36.66 | 5.45 |
| Current Ratio | 4.44 | 2.05 |
| Quick Ratio | 3.88 | 1.38 |
| D/E | 0.13 | 1.22 |
| Debt-to-Assets | 9.20% | 46.02% |
| Interest Coverage | 329.77 | 8.62 |
| Asset Turnover | 1.17 | 0.46 |
| Fixed Asset Turnover | 16.16 | 4.12 |
| Payout Ratio | 1.14% | 50.72% |
| Dividend Yield | 0.03% | 1.87% |
| Fiscal Year | 2025 | 2025 |
Efficiency & Valuation Duel: The Vital Signs
Financial ratios act as the company’s DNA, exposing hidden risks and highlighting operational strengths that shape investor decisions.
NVIDIA Corporation
NVIDIA posts an exceptional 92% ROE and a strong 56% net margin, signaling elite profitability. However, its P/E near 40 marks the stock as expensive. The firm sustains shareholder value with minimal dividends, reinvesting heavily in R&D (around 10% of revenue) to fuel growth and maintain its competitive edge.
NXP Semiconductors N.V.
NXP delivers solid but more modest returns, with a 20% ROE and 16% net margin, reflecting steady efficiency. Its P/E of 27 suggests a stretched valuation, though less so than NVIDIA. NXP balances shareholder returns through a modest 1.87% dividend yield while investing in R&D at roughly 18% of revenue to drive future innovation.
Premium Valuation vs. Operational Safety
NVIDIA’s superior profitability and reinvestment strategy come with a higher valuation and some liquidity concerns. NXP offers a more conservative financial profile with moderate returns and stable dividends. Investors seeking high growth might favor NVIDIA’s aggressive model, while those preferring steadier income and valuation might lean toward NXP.
Which one offers the Superior Shareholder Reward?
I observe NVIDIA’s minimal dividend yield (~0.03%) and low payout ratio (~1.1%), signaling a growth-focused reinvestment strategy. Their free cash flow funds aggressive buybacks, enhancing shareholder value. NXP Semiconductors offers a higher dividend yield (~1.9%) with a payout ratio exceeding 50%, indicating income-oriented returns but less free cash for buybacks. NXP’s buyback activity is moderate, limiting total return upside. NVIDIA’s capital-light, high-ROIC model supports sustainable buybacks and reinvestment, promising stronger long-term total returns. I conclude NVIDIA delivers superior shareholder reward in 2026 due to its balanced growth and capital return strategy.
Comparative Score Analysis: The Strategic Profile
The radar chart reveals the fundamental DNA and trade-offs of NVIDIA Corporation and NXP Semiconductors N.V., highlighting their strategic strengths and weaknesses:
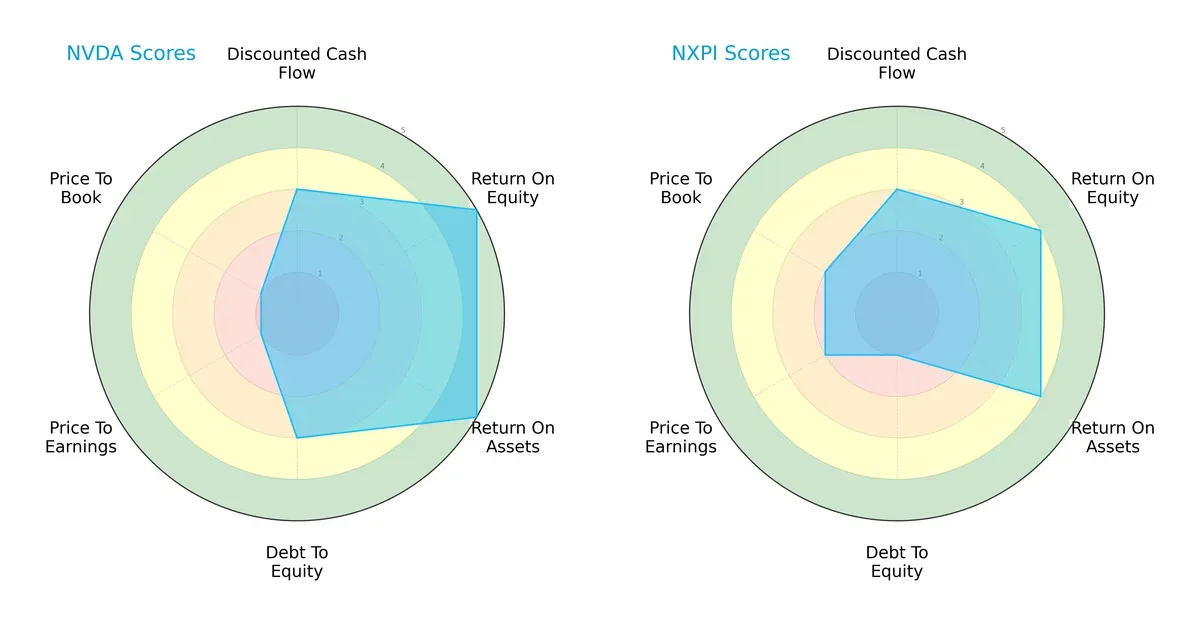
NVIDIA shows superior operational efficiency with top-tier ROE and ROA scores (5 each), indicating excellent capital and asset utilization. NXP lags slightly with scores of 4 in both metrics but exhibits a weaker debt profile (Debt/Equity score of 1 vs. 3 for NVIDIA), signaling higher leverage risk. Valuation metrics favor NXP moderately, scoring 2 on both P/E and P/B, while NVIDIA scores very low, suggesting potential overvaluation. Overall, NVIDIA offers a more balanced profile driven by operational excellence, whereas NXP relies on valuation appeal but carries financial risk.
Bankruptcy Risk: Solvency Showdown
The Altman Z-Score gap underscores a stark contrast in long-term survival prospects between these firms:
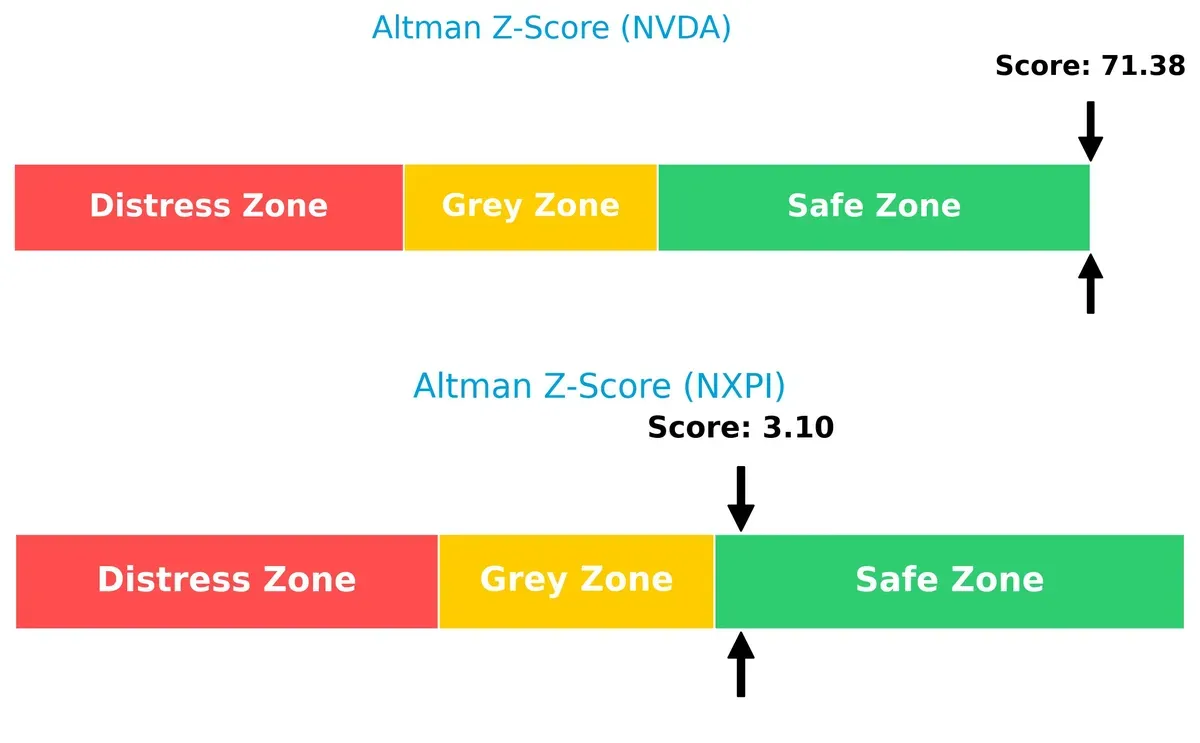
NVIDIA’s Altman Z-Score of 71.4 places it deep in the safe zone, reflecting exceptional solvency and resilience in this cycle. NXP’s score of 3.1 also resides in the safe zone but just above the threshold, indicating moderate financial stability with some caution warranted.
Financial Health: Quality of Operations
Piotroski F-Scores paint a picture of operational quality and internal financial health:
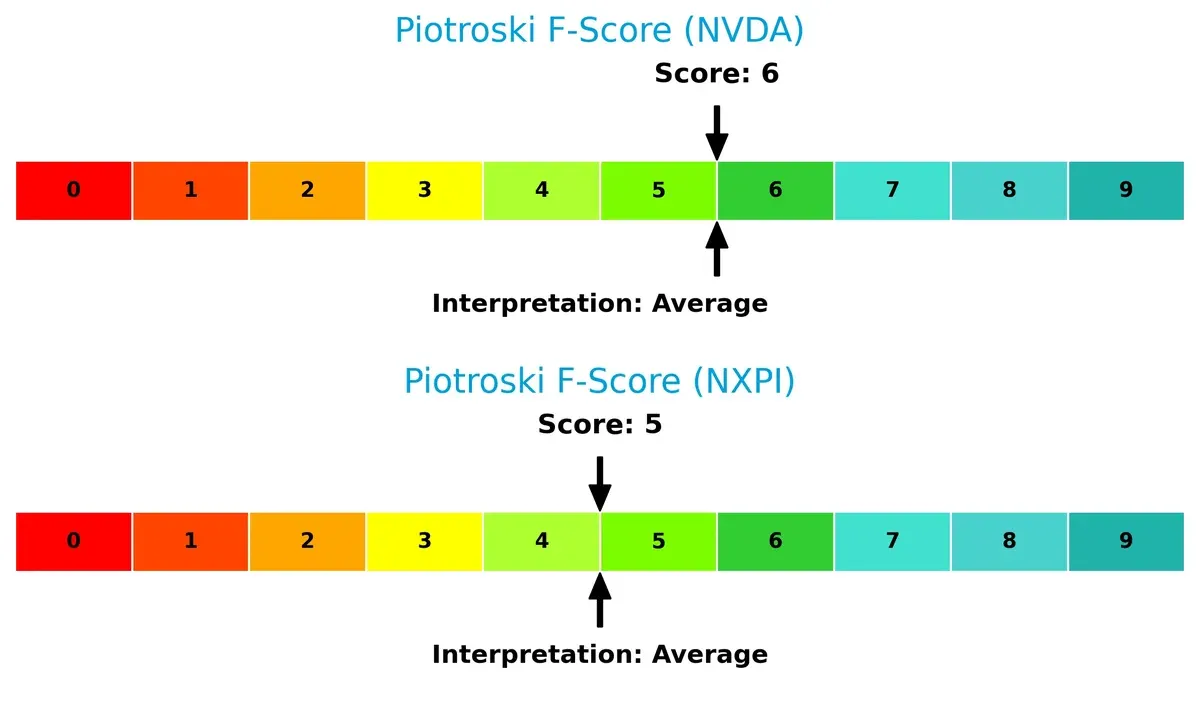
NVIDIA’s score of 6 signals solid financial health and competent internal metrics, whereas NXP’s 5 reflects a slightly weaker but still average condition. Neither company raises immediate red flags, but NVIDIA demonstrates stronger internal operational quality overall.
How are the two companies positioned?
This section dissects NVDA and NXPI’s operational DNA by comparing their revenue distribution and internal dynamics—strengths and weaknesses. The goal is to confront their economic moats and identify which business model offers the most resilient, sustainable advantage today.
Revenue Segmentation: The Strategic Mix
The following visual comparison dissects how NVIDIA Corporation and NXP Semiconductors diversify their income streams and where their primary sector bets lie:
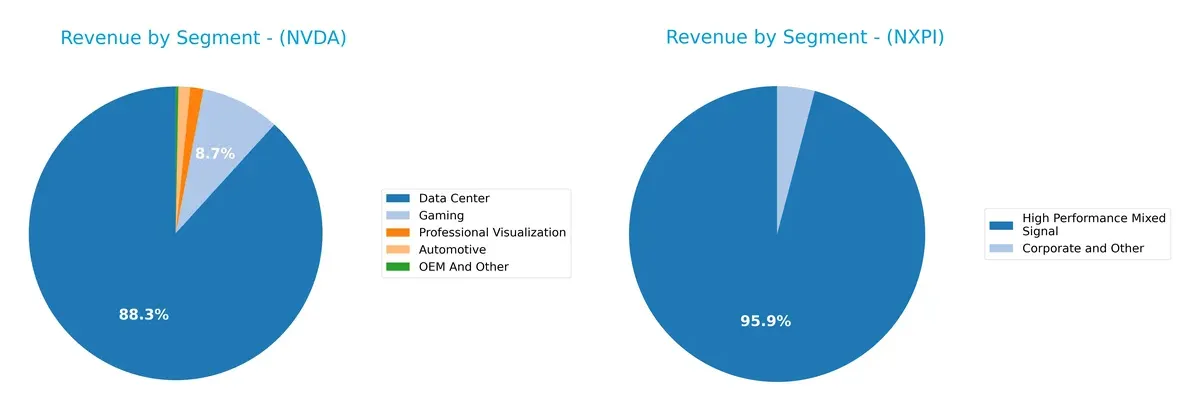
NVIDIA’s revenue dwarfs NXP’s, anchored by a colossal $115B Data Center segment in 2025. NVIDIA shows strong diversification with Gaming at $11.35B and Automotive at $1.69B. In contrast, NXP leans heavily on High Performance Mixed Signal at $9B, with minimal contribution from Corporate and Other. NVIDIA’s broad ecosystem lock-in contrasts with NXP’s narrower focus, exposing NXP to higher concentration risk but stable niche dominance.
Strengths and Weaknesses Comparison
This table compares the Strengths and Weaknesses of NVIDIA Corporation and NXP Semiconductors N.V.:
NVIDIA Corporation Strengths
- High net margin of 55.85%
- Exceptional ROE at 91.87%
- Strong ROIC at 75.28%
- Low debt-to-assets at 9.2%
- Diverse revenue from Data Center, Gaming, Automotive
- Significant US and Asia presence with $61B US revenue
NXP Semiconductors N.V. Strengths
- Solid net margin at 16.47%
- ROE of 20.1% indicates profitability
- Favorable current and quick ratios
- Diverse geographic sales including China, Europe, and US
- Stable high performance mixed signal product segment
- Moderate dividend yield at 1.87%
NVIDIA Corporation Weaknesses
- High valuation with PE of 39.9 and PB of 36.66
- Unfavorable current ratio at 4.44 may indicate liquidity concerns
- WACC at 14.73% exceeds ROIC cautioning cost of capital
- Minimal dividend yield at 0.03%
- Heavy reliance on Data Center segment
NXP Semiconductors N.V. Weaknesses
- Higher debt-to-equity at 1.22 signals leverage risk
- Asset turnover at 0.46 is low, showing less efficient asset use
- PE and PB ratios still unfavorable
- Debt-to-assets at 46.02% is relatively high
- Smaller presence in US compared to China and Europe
NVIDIA demonstrates superior profitability and financial strength, supported by a dominant Data Center segment and strong US-Asia exposure. NXP shows more balanced leverage and geographic diversification but faces efficiency and valuation challenges. Both companies reveal strategic priorities shaped by their financial health and market positioning.
The Moat Duel: Analyzing Competitive Defensibility
A structural moat is the only reliable barrier protecting long-term profits from relentless competitive erosion:
NVIDIA Corporation: Dominant Innovation & Ecosystem Lock-in
NVIDIA’s moat stems from cutting-edge AI and GPU technology combined with a robust ecosystem. Its 2025 ROIC outpaces WACC by over 60%, signaling strong value creation. Expansion into AI and autonomous vehicles will likely deepen this advantage.
NXP Semiconductors N.V.: Niche Integration & Automotive Focus
NXP relies on specialized automotive and IoT chips, contrasting NVIDIA’s broad AI dominance. Despite a slight ROIC decline and near breakeven versus WACC, NXP maintains steady margins. Future growth hinges on expanding automotive electrification and connectivity markets.
Verdict: Innovation Leadership vs. Specialized Market Focus
NVIDIA holds the wider and deeper moat with a soaring ROIC and accelerating profitability. It is better positioned to defend and expand market share against escalating competition than NXP, whose moat shows signs of erosion.
Which stock offers better returns?
Over the past 12 months, NVIDIA’s stock price more than doubled, showing strong gains but slowing momentum. In contrast, NXP Semiconductors declined overall despite recent price acceleration.
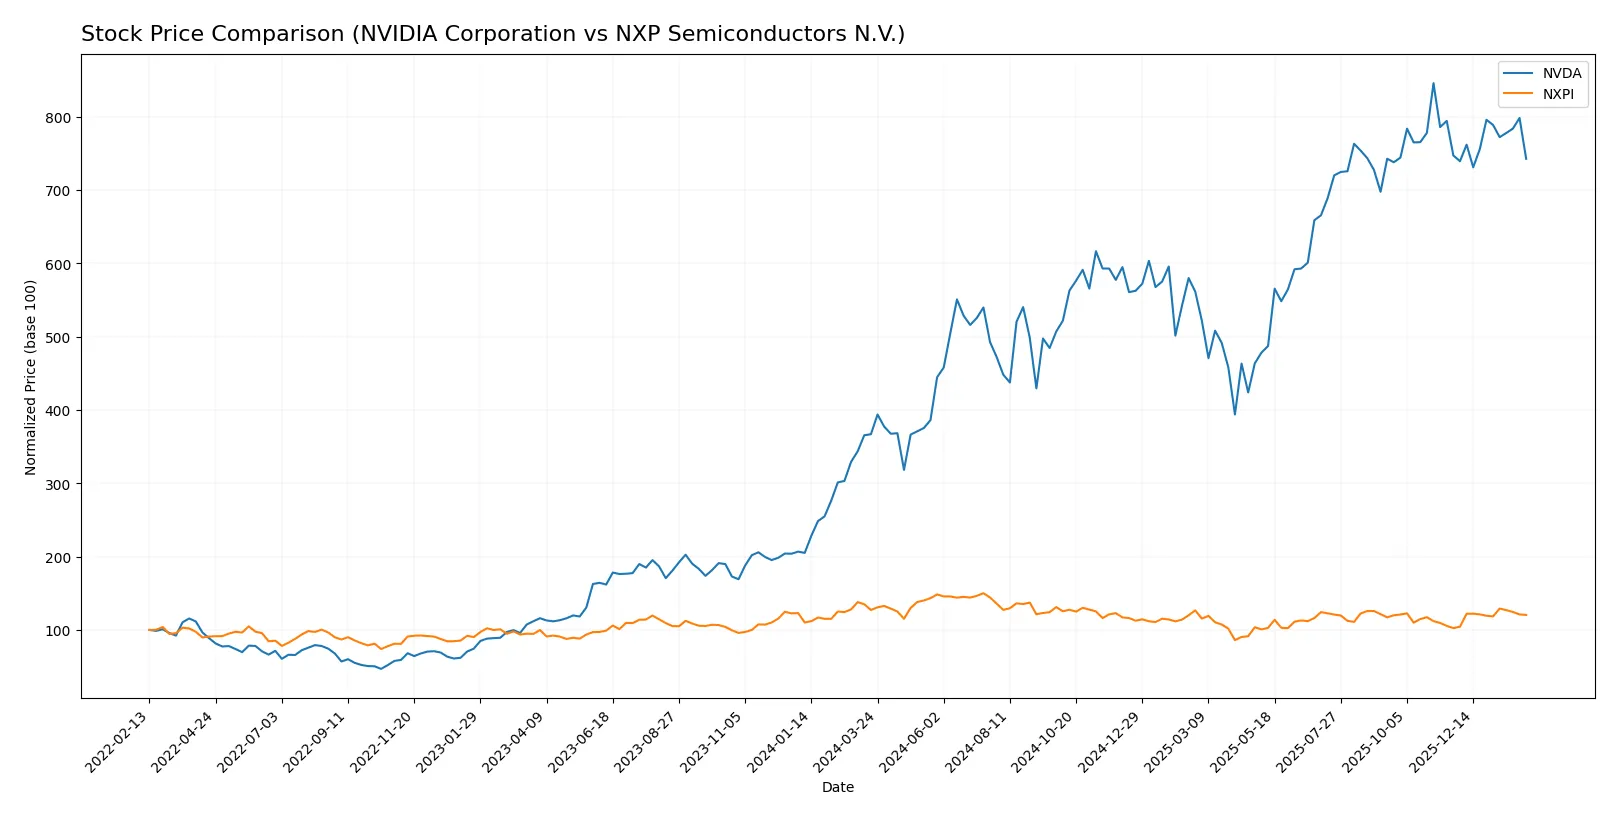
Trend Comparison
NVIDIA’s stock rose 102.41% over 12 months, marking a bullish trend with decelerating growth. Volatility was high, with prices ranging from 76.2 to 202.49.
NXP Semiconductors fell 5.31% over the same period, signaling a bearish trend but with accelerating downward pressure. The stock fluctuated between 160.81 and 280.19.
NVIDIA’s performance clearly outpaced NXP’s, delivering the highest market returns despite recent short-term stabilization for both.
Target Prices
Analysts show a bullish consensus for NVIDIA Corporation and NXP Semiconductors N.V.
| Company | Target Low | Target High | Consensus |
|---|---|---|---|
| NVIDIA Corporation | 140 | 352 | 265.21 |
| NXP Semiconductors N.V. | 215 | 280 | 249 |
NVIDIA’s consensus target of 265.21 suggests significant upside from the current 177.20 price. NXP’s target consensus at 249 also indicates room for appreciation above its current 225.73 level.

Don’t Let Luck Decide Your Entry Point
Optimize your entry points with our advanced ProRealTime indicators. You’ll get efficient buy signals with precise price targets for maximum performance. Start outperforming now!
How do institutions grade them?
Here is a comparison of recent institutional grades for NVIDIA Corporation and NXP Semiconductors N.V.:
NVIDIA Corporation Grades
The following table summarizes recent grades from reputable financial firms for NVIDIA Corporation.
| Grading Company | Action | New Grade | Date |
|---|---|---|---|
| Jefferies | Maintain | Buy | 2026-01-16 |
| Mizuho | Maintain | Outperform | 2026-01-09 |
| Truist Securities | Maintain | Buy | 2025-12-29 |
| Stifel | Maintain | Buy | 2025-12-29 |
| Baird | Maintain | Outperform | 2025-12-26 |
| Bernstein | Maintain | Outperform | 2025-12-26 |
| B of A Securities | Maintain | Buy | 2025-12-26 |
| Truist Securities | Maintain | Buy | 2025-12-19 |
| Tigress Financial | Maintain | Strong Buy | 2025-12-18 |
| Morgan Stanley | Maintain | Overweight | 2025-12-01 |
NXP Semiconductors N.V. Grades
Below is a summary of recent institutional grades for NXP Semiconductors N.V.
| Grading Company | Action | New Grade | Date |
|---|---|---|---|
| Mizuho | Maintain | Outperform | 2026-02-04 |
| Truist Securities | Maintain | Buy | 2026-02-04 |
| B of A Securities | Maintain | Buy | 2026-02-04 |
| Needham | Maintain | Buy | 2026-02-03 |
| Wells Fargo | Maintain | Overweight | 2026-01-15 |
| Citigroup | Maintain | Buy | 2026-01-15 |
| Truist Securities | Maintain | Buy | 2025-12-19 |
| JP Morgan | Maintain | Neutral | 2025-10-29 |
| Truist Securities | Maintain | Buy | 2025-10-29 |
| Susquehanna | Maintain | Neutral | 2025-07-23 |
Which company has the best grades?
NVIDIA consistently receives strong buy and outperform ratings, reflecting broad institutional confidence. NXP Semiconductors shows mostly buy and outperform grades but includes some neutral ratings. Investors may interpret NVIDIA’s more uniformly positive grades as an indication of stronger market endorsement.
Risks specific to each company
The following categories identify critical pressure points and systemic threats facing NVIDIA Corporation and NXP Semiconductors in the 2026 market environment:
1. Market & Competition
NVIDIA Corporation
- Dominates high-performance GPU and AI markets but faces intense competition from AMD and Intel.
NXP Semiconductors N.V.
- Strong in automotive and IoT segments but competes heavily with Infineon and Texas Instruments.
2. Capital Structure & Debt
NVIDIA Corporation
- Maintains low debt (D/E 0.13) with strong interest coverage (341x), indicating financial stability.
NXP Semiconductors N.V.
- Carries high debt load (D/E 1.22) with moderate interest coverage (8x), raising leverage concerns.
3. Stock Volatility
NVIDIA Corporation
- High beta (2.31) signals significant market volatility and risk exposure.
NXP Semiconductors N.V.
- Moderate beta (1.46) reflects comparatively lower stock price fluctuations.
4. Regulatory & Legal
NVIDIA Corporation
- Faces regulatory scrutiny over AI technology and international trade restrictions with China.
NXP Semiconductors N.V.
- Subject to EU and U.S. semiconductor export controls; geopolitical tensions could disrupt operations.
5. Supply Chain & Operations
NVIDIA Corporation
- Relies on complex global supply chains, vulnerable to semiconductor shortages and geopolitical disruptions.
NXP Semiconductors N.V.
- Diverse manufacturing footprint mitigates risks but exposed to supply constraints in Asia.
6. ESG & Climate Transition
NVIDIA Corporation
- Invests in sustainable technologies but criticized for high energy consumption in data centers.
NXP Semiconductors N.V.
- Advances in energy-efficient chips align with ESG trends, improving long-term competitiveness.
7. Geopolitical Exposure
NVIDIA Corporation
- Significant exposure to U.S.-China tensions affecting sales and supply chain logistics.
NXP Semiconductors N.V.
- European base limits U.S.-China risk but faces EU regulatory challenges and global trade uncertainties.
Which company shows a better risk-adjusted profile?
NVIDIA’s highest risk comes from market volatility and regulatory pressures linked to AI and global trade. NXP’s most impactful risk is its elevated debt burden, which strains financial flexibility. Despite NVIDIA’s stock volatility, its low leverage and robust cash flow create a stronger risk-adjusted profile. Notably, NVIDIA’s interest coverage ratio at 341x far outpaces NXP’s 8x, underscoring superior debt management and resilience under market stress.
Final Verdict: Which stock to choose?
NVIDIA’s superpower lies in its exceptional capital efficiency and rapid growth, driven by a very favorable moat and industry-leading returns. Its high valuation multiples warrant caution as a point of vigilance. NVIDIA fits well within aggressive growth portfolios that can tolerate premium pricing for innovation leadership.
NXP Semiconductors offers a strategic moat anchored in steady cash flow and solid income quality, with a safer balance sheet compared to NVIDIA’s leaner debt profile. Its valuation appears more reasonable, making it suitable for GARP investors seeking growth tempered by relative stability.
If you prioritize breakthrough growth and dominant market positioning, NVIDIA outshines with its robust value creation and accelerating profitability. However, if you seek a more balanced risk-return profile with durable cash flow, NXP offers better stability despite a softer moat and slower growth. Each scenario depends on your portfolio’s risk tolerance and investment horizon.
Disclaimer: Investment carries a risk of loss of initial capital. The past performance is not a reliable indicator of future results. Be sure to understand risks before making an investment decision.
Go Further
I encourage you to read the complete analyses of NVIDIA Corporation and NXP Semiconductors N.V. to enhance your investment decisions: