NVIDIA Corporation and Microchip Technology Incorporated are two key players in the semiconductor industry, each with distinct innovation strategies and market focuses. NVIDIA leads in advanced graphics, AI computing, and data center solutions, while Microchip specializes in embedded control and connectivity products. Their overlapping technologies and growth potential make this comparison essential. In this article, I will help you decide which company is the more compelling investment opportunity in 2026.
Table of contents
Companies Overview
I will begin the comparison between NVIDIA Corporation and Microchip Technology Incorporated by providing an overview of these two companies and their main differences.
NVIDIA Overview
NVIDIA Corporation, headquartered in Santa Clara, California, focuses on providing graphics, compute, and networking solutions globally. The company operates through its Graphics and Compute & Networking segments, offering products such as GeForce GPUs for gaming, data center platforms for AI and HPC, automotive AI solutions, and related software. Established in 1993, NVIDIA serves diverse markets including gaming, professional visualization, datacenter, and automotive industries.
Microchip Overview
Microchip Technology Incorporated, based in Chandler, Arizona, develops and sells embedded control solutions worldwide. Its product portfolio includes microcontrollers, microprocessors, analog and mixed-signal products, memory devices, and FPGA products. Founded in 1989, Microchip targets applications in automotive, industrial, computing, communications, and other sectors, providing development tools and manufacturing services alongside its semiconductor offerings.
Key similarities and differences
Both companies operate in the semiconductor industry and serve a global customer base across multiple sectors. NVIDIA emphasizes high-performance graphics, AI, and networking solutions, focusing on gaming, datacenter, and automotive markets. Microchip specializes in embedded control solutions with a broader product range covering microcontrollers, analog, memory, and FPGA, catering to a wide array of industrial and automotive applications. Their business models reflect distinct technological focuses within the semiconductor space.
Income Statement Comparison
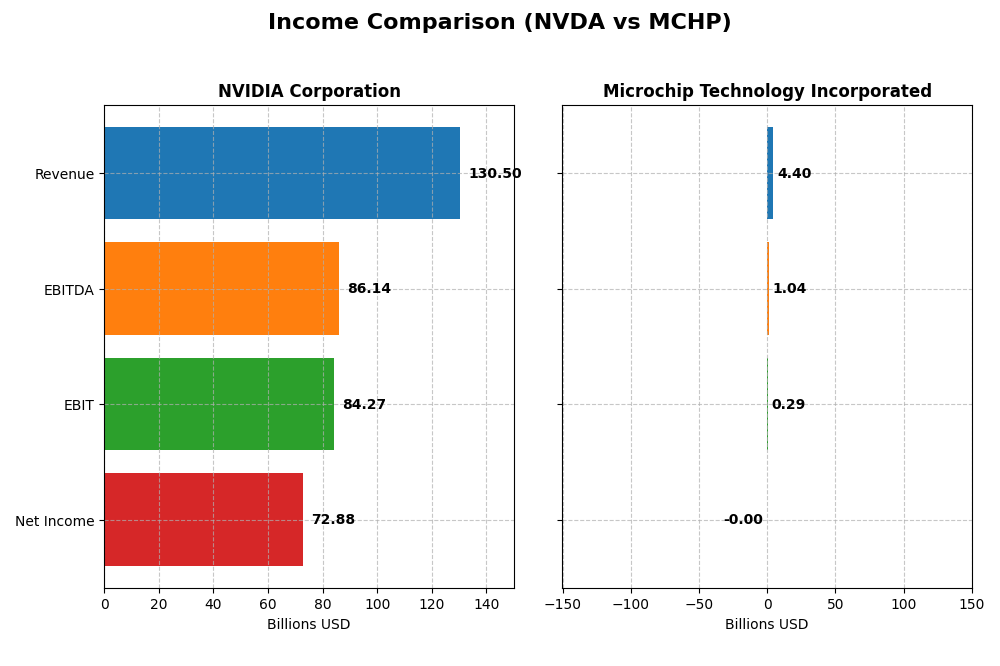
This table compares the key income statement metrics for NVIDIA Corporation and Microchip Technology Incorporated for their most recent fiscal year, highlighting their financial performance.
| Metric | NVIDIA Corporation | Microchip Technology Incorporated |
|---|---|---|
| Market Cap | 4.60T | 35.0B |
| Revenue | 130.5B | 4.40B |
| EBITDA | 86.1B | 1.04B |
| EBIT | 84.3B | 290M |
| Net Income | 72.9B | -500K |
| EPS | 2.97 | -0.005 |
| Fiscal Year | 2025 | 2025 |
Income Statement Interpretations
NVIDIA Corporation
NVIDIA exhibited strong growth from 2021 to 2025, with revenue surging from $16.7B to $130.5B and net income rising from $4.3B to $72.9B. Margins improved notably, with gross margin close to 75% and net margin reaching 55.85% in 2025. The latest year showed accelerated revenue and profitability growth, confirming robust operational efficiency.
Microchip Technology Incorporated
Microchip’s revenue declined from $5.4B in 2021 to $4.4B in 2025, with net income turning negative in 2025 at -$2.7M. Gross margin remained favorable at 56.07%, but EBIT margin was neutral at 6.6%, and net margin became unfavorable. The most recent year reflected significant decreases in revenue, profitability, and margins, indicating operational challenges.
Which one has the stronger fundamentals?
NVIDIA’s income statement demonstrates consistently favorable trends in revenue, margins, and net income growth over the entire period, with all key metrics improving in 2025. In contrast, Microchip shows declining revenue and net income, with several unfavorable margin metrics. Based on this data, NVIDIA clearly exhibits stronger fundamental financial performance.
Financial Ratios Comparison
This table compares the key financial ratios for NVIDIA Corporation and Microchip Technology Incorporated based on their most recent fiscal year data, reflecting profitability, liquidity, valuation, leverage, and efficiency metrics.
| Ratios | NVIDIA Corporation (2025) | Microchip Technology Inc. (2025) |
|---|---|---|
| ROE | 91.9% | -0.007% |
| ROIC | 75.3% | -0.027% |
| P/E | 39.9 | -52021 |
| P/B | 36.7 | 3.67 |
| Current Ratio | 4.44 | 2.59 |
| Quick Ratio | 3.88 | 1.47 |
| D/E (Debt to Equity) | 0.13 | 0.80 |
| Debt-to-Assets | 9.2% | 36.9% |
| Interest Coverage | 330 | 1.18 |
| Asset Turnover | 1.17 | 0.29 |
| Fixed Asset Turnover | 16.2 | 3.72 |
| Payout ratio | 1.14% | -1951% |
| Dividend yield | 0.029% | 3.75% |
Interpretation of the Ratios
NVIDIA Corporation
NVIDIA exhibits strong profitability ratios with net margin at 55.85%, ROE at 91.87%, and ROIC at 75.28%, indicating excellent return generation. However, valuation ratios like PE at 39.9 and PB at 36.66 appear high, suggesting expensive stock pricing. The current ratio is elevated at 4.44, possibly indicating inefficient asset use. Dividend yield is very low at 0.03%, reflecting minimal payout.
Microchip Technology Incorporated
Microchip shows weak profitability with negative net margin (-0.01%), ROE (-0.01%), and ROIC (-0.03%), signaling operational challenges. Liquidity ratios are moderate with a current ratio of 2.59 and quick ratio 1.47, but interest coverage is low at 1.15, raising debt servicing concerns. The dividend yield is attractive at 3.75%, supporting shareholder returns despite performance issues.
Which one has the best ratios?
NVIDIA’s ratios are predominantly favorable, reflecting strong profitability, efficient asset use, and solid leverage management, despite some overvaluation and low dividend yield. Microchip presents mixed results with some liquidity strengths and dividend income but suffers from negative profitability and weak coverage ratios. Overall, NVIDIA demonstrates better financial health and ratio quality.
Strategic Positioning
This section compares NVIDIA Corporation and Microchip Technology Incorporated on market position, key segments, and exposure to technological disruption:
NVIDIA Corporation
- Leading global semiconductor player with significant competitive pressure in diverse markets.
- Key segments: Data Center, Gaming, Automotive, Professional Visualization driving revenue growth.
- High exposure through AI, HPC, autonomous driving, cloud, and gaming innovations.
Microchip Technology Incorporated
- Smaller market cap with moderate competition focused on embedded control solutions.
- Focused on embedded microcontrollers and analog products for automotive, industrial, and communications.
- Exposure centered on embedded control tech with less emphasis on emerging disruptive technologies.
NVIDIA Corporation vs Microchip Technology Incorporated Positioning
NVIDIA pursues a diversified approach across fast-growing segments like AI and gaming, while Microchip concentrates on embedded control solutions. NVIDIA benefits from scale and innovation breadth; Microchip has a narrower focus but less exposure to rapid disruption.
Which has the best competitive advantage?
NVIDIA shows a very favorable moat with growing ROIC well above WACC, indicating strong value creation and durable competitive advantage. Microchip exhibits very unfavorable moat metrics with declining ROIC, signaling value destruction and weaker competitive positioning.
Stock Comparison
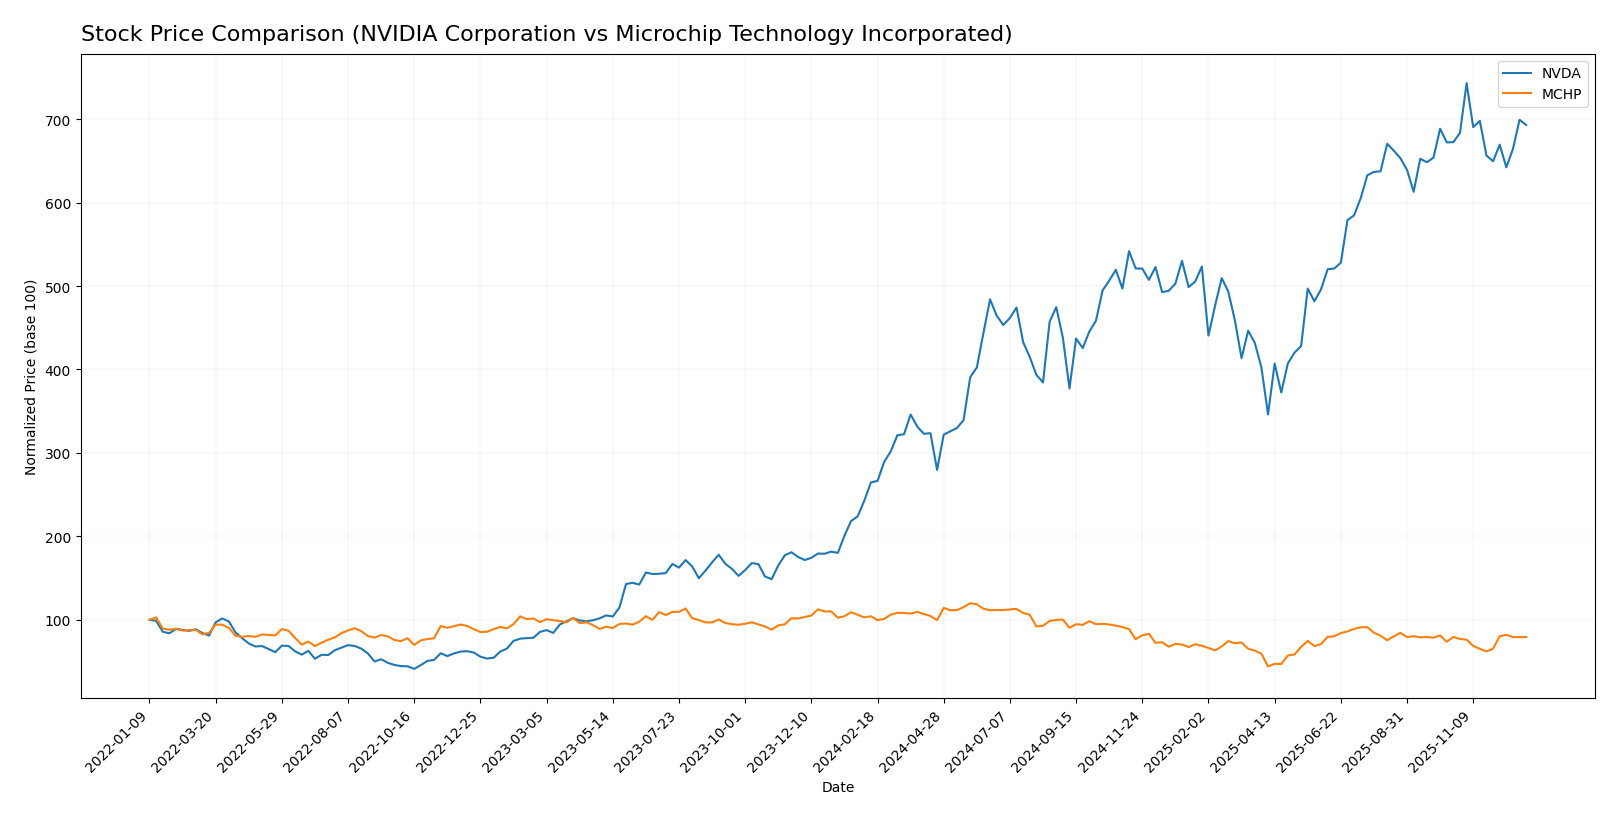
The stock prices of NVIDIA Corporation and Microchip Technology Incorporated have shown contrasting movements over the past 12 months, with NVIDIA exhibiting strong gains despite a recent deceleration, while Microchip faced a notable decline accompanied by accelerating bearish momentum.
Trend Analysis
NVIDIA’s stock price increased by 161.82% over the past year, indicating a clear bullish trend with decelerating acceleration and a high volatility level (std deviation 32.99). Its price ranged between 72.13 and 202.49.
Microchip’s stock declined by 23.89% in the same period, reflecting a bearish trend with accelerating downward momentum and moderate volatility (std deviation 14.5). The price fluctuated between 36.22 and 98.23.
Comparing the two trends, NVIDIA delivered the highest market performance with a substantial positive price change, while Microchip’s stock underperformed with a significant negative return.
Target Prices
The current analyst consensus indicates a bullish outlook for both NVIDIA Corporation and Microchip Technology Incorporated.
| Company | Target High | Target Low | Consensus |
|---|---|---|---|
| NVIDIA Corporation | 352 | 140 | 262.79 |
| Microchip Technology Incorporated | 85 | 60 | 73.83 |
Analysts expect NVIDIA’s stock to appreciate significantly from its current price of $188.85, with a consensus target near $263. Microchip’s consensus target of $73.83 also suggests upside potential from its current $65.03 price.
Analyst Opinions Comparison
This section compares analysts’ ratings and grades for NVIDIA Corporation (NVDA) and Microchip Technology Incorporated (MCHP):
Rating Comparison
NVDA Rating
- Rating: B+, classified as Very Favorable.
- Discounted Cash Flow Score: 3, Moderate.
- ROE Score: 5, Very Favorable, indicating strong profit generation from equity.
- ROA Score: 5, Very Favorable, showing efficient asset utilization.
- Debt To Equity Score: 3, Moderate financial risk.
- Overall Score: 3, Moderate overall financial standing.
MCHP Rating
- Rating: C-, classified as Very Favorable.
- Discounted Cash Flow Score: 3, Moderate.
- ROE Score: 1, Very Unfavorable, indicating weak profit generation from equity.
- ROA Score: 1, Very Unfavorable, showing poor asset utilization.
- Debt To Equity Score: 1, Very Unfavorable, higher financial risk.
- Overall Score: 1, Very Unfavorable overall financial standing.
Which one is the best rated?
Based strictly on the provided data, NVDA holds a significantly better rating and scores higher across key financial metrics such as ROE, ROA, and debt management, compared to MCHP’s substantially lower overall and financial health scores.
Scores Comparison
The scores comparison between NVIDIA Corporation and Microchip Technology Incorporated is as follows:
NVDA Scores
- Altman Z-Score: 69.52, indicating a safe zone with very low bankruptcy risk.
- Piotroski Score: 5, reflecting average financial strength and investment potential.
MCHP Scores
- Altman Z-Score: 3.60, indicating a safe zone with low bankruptcy risk.
- Piotroski Score: 3, reflecting very weak financial strength and investment potential.
Which company has the best scores?
NVIDIA has a significantly higher Altman Z-Score and a better Piotroski Score compared to Microchip, indicating stronger financial stability and average financial strength versus very weak for Microchip.
Grades Comparison
The following presents a comparison of recent grades assigned to NVIDIA Corporation and Microchip Technology Incorporated by reputable grading firms:
NVIDIA Corporation Grades
This table displays recent grades from recognized grading companies for NVIDIA Corporation.
| Grading Company | Action | New Grade | Date |
|---|---|---|---|
| Stifel | Maintain | Buy | 2025-12-29 |
| Truist Securities | Maintain | Buy | 2025-12-29 |
| Bernstein | Maintain | Outperform | 2025-12-26 |
| Baird | Maintain | Outperform | 2025-12-26 |
| B of A Securities | Maintain | Buy | 2025-12-26 |
| Truist Securities | Maintain | Buy | 2025-12-19 |
| Tigress Financial | Maintain | Strong Buy | 2025-12-18 |
| Morgan Stanley | Maintain | Overweight | 2025-12-01 |
| Baird | Maintain | Outperform | 2025-11-20 |
| Truist Securities | Maintain | Buy | 2025-11-20 |
NVIDIA’s grades consistently indicate strong buy or outperform recommendations, with no downgrades in the latest assessments.
Microchip Technology Incorporated Grades
This table shows recent grades from recognized grading companies for Microchip Technology Incorporated.
| Grading Company | Action | New Grade | Date |
|---|---|---|---|
| Cantor Fitzgerald | Upgrade | Overweight | 2025-12-16 |
| B of A Securities | Maintain | Neutral | 2025-12-05 |
| Needham | Maintain | Buy | 2025-12-04 |
| Rosenblatt | Maintain | Buy | 2025-12-03 |
| Wells Fargo | Maintain | Equal Weight | 2025-11-07 |
| Citigroup | Maintain | Buy | 2025-11-07 |
| Cantor Fitzgerald | Maintain | Neutral | 2025-11-07 |
| Stifel | Maintain | Buy | 2025-11-07 |
| Truist Securities | Maintain | Hold | 2025-11-07 |
| Needham | Maintain | Buy | 2025-11-07 |
Microchip’s grades reveal a mixed pattern, ranging from neutral and equal weight to buy and an upgrade to overweight, indicating a cautiously positive outlook.
Which company has the best grades?
NVIDIA Corporation has received more consistently positive grades, mainly buy and outperform ratings, compared to Microchip Technology Incorporated’s more varied grades. This trend may suggest stronger confidence from analysts in NVIDIA’s prospects, potentially influencing investor sentiment accordingly.
Strengths and Weaknesses
Below is a comparative overview of key strengths and weaknesses for NVIDIA Corporation and Microchip Technology Incorporated based on their recent financial and operational performance.
| Criterion | NVIDIA Corporation (NVDA) | Microchip Technology Incorporated (MCHP) |
|---|---|---|
| Diversification | Highly diversified revenue with strong segments in Data Center ($115B), Gaming ($11.35B), Automotive ($1.69B), and Professional Visualization ($1.88B) | Primarily focused on Semiconductor Products ($4.27B) with limited Technology Licensing ($131M) |
| Profitability | Very high profitability: net margin 55.85%, ROIC 75.28%, ROE 91.87% | Negative profitability: net margin -0.01%, ROIC -0.03%, ROE -0.01% |
| Innovation | Strong innovation evident from rapid ROIC growth (339%) and durable competitive advantage | Weak innovation with declining ROIC (-100%) and value destruction |
| Global presence | Extensive global footprint supported by diversified product lines and high asset turnover | Moderate global presence with slower asset turnover and weaker interest coverage |
| Market Share | Leading market share in GPUs and AI Data Center processors | Niche market share focused on specific semiconductor products |
Key takeaway: NVIDIA stands out with robust diversification, exceptional profitability, and strong innovation momentum, signaling a durable competitive moat. In contrast, Microchip struggles with declining profitability and value destruction, suggesting higher investment risk.
Risk Analysis
Below is a comparative risk table for NVIDIA Corporation and Microchip Technology Incorporated based on 2025 data.
| Metric | NVIDIA Corporation (NVDA) | Microchip Technology (MCHP) |
|---|---|---|
| Market Risk | High beta 2.28, volatile price range (86.62-212.19) | Moderate beta 1.46, less volatile range (34.13-77.2) |
| Debt level | Low debt/equity 0.13, debt to assets 9.2% (favorable) | Higher debt/equity 0.8, debt to assets 36.85% (neutral) |
| Regulatory Risk | Moderate: global semiconductor regulation impact | Moderate: similar semiconductor regulatory environment |
| Operational Risk | Low, strong profitability and ROE | Elevated, marginal profitability and weak ROE |
| Environmental Risk | Moderate: semiconductor industry pressure on sustainability | Moderate: similar sector environmental challenges |
| Geopolitical Risk | Exposure to US-China trade tensions, Taiwan manufacturing | Exposure to global supply chain and trade tensions |
The most impactful and likely risks are market volatility for NVIDIA due to its high beta and valuation multiples, and operational risk for Microchip given its negative profitability and weak financial health despite a safer Altman Z-Score. Both face geopolitical uncertainty in semiconductor supply chains.
Which Stock to Choose?
NVIDIA Corporation (NVDA) shows a strong income evolution with revenue growth of 114.2% in the last year and favorable profitability metrics including a 55.85% net margin and 91.87% return on equity. It maintains low debt levels with a net debt-to-EBITDA of 0.02 and holds a very favorable rating of B+ supported by excellent financial ratios.
Microchip Technology Incorporated (MCHP) experienced a decline in income with a -42.35% revenue growth over the past year and an unfavorable net margin near zero. Profitability metrics such as return on equity are negative, and the company carries higher debt with a net debt-to-EBITDA of 4.7. Its rating is C- with a slightly unfavorable overall financial ratios evaluation.
From an investor’s perspective, NVDA’s very favorable rating and robust income growth combined with a strong economic moat might appeal to growth and quality investors, while MCHP’s current financial challenges and slightly unfavorable ratios could suggest it may be more suited for risk-tolerant investors seeking turnaround opportunities. The interpretation depends on individual risk profiles and investment strategies.
Disclaimer: Investment carries a risk of loss of initial capital. The past performance is not a reliable indicator of future results. Be sure to understand risks before making an investment decision.
Go Further
I encourage you to read the complete analyses of NVIDIA Corporation and Microchip Technology Incorporated to enhance your investment decisions: