NVIDIA Corporation and indie Semiconductor, Inc. both operate in the semiconductor industry, yet they target different niches within this vast market. NVIDIA is a giant known for its graphics processing units and AI computing platforms, while indie Semiconductor focuses on automotive semiconductors and software for advanced driver assistance systems. This comparison explores their market positions and innovation strategies to help you identify which company holds the greater potential for your investment portfolio.

Table of contents
Companies Overview
I will begin the comparison between NVIDIA Corporation and indie Semiconductor, Inc. by providing an overview of these two companies and their main differences.
NVIDIA Overview
NVIDIA Corporation is a leading technology company specializing in graphics, compute, and networking solutions globally. Its products span gaming GPUs, enterprise workstation graphics, AI data center platforms, and automotive AI systems. Headquartered in Santa Clara, California, NVIDIA serves a broad range of markets including gaming, professional visualization, datacenter, and automotive, with a workforce of 36,000 employees and a market cap of approximately 4.46T USD.
indie Semiconductor Overview
indie Semiconductor, Inc. focuses on automotive semiconductors and software solutions for advanced driver assistance, connected cars, and electrification. The company develops components for parking assistance, wireless charging, infotainment, and cloud connectivity. Based in Aliso Viejo, California, indie Semiconductor employs around 920 people and has a market capitalization near 861M USD, positioning itself as a specialized player in automotive semiconductor technology.
Key similarities and differences
Both NVIDIA and indie Semiconductor operate within the semiconductor industry and target automotive markets, particularly in advanced driver assistance and connectivity. However, NVIDIA has a significantly broader portfolio including gaming, professional visualization, and data center solutions, while indie Semiconductor concentrates on automotive-specific applications and photonic technologies. Market capitalization and scale also differ greatly, with NVIDIA being a tech giant and indie Semiconductor a smaller, niche provider.
Income Statement Comparison
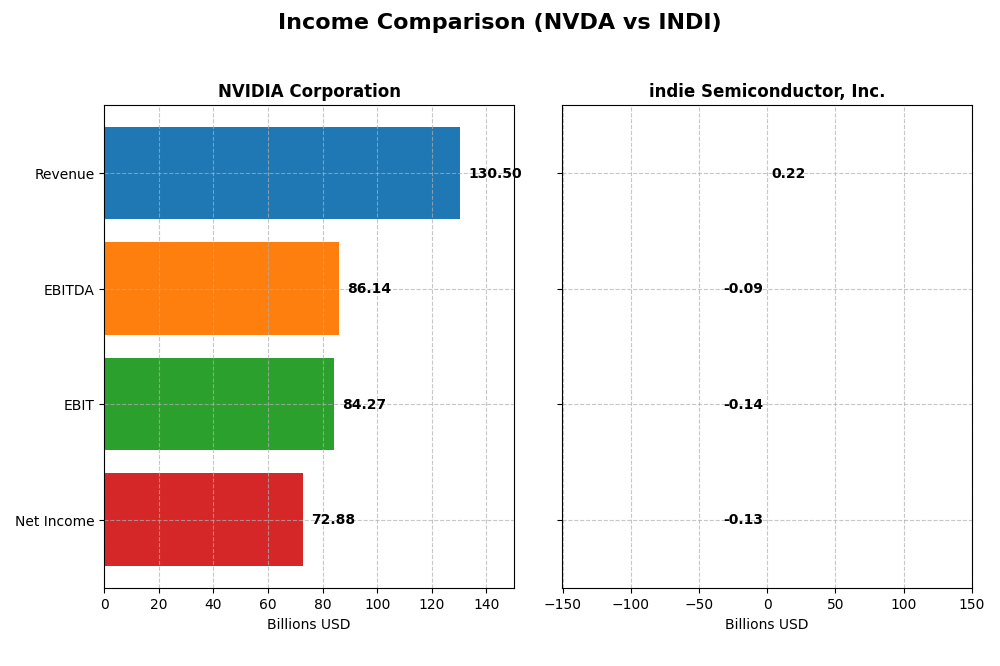
The table below compares the most recent fiscal year income statement metrics for NVIDIA Corporation and indie Semiconductor, Inc., providing a snapshot of their financial performance.
| Metric | NVIDIA Corporation | indie Semiconductor, Inc. |
|---|---|---|
| Market Cap | 4.46T | 861M |
| Revenue | 130.5B | 217M |
| EBITDA | 86.1B | -94M |
| EBIT | 84.3B | -137M |
| Net Income | 72.9B | -133M |
| EPS | 2.97 | -0.76 |
| Fiscal Year | 2025 | 2024 |
Income Statement Interpretations
NVIDIA Corporation
NVIDIA showed strong revenue growth from 2021 to 2025, surging from $16.7B to $130.5B, with net income rising from $4.3B to $72.9B. Margins improved significantly, with a gross margin near 75% and net margin at 56% in 2025. The latest year saw exceptional growth, with revenue and earnings more than doubling, reflecting robust operational efficiency and market expansion.
indie Semiconductor, Inc.
indie Semiconductor’s revenue increased overall from $22.6M in 2020 to $217M in 2024, but net income remained negative, widening from a loss of $97M in 2020 to $133M in 2024. Margins were mixed; gross margin was positive at 42%, but EBIT and net margins were deeply negative, reflecting ongoing operational challenges. The most recent year showed a slight revenue decline and a worsening EBIT margin.
Which one has the stronger fundamentals?
NVIDIA’s fundamentals are notably stronger, supported by consistent revenue and net income growth, high and improving margins, and favorable overall income statement evaluations. indie Semiconductor shows revenue growth but persistent net losses and unfavorable EBIT and net margins, leading to a more cautious outlook. Thus, NVIDIA demonstrates more robust financial health and profitability metrics over the period.
Financial Ratios Comparison
The table below compares key financial ratios for NVIDIA Corporation (NVDA) and indie Semiconductor, Inc. (INDI) based on the most recent fiscal year data available.
| Ratios | NVIDIA Corporation (NVDA) | indie Semiconductor, Inc. (INDI) |
|---|---|---|
| ROE | 91.87% | -31.73% |
| ROIC | 75.28% | -19.25% |
| P/E | 39.90 | -5.35 |
| P/B | 36.66 | 1.70 |
| Current Ratio | 4.44 | 4.82 |
| Quick Ratio | 3.88 | 4.23 |
| D/E (Debt-to-Equity) | 0.13 | 0.95 |
| Debt-to-Assets | 9.20% | 42.34% |
| Interest Coverage | 329.77 | -18.37 |
| Asset Turnover | 1.17 | 0.23 |
| Fixed Asset Turnover | 16.16 | 4.30 |
| Payout Ratio | 1.14% | 0% |
| Dividend Yield | 0.029% | 0% |
Interpretation of the Ratios
NVIDIA Corporation
NVIDIA’s financial ratios are mostly strong, with high returns on equity (91.87%) and invested capital (75.28%), supported by excellent asset turnover and interest coverage. However, some valuations like P/E (39.9) and P/B (36.66) ratios are relatively high, indicating potential overvaluation risks. The company pays a modest dividend with a low yield (0.03%), reflecting a cautious payout policy supported by robust free cash flow.
indie Semiconductor, Inc.
indie Semiconductor shows weak financial ratios, with negative net margin (-61.2%) and return on equity (-31.73%), highlighting ongoing losses and operational challenges. The company does not pay dividends, consistent with its negative earnings and reinvestment focus, especially in R&D (over 80% of revenue). Despite a high current ratio (4.82), poor asset turnover and negative interest coverage suggest liquidity and profitability concerns.
Which one has the best ratios?
NVIDIA presents a more favorable financial profile with strong profitability, efficient asset use, and solid coverage ratios, despite some valuation concerns. indie Semiconductor’s ratios indicate significant financial strain and lack of profitability, reflecting a high-risk growth phase. Thus, NVIDIA’s ratios are clearly stronger and more stable by comparison.
Strategic Positioning
This section compares the strategic positioning of NVIDIA Corporation and indie Semiconductor, Inc., focusing on Market position, Key segments, and Exposure to technological disruption:
NVIDIA Corporation
- Market leader in semiconductors with significant competitive pressure globally.
- Diverse segments: Data Center, Gaming, Automotive, Professional Visualization.
- Exposure through AI, HPC, autonomous driving, and advanced gaming technologies.
indie Semiconductor, Inc.
- Smaller player in automotive semiconductors with niche competitive focus.
- Concentrated on automotive semiconductors and software solutions.
- Focused on automotive ADAS, connectivity, and photonic component innovation.
NVIDIA Corporation vs indie Semiconductor, Inc. Positioning
NVIDIA has a diversified business model across multiple high-growth segments, while indie Semiconductor concentrates on automotive applications. NVIDIA’s broad portfolio provides scale advantages; indie’s focus targets specialized automotive technologies but with narrower market reach.
Which has the best competitive advantage?
NVIDIA demonstrates a very favorable moat with growing ROIC and strong value creation, indicating durable competitive advantages. Indie Semiconductor shows a very unfavorable moat with declining ROIC, reflecting challenges in sustaining profitability and competitive strength.
Stock Comparison
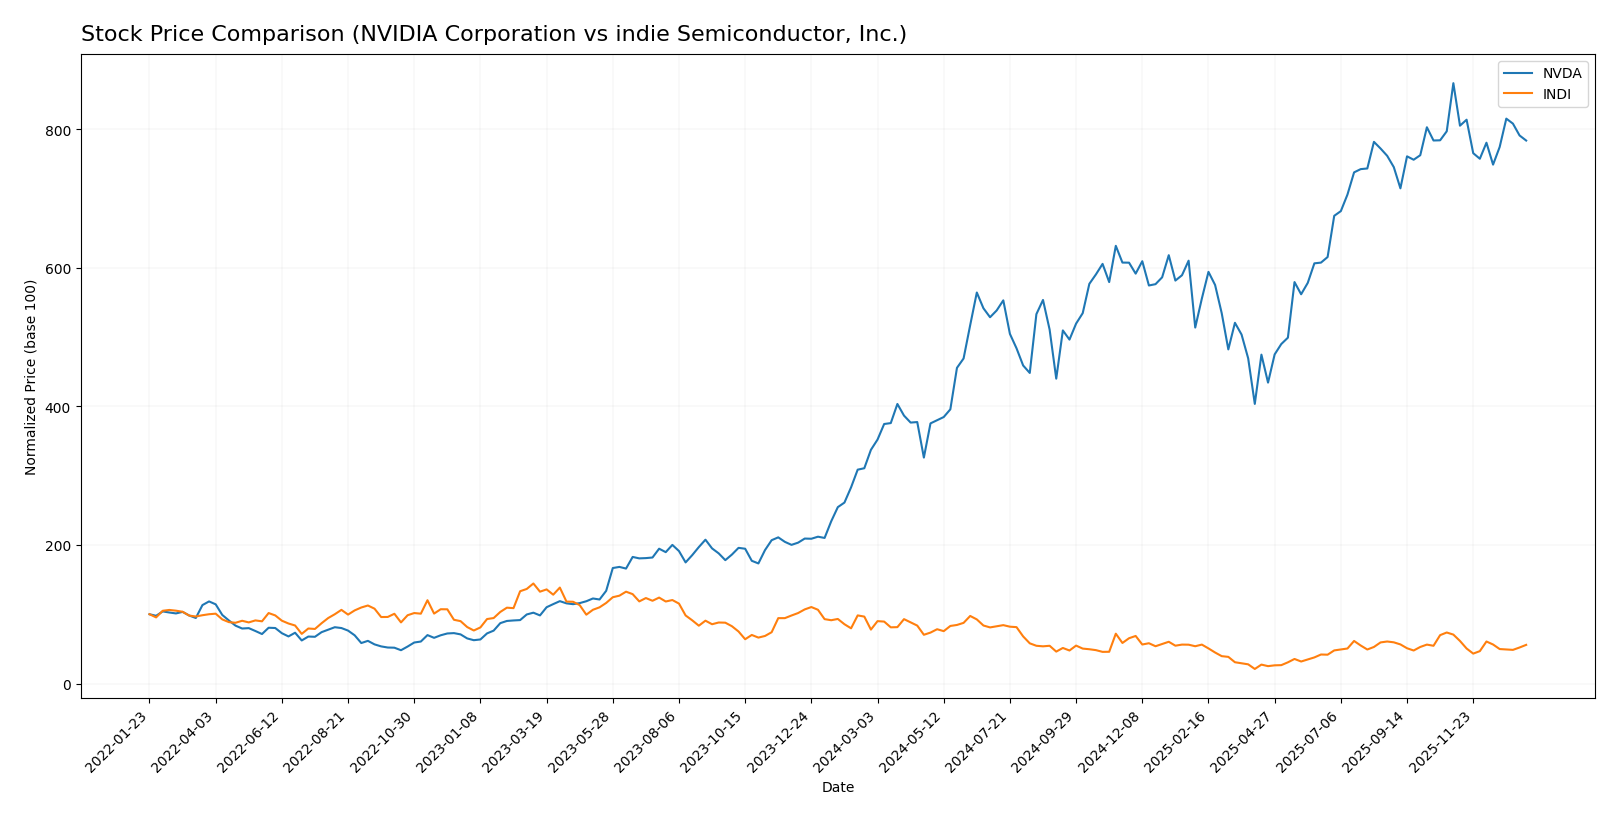
Over the past 12 months, NVIDIA Corporation’s stock surged by 132.35% with decelerating momentum from a high of 202.49 to a low of 76.2, while indie Semiconductor, Inc. experienced a 28.33% decline accompanied by decelerating bearish pressure.
Trend Analysis
NVIDIA Corporation’s stock exhibited a strong bullish trend over the past year with a 132.35% price increase and notable volatility (std deviation 32.46), though recent weeks show a 9.56% pullback and decelerating momentum.
indie Semiconductor, Inc. showed a bearish trend with a 28.33% price decline over the last year, low volatility (std deviation 1.35), and a sustained recent downward move of 21%, indicating persistent selling pressure.
Comparing the two, NVIDIA delivered the highest market performance over the past year with its substantial price appreciation, while indie Semiconductor’s stock trended downward significantly.
Target Prices
Analysts present a varied but optimistic target consensus for NVIDIA Corporation and indie Semiconductor, Inc.
| Company | Target High | Target Low | Consensus |
|---|---|---|---|
| NVIDIA Corporation | 352 | 140 | 264.34 |
| indie Semiconductor, Inc. | 8 | 8 | 8 |
NVIDIA’s target consensus at 264.34 suggests substantial upside from the current price of 183.14, reflecting strong growth expectations. indie Semiconductor’s consensus at 8 is nearly double its current price of 4.25, indicating bullish sentiment despite a narrower target range.
Analyst Opinions Comparison
This section compares analysts’ ratings and financial scores for NVIDIA Corporation and indie Semiconductor, Inc.:
Rating Comparison
NVIDIA Corporation Rating
- Rating: B+, classified as Very Favorable.
- Discounted Cash Flow Score: 3, indicating Moderate.
- ROE Score: 5, indicating Very Favorable efficiency.
- ROA Score: 5, indicating Very Favorable asset use.
- Debt To Equity Score: 3, indicating Moderate risk.
- Overall Score: 3, indicating Moderate performance.
indie Semiconductor, Inc. Rating
- Rating: C-, classified as Very Unfavorable.
- Discounted Cash Flow Score: 1, indicating Very Unfavorable.
- ROE Score: 1, indicating Very Unfavorable efficiency.
- ROA Score: 1, indicating Very Unfavorable asset use.
- Debt To Equity Score: 1, indicating Very Unfavorable risk.
- Overall Score: 1, indicating Very Unfavorable performance.
Which one is the best rated?
Based on the provided data, NVIDIA Corporation holds significantly stronger ratings and scores across all key financial metrics compared to indie Semiconductor, Inc. NVIDIA is better rated overall with moderate to very favorable scores, while indie Semiconductor shows very unfavorable scores.
Scores Comparison
Here is the comparison of the Altman Z-Score and Piotroski Score for NVIDIA Corporation and indie Semiconductor, Inc.:
NVIDIA Scores
- Altman Z-Score: 68.04, indicating a safe zone, low bankruptcy risk.
- Piotroski Score: 6, classified as average financial strength.
indie Scores
- Altman Z-Score: 0.12, indicating distress zone, high bankruptcy risk.
- Piotroski Score: 2, classified as very weak financial strength.
Which company has the best scores?
NVIDIA shows significantly stronger financial health with a safe zone Altman Z-Score and an average Piotroski Score. indie Semiconductor’s scores indicate financial distress and very weak strength, suggesting higher risk based on these metrics.
Grades Comparison
Here is a comparison of the recent grades and ratings for NVIDIA Corporation and indie Semiconductor, Inc.:
NVIDIA Corporation Grades
The following table summarizes recent grades from established financial institutions for NVIDIA Corporation:
| Grading Company | Action | New Grade | Date |
|---|---|---|---|
| Mizuho | maintain | Outperform | 2026-01-09 |
| Truist Securities | maintain | Buy | 2025-12-29 |
| Stifel | maintain | Buy | 2025-12-29 |
| B of A Securities | maintain | Buy | 2025-12-26 |
| Baird | maintain | Outperform | 2025-12-26 |
| Bernstein | maintain | Outperform | 2025-12-26 |
| Truist Securities | maintain | Buy | 2025-12-19 |
| Tigress Financial | maintain | Strong Buy | 2025-12-18 |
| Morgan Stanley | maintain | Overweight | 2025-12-01 |
| Deutsche Bank | maintain | Hold | 2025-11-20 |
Overall, NVIDIA’s grades predominantly reflect a strong buy or outperform consensus, with most actions maintained over recent months.
indie Semiconductor, Inc. Grades
The table below shows the latest grades from credible grading companies for indie Semiconductor, Inc.:
| Grading Company | Action | New Grade | Date |
|---|---|---|---|
| UBS | maintain | Neutral | 2025-11-10 |
| Benchmark | maintain | Buy | 2025-06-25 |
| Benchmark | maintain | Buy | 2025-06-11 |
| Benchmark | maintain | Buy | 2025-05-21 |
| Benchmark | maintain | Buy | 2025-05-13 |
| Craig-Hallum | maintain | Buy | 2025-05-13 |
| Keybanc | maintain | Overweight | 2025-05-13 |
| Benchmark | maintain | Buy | 2025-04-09 |
| Benchmark | maintain | Buy | 2025-02-21 |
| Keybanc | maintain | Overweight | 2025-02-21 |
indie Semiconductor’s grades mostly indicate a buy consensus, with consistent maintenance of these recommendations over time.
Which company has the best grades?
NVIDIA Corporation has received a higher volume of strong buy and outperform grades from multiple reputable sources compared to indie Semiconductor, which mainly holds buy and overweight ratings. This suggests a stronger market confidence in NVIDIA’s outlook, potentially translating to greater investor interest and perceived growth prospects.
Strengths and Weaknesses
Below is a comparative overview of the key strengths and weaknesses for NVIDIA Corporation (NVDA) and indie Semiconductor, Inc. (INDI) based on their most recent financial and market data.
| Criterion | NVIDIA Corporation (NVDA) | indie Semiconductor, Inc. (INDI) |
|---|---|---|
| Diversification | Highly diversified with strong segments in Data Center (115B), Gaming (11.35B), Automotive (1.69B), and Professional Visualization (1.88B) | Limited diversification, mainly focused on Product (203M) and Service (14M) segments |
| Profitability | Very high profitability: Net Margin 55.85%, ROE 91.87%, ROIC 75.28%, indicating strong value creation | Negative profitability: Net Margin -61.2%, ROE -31.73%, ROIC -19.25%, signaling value destruction |
| Innovation | Industry leader with durable competitive advantage and rapidly growing ROIC (+339%) | Struggling with declining ROIC (-179%), indicating challenges in innovation and profitability |
| Global presence | Strong global footprint supported by diversified product lines and markets | Smaller scale with limited global reach and lower market impact |
| Market Share | Dominant player in GPUs and data centers with expanding automotive presence | Niche market player with limited market share and weaker competitive positioning |
In summary, NVIDIA stands out with robust diversification, exceptional profitability, and a durable competitive moat, making it a highly favorable investment. Conversely, indie Semiconductor faces significant challenges with declining profitability and limited diversification, resulting in a very unfavorable investment profile.
Risk Analysis
Below is a comparative table summarizing key risks for NVIDIA Corporation (NVDA) and indie Semiconductor, Inc. (INDI) based on the most recent financial and market data for 2025 and 2024 respectively:
| Metric | NVIDIA Corporation (NVDA) | indie Semiconductor, Inc. (INDI) |
|---|---|---|
| Market Risk | Beta 2.31, high volatility, but large market cap (4.46T USD) provides buffer | Beta 2.54, high volatility with small market cap (861M USD), higher sensitivity to market swings |
| Debt Level | Low debt-to-equity ratio 0.13; debt-to-assets 9.2%, very manageable | Debt-to-equity near parity at 0.95; debt-to-assets 42.3%, indicating higher leverage risk |
| Regulatory Risk | Moderate, operates globally including US, China, Taiwan; subject to tech export controls | Moderate, focused on automotive semiconductors, subject to automotive and tech regulations |
| Operational Risk | Diversified product portfolio, strong operational metrics; risk tied to supply chain disruption | Smaller scale, more concentrated product line; higher operational vulnerability |
| Environmental Risk | Moderate; automotive and data center focus with some sustainability initiatives | Moderate; semiconductor manufacturing environmental impacts and regulatory scrutiny |
| Geopolitical Risk | High exposure due to global operations and supply chains, especially in Asia | Moderate to high, automotive semiconductor demand sensitive to geopolitical trade tensions |
Synthesis: NVDA’s most impactful risks stem from its global geopolitical exposure and high market volatility, though its strong financial health mitigates debt and operational risks. INDI faces significant financial distress signals with high leverage and weak profitability, making market and debt risks more likely and impactful. Recent financial scores place NVDA in a safe zone, while INDI is in distress, underlining the higher risk profile of INDI for investors.
Which Stock to Choose?
NVIDIA Corporation (NVDA) shows strong income growth with a 114.2% increase in revenue over the past year and a 1582.36% rise in net income over five years. Financial ratios are largely favorable, including a high return on equity (91.87%) and a low debt-to-equity ratio (0.13). Profitability is robust, with a net margin of 55.85%, and debt levels remain low. The company’s rating is very favorable with a B+ grade, supported by strong financial health scores.
indie Semiconductor, Inc. (INDI) presents mixed income evolution, with a 2.91% revenue decline last year and negative net income growth (-36.01%) over the period. Most financial ratios are unfavorable, including negative return on equity (-31.73%) and a high debt-to-assets ratio of 42.34%. Profitability is weak, reflected in a net margin of -61.2%. The rating is very unfavorable with a C- grade, and financial scores indicate distress and weak fundamentals.
From an investor perspective, NVDA’s very favorable rating, solid income growth, and strong financial ratios suggest it may appeal to growth and quality-focused investors seeking durable competitive advantage. Conversely, INDI’s unfavorable rating and declining profitability could be more suitable for risk-tolerant investors willing to accept higher volatility and uncertainty. The choice might hinge on individual risk appetite and investment strategy.
Disclaimer: Investment carries a risk of loss of initial capital. The past performance is not a reliable indicator of future results. Be sure to understand risks before making an investment decision.
Go Further
I encourage you to read the complete analyses of NVIDIA Corporation and indie Semiconductor, Inc. to enhance your investment decisions: