Home > Comparison > Technology > NVDA vs ADI
The strategic rivalry between NVIDIA Corporation and Analog Devices, Inc. defines the current trajectory of the semiconductor industry. NVIDIA leads as a high-growth, innovation-driven giant focused on AI, gaming, and data centers. Analog Devices operates as a diversified, steady industrial semiconductor provider with a strong analog and mixed-signal portfolio. This analysis pits growth against stability to identify which trajectory offers superior risk-adjusted returns for a diversified portfolio in 2026.
Table of contents
Companies Overview
NVIDIA and Analog Devices both hold critical roles in the semiconductor industry with distinct market footprints and expertise.
NVIDIA Corporation: Leader in Graphics and AI Computing
NVIDIA dominates the graphics processing market with its GeForce GPUs and AI-focused Data Center platforms. Its revenue primarily stems from gaming, professional visualization, and AI-driven computing solutions. In 2026, the company focuses on expanding AI infrastructure and automotive AI, leveraging its strong ecosystem and software like Omniverse to enhance competitive advantage.
Analog Devices, Inc.: Specialist in Analog and Mixed-Signal ICs
Analog Devices excels in analog, mixed-signal, and digital signal processing technologies. It generates revenue by designing integrated circuits and subsystems for automotive, industrial, and communications markets. The firm’s 2026 strategy emphasizes power management solutions and high-performance amplifiers, catering to niche sectors with precision components and robust signal conditioning products.
Strategic Collision: Similarities & Divergences
Both companies compete in semiconductors but with contrasting philosophies: NVIDIA pursues an AI-driven, software-hardware integrated ecosystem, while Analog Devices emphasizes precision analog and mixed-signal components. Their battleground lies in high-growth tech sectors—NVIDIA in AI compute and gaming, Analog Devices in industrial and automotive electronics. This divergence shapes distinct investment profiles, with NVIDIA positioned as a growth disruptor and Analog Devices as a stable precision technology provider.
Income Statement Comparison
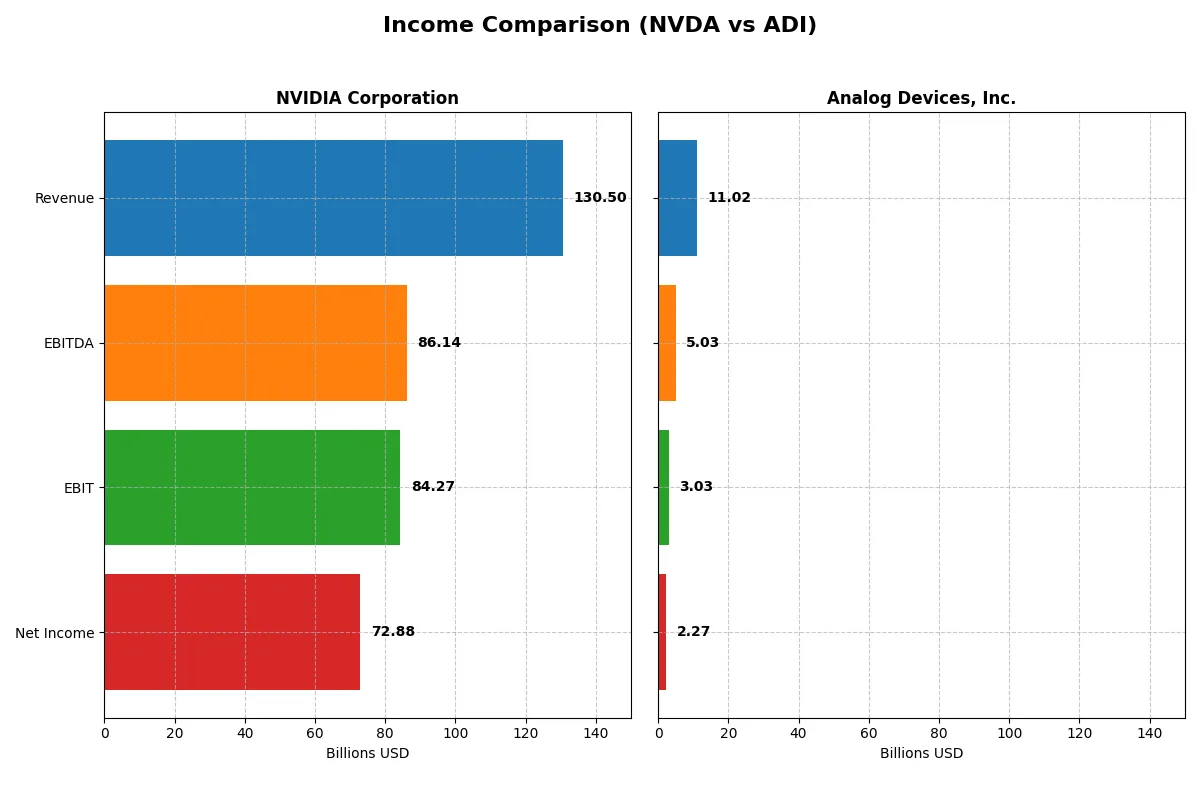
The following data dissects the core profitability and scalability of both corporate engines to reveal who dominates the bottom line:
| Metric | NVIDIA Corporation (NVDA) | Analog Devices, Inc. (ADI) |
|---|---|---|
| Revenue | 130.5B | 11.0B |
| Cost of Revenue | 32.6B | 5.0B |
| Operating Expenses | 16.4B | 3.0B |
| Gross Profit | 97.9B | 6.0B |
| EBITDA | 86.1B | 5.0B |
| EBIT | 84.3B | 3.0B |
| Interest Expense | 247M | 318M |
| Net Income | 72.9B | 2.3B |
| EPS | 2.97 | 4.59 |
| Fiscal Year | 2025 | 2025 |
Income Statement Analysis: The Bottom-Line Duel
The income statement comparison below reveals the true operational efficiency and profitability dynamics of NVIDIA Corporation and Analog Devices, Inc.
NVIDIA Corporation Analysis
NVIDIA’s revenue exploded from $27B in 2023 to $130B in 2025, with net income surging to $73B. Its gross margin holds an impressive 75%, and net margin hits nearly 56%, showcasing exceptional cost control and pricing power. The latest fiscal year demonstrates strong momentum with EBITDA and EBIT margins above 64%, signaling robust operational efficiency.
Analog Devices, Inc. Analysis
Analog Devices grew revenue steadily from $7.3B in 2021 to $11B in 2025, with net income reaching $2.3B. It maintains a solid gross margin of 55% and a net margin of 21%, reflecting healthy profitability but at a more moderate scale. The latest year shows a 17% revenue growth and a 44% EBIT increase, indicating consistent but less aggressive expansion compared to NVIDIA.
Margin Dominance vs. Steady Growth
NVIDIA outstrips Analog Devices with vastly superior revenue scale and margin strength, achieving over twice the net margin and magnified earnings growth. Analog Devices offers steady, reliable expansion but lacks NVIDIA’s exponential momentum and operational leverage. For investors, NVIDIA’s profile appeals to those prioritizing market dominance and margin power, while Analog Devices suits those favoring measured growth and steady profitability.
Financial Ratios Comparison
These vital ratios act as a diagnostic tool to expose the underlying fiscal health, valuation premiums, and capital efficiency of the companies compared below:
| Ratios | NVIDIA Corporation (NVDA) | Analog Devices, Inc. (ADI) |
|---|---|---|
| ROE | 91.87% | 6.70% |
| ROIC | 75.28% | 5.55% |
| P/E | 39.90 | 51.05 |
| P/B | 36.66 | 3.42 |
| Current Ratio | 4.44 | 2.19 |
| Quick Ratio | 3.88 | 1.68 |
| D/E | 0.13 | 0.26 |
| Debt-to-Assets | 9.20% | 18.05% |
| Interest Coverage | 330.0 | 9.45 |
| Asset Turnover | 1.17 | 0.23 |
| Fixed Asset Turnover | 16.16 | 3.32 |
| Payout ratio | 1.14% | 84.88% |
| Dividend yield | 0.03% | 1.66% |
| Fiscal Year | 2025 | 2025 |
Efficiency & Valuation Duel: The Vital Signs
Financial ratios act as a company’s DNA, exposing hidden risks and operational strengths that shape investment decisions.
NVIDIA Corporation
NVIDIA delivers exceptional profitability with a 91.9% ROE and a strong 55.9% net margin, showcasing operational excellence. The stock trades at a high P/E of 39.9 and an elevated P/B of 36.7, signaling a stretched valuation. Shareholders see minimal dividends, reflecting a reinvestment focus on R&D and growth.
Analog Devices, Inc.
Analog Devices shows modest profitability with a 6.7% ROE and a 20.6% net margin, indicating steady but limited efficiency. The valuation is expensive with a P/E of 51.1 and a P/B of 3.4. The company maintains a 1.66% dividend yield, balancing shareholder returns with cautious growth investments.
Premium Valuation vs. Operational Safety
NVIDIA’s ratios highlight superior profitability but come with a stretched valuation, while Analog Devices offers a safer, dividend-supported profile at a higher P/E. Risk-tolerant investors may prefer NVIDIA’s growth potential; conservative profiles might favor Analog Devices’ steady income and moderate efficiency.
Which one offers the Superior Shareholder Reward?
I compare NVIDIA and Analog Devices’ shareholder rewards by analyzing dividend yields, payout ratios, and buyback intensity. NVIDIA delivers a minuscule 0.03% yield with a 1.1% payout ratio, signaling a reinvestment focus. Its buybacks complement growth-driven returns. Analog Devices yields 1.6%–2.1% with a hefty 50%–85% payout ratio, relying on dividends and steady buybacks. NVIDIA’s low payout and aggressive buybacks support sustainable growth and superior total returns. Analog Devices offers income but risks payout sustainability. I conclude NVIDIA offers a more attractive long-term shareholder reward in 2026.
Comparative Score Analysis: The Strategic Profile
The radar chart reveals the fundamental DNA and trade-offs of NVIDIA Corporation and Analog Devices, Inc., highlighting their core financial strengths and weaknesses:
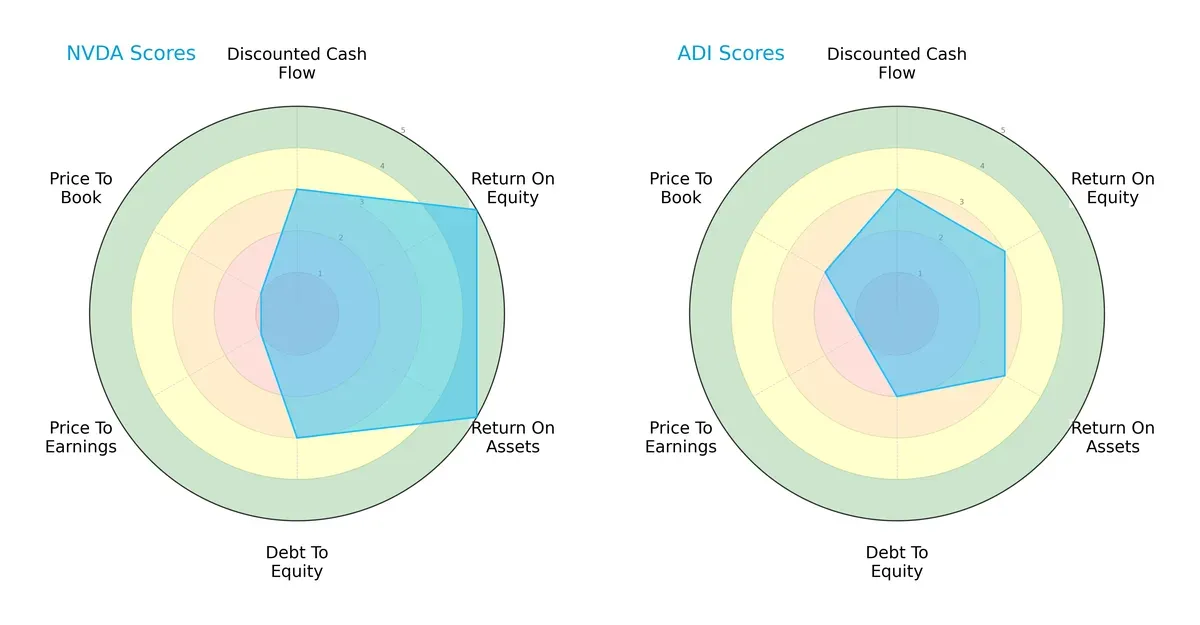
NVIDIA demonstrates superior profitability with top ROE and ROA scores (5 each), indicating excellent capital efficiency. Its moderate DCF and debt-to-equity scores reflect balanced growth and manageable leverage. However, its valuation metrics (PE and PB) score very low, signaling potential overvaluation risks. Analog Devices shows a more balanced, moderate profile across all metrics but lacks NVIDIA’s standout profitability edge. Its slightly better price-to-book ratio suggests modestly more attractive valuation compared to NVIDIA.
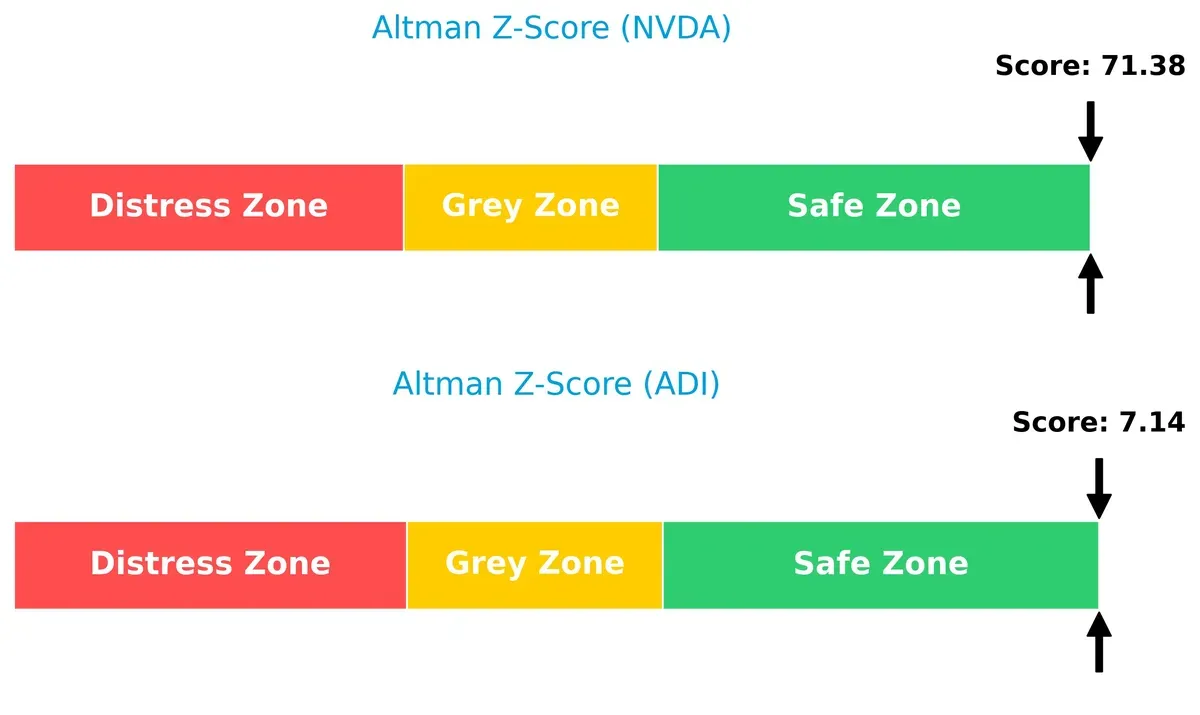
Bankruptcy Risk: Solvency Showdown
The Altman Z-Scores place both companies firmly in the safe zone, but NVIDIA’s much higher score (71.4 vs. 7.1) signals an exceptionally strong solvency position, underscoring its resilience through economic cycles:
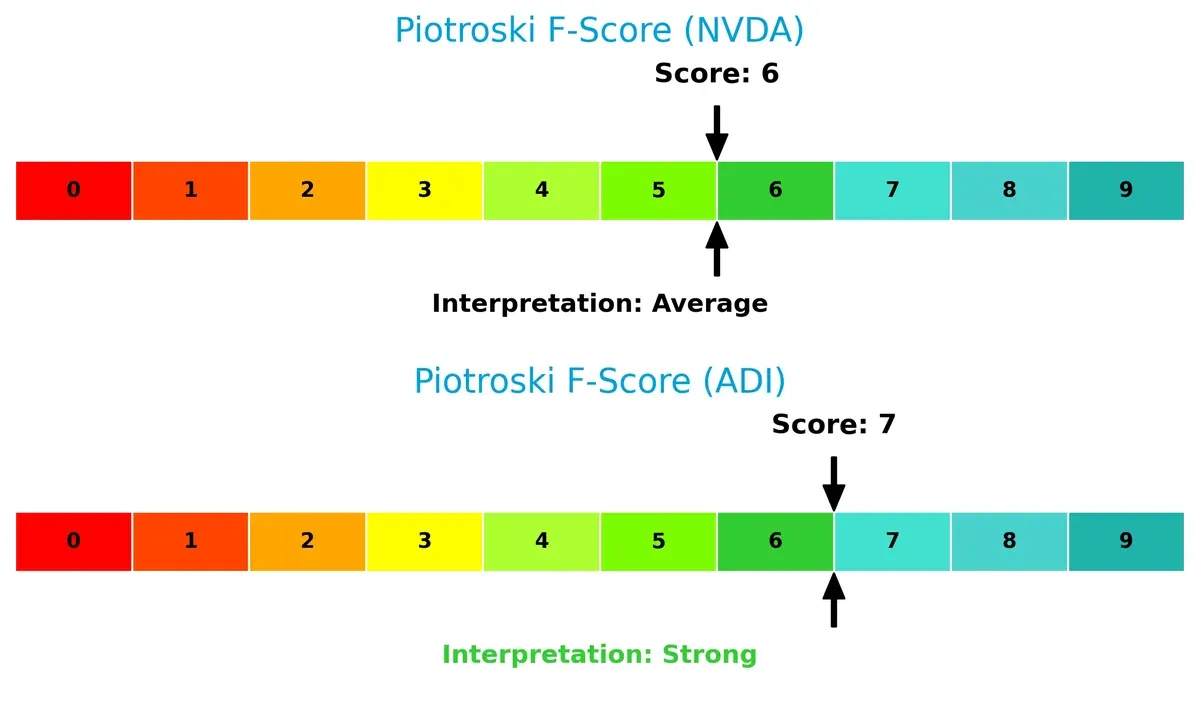
Financial Health: Quality of Operations
Analog Devices edges out NVIDIA in Piotroski F-Score (7 vs. 6), indicating slightly stronger internal financial health and operational quality. While both companies rank above average, NVIDIA’s marginally lower score suggests investors should monitor its underlying fundamentals more closely:
How are the two companies positioned?
This section dissects the operational DNA of NVDA and ADI by comparing their revenue distribution by segment and internal strengths and weaknesses. The goal is to confront their economic moats and identify which business model offers the most resilient and sustainable competitive advantage today.
Revenue Segmentation: The Strategic Mix
The following visual comparison dissects how NVIDIA Corporation and Analog Devices, Inc. diversify their income streams and where their primary sector bets lie:
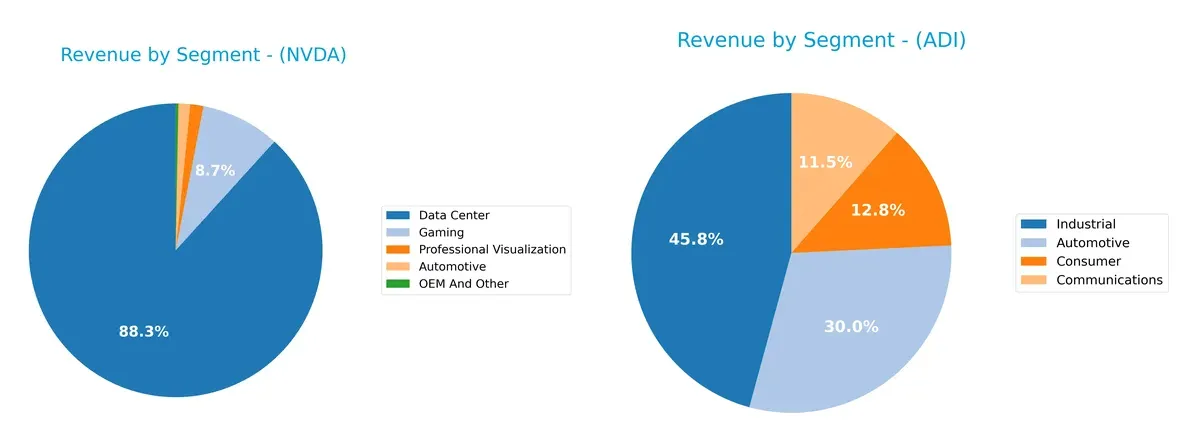
NVIDIA’s revenue anchors heavily on Data Center at $115B in 2025, dwarfing other segments like Gaming at $11.35B and Automotive at $1.69B. This concentration highlights NVIDIA’s dominance in AI infrastructure but exposes concentration risk. Conversely, Analog Devices shows a balanced mix, with Industrial at $4.31B leading but closely followed by Automotive ($2.83B), Consumer ($1.2B), and Communications ($1.08B). ADI’s diversification reduces vulnerability and signals a broader market footprint.
Strengths and Weaknesses Comparison
This table compares the Strengths and Weaknesses of NVIDIA Corporation and Analog Devices, Inc.:
NVIDIA Corporation Strengths
- Highly diversified with strong Data Center and Gaming revenues
- Exceptional profitability with net margin 55.85% and ROE 91.87%
- Robust global presence, especially in the US and Asia
- Low debt levels and strong interest coverage
- High asset turnover and operational efficiency
Analog Devices, Inc. Strengths
- Diversified across Automotive, Industrial, and Consumer segments
- Favorable current and quick ratios indicate solid liquidity
- Moderate debt with good interest coverage
- Strong presence in Europe, US, and Asia
- Stable dividend yield of 1.66% provides income potential
NVIDIA Corporation Weaknesses
- High valuation multiples with P/E 39.9 and P/B 36.66
- Elevated current ratio may indicate inefficient asset use
- WACC higher than ROIC, signaling capital cost concerns
- Very low dividend yield
- Heavy reliance on Data Center segment
Analog Devices, Inc. Weaknesses
- Lower profitability with ROE 6.7% and neutral ROIC
- Unfavorable asset turnover at 0.23
- High P/E at 51.05 and P/B 3.42 reflect valuation risks
- Less dominant market share in key segments
NVIDIA’s strengths lie in superior profitability and operational efficiency, though valuation and concentration risks persist. Analog Devices offers solid diversification and liquidity but faces challenges in profitability and asset utilization. These contrasts shape each firm’s strategic priorities in growth and capital management.
The Moat Duel: Analyzing Competitive Defensibility
A structural moat is the only barrier protecting long-term profits from relentless competitive erosion. Here’s how NVIDIA and Analog Devices stack up:
NVIDIA Corporation: Innovation-Driven Network Effects
NVIDIA’s moat centers on powerful network effects and intangible assets in AI and gaming GPUs. This drives a stellar ROIC at 60.6% above WACC, sustaining margin expansion. In 2026, AI and data center growth deepen its dominance but face intensifying chip supply competition.
Analog Devices, Inc.: Precision Analog Expertise
Analog Devices relies on specialized analog and mixed-signal technologies, creating a niche moat distinct from NVIDIA’s scale. Its ROIC trails WACC by 2.8%, signaling value erosion despite improving profitability. Expansion into automotive and industrial IoT offers growth but may not widen its moat swiftly.
Network Effects vs. Niche Specialization: Who Defends Better?
NVIDIA’s network-driven moat is wider and far deeper, generating robust economic profits and accelerating growth. Analog Devices improves but still sheds value, reflecting a weaker moat. NVIDIA is clearly better equipped to defend and expand its market share in 2026.
Which stock offers better returns?
The past year saw NVIDIA’s shares more than double, while Analog Devices also posted strong gains with accelerating momentum and rising trading volumes. These trends reflect diverging growth dynamics in their market segments.
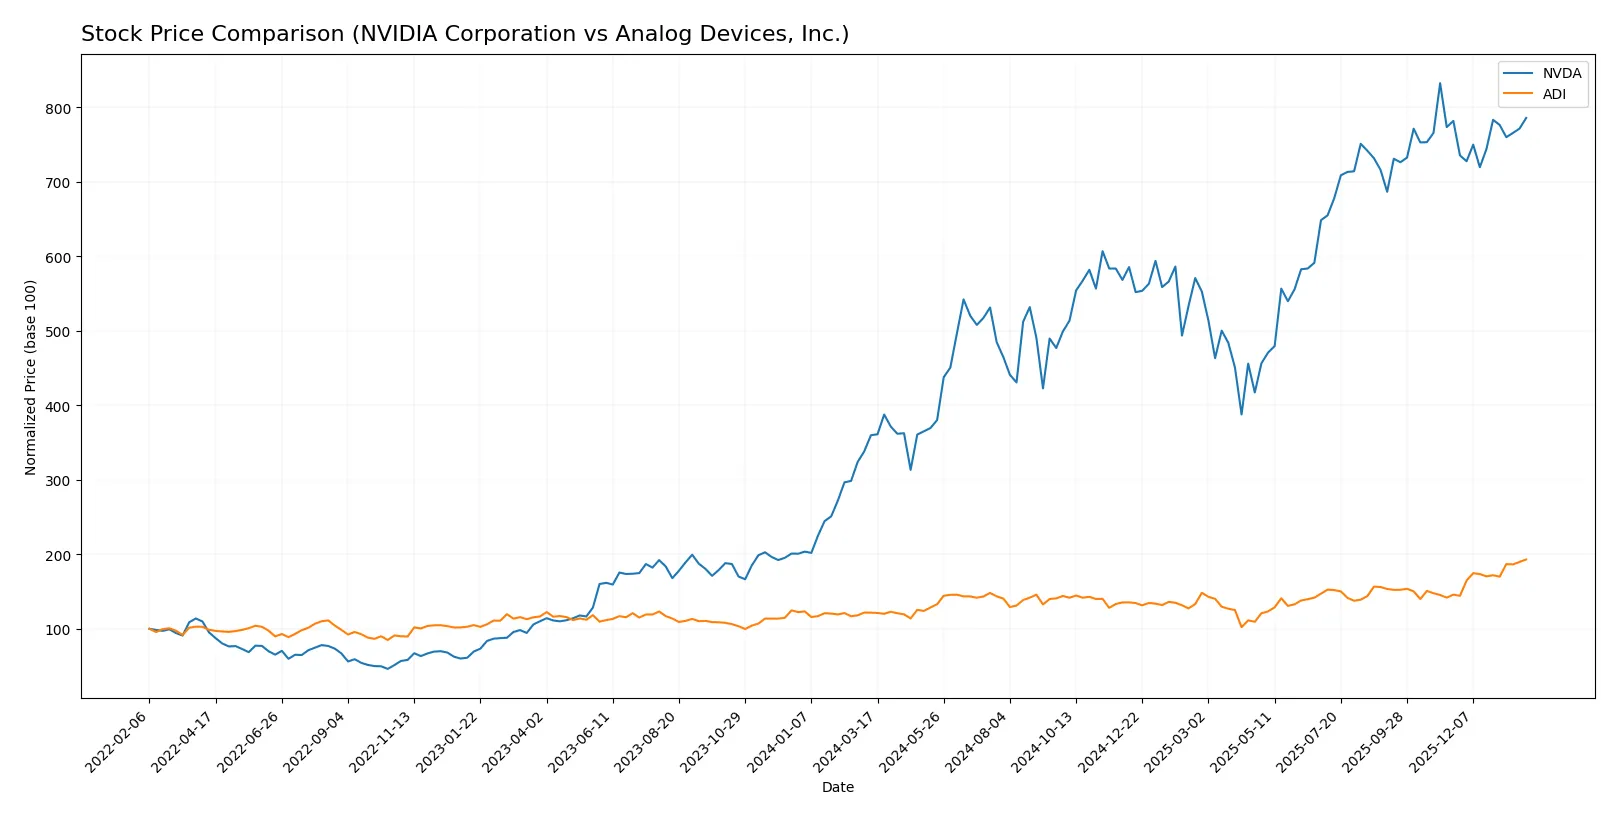
Trend Comparison
NVIDIA’s stock rose 118.36% over the past year, marking a bullish trend with decelerating price gains. The highest price hit 202.49, with volatility at a 32.29 standard deviation level.
Analog Devices gained 58.66% over the same period, showing a bullish trend with accelerating momentum. Its volatility measured 26.38, and the stock reached a peak of 310.88.
NVIDIA outperformed Analog Devices in market returns despite slowing acceleration, delivering the highest overall price appreciation in the 12-month span.
Target Prices
Analysts hold bullish views on NVIDIA Corporation and Analog Devices, Inc., reflecting strong sector momentum and growth prospects.
| Company | Target Low | Target High | Consensus |
|---|---|---|---|
| NVIDIA Corporation | 140 | 352 | 265.21 |
| Analog Devices, Inc. | 270 | 375 | 316 |
The consensus target for NVIDIA stands well above its current price of 191.13, signaling robust expected appreciation. Analog Devices’ target consensus slightly exceeds its current price of 310.88, indicating moderate upside potential.

Don’t Let Luck Decide Your Entry Point
Optimize your entry points with our advanced ProRealTime indicators. You’ll get efficient buy signals with precise price targets for maximum performance. Start outperforming now!
How do institutions grade them?
NVIDIA Corporation Grades
Here are recent institutional grades for NVIDIA Corporation from various analysts:
| Grading Company | Action | New Grade | Date |
|---|---|---|---|
| Jefferies | Maintain | Buy | 2026-01-16 |
| Mizuho | Maintain | Outperform | 2026-01-09 |
| Stifel | Maintain | Buy | 2025-12-29 |
| Truist Securities | Maintain | Buy | 2025-12-29 |
| Baird | Maintain | Outperform | 2025-12-26 |
| Bernstein | Maintain | Outperform | 2025-12-26 |
| B of A Securities | Maintain | Buy | 2025-12-26 |
| Truist Securities | Maintain | Buy | 2025-12-19 |
| Tigress Financial | Maintain | Strong Buy | 2025-12-18 |
| Morgan Stanley | Maintain | Overweight | 2025-12-01 |
Analog Devices, Inc. Grades
Below are recent grades for Analog Devices, Inc. from credible grading firms:
| Grading Company | Action | New Grade | Date |
|---|---|---|---|
| Susquehanna | Maintain | Positive | 2026-01-22 |
| B of A Securities | Maintain | Buy | 2026-01-21 |
| Stifel | Maintain | Buy | 2026-01-16 |
| Oppenheimer | Maintain | Outperform | 2026-01-16 |
| Wells Fargo | Upgrade | Overweight | 2026-01-15 |
| Citigroup | Maintain | Buy | 2026-01-15 |
| Keybanc | Maintain | Overweight | 2026-01-13 |
| Truist Securities | Maintain | Hold | 2025-12-19 |
| UBS | Maintain | Buy | 2025-12-08 |
| Truist Securities | Maintain | Hold | 2025-11-26 |
Which company has the best grades?
NVIDIA consistently receives Buy and Outperform ratings, including a Strong Buy, reflecting strong analyst confidence. Analog Devices also earns mostly Buy and Outperform grades but with some Hold ratings. NVIDIA’s superior consensus grades may signal greater institutional enthusiasm, impacting investor sentiment positively.
Risks specific to each company
The following categories pinpoint critical pressure points and systemic threats facing NVIDIA Corporation and Analog Devices, Inc. in the 2026 market environment:
1. Market & Competition
NVIDIA Corporation
- Dominates AI and gaming GPUs but faces intense competition in AI chip markets.
Analog Devices, Inc.
- Strong in analog and mixed-signal ICs with steady industrial demand but less disruptive innovation.
2. Capital Structure & Debt
NVIDIA Corporation
- Low debt-to-equity (0.13) and strong interest coverage (341x) indicate robust balance sheet.
Analog Devices, Inc.
- Higher debt-to-equity (0.26) and lower interest coverage (9.5x) suggest more leverage risk.
3. Stock Volatility
NVIDIA Corporation
- High beta at 2.31 indicates elevated price volatility and sensitivity to market swings.
Analog Devices, Inc.
- Beta near 1.03 reflects more stable stock price behavior and lower market risk.
4. Regulatory & Legal
NVIDIA Corporation
- Faces regulatory scrutiny on export controls and antitrust due to geopolitical tensions.
Analog Devices, Inc.
- Subject to standard semiconductor regulations with fewer geopolitical export restrictions.
5. Supply Chain & Operations
NVIDIA Corporation
- Global supply chain exposed to geopolitical risks but benefits from scale and diversified suppliers.
Analog Devices, Inc.
- More focused supply chain with industrial clients, less exposure to volatile consumer markets.
6. ESG & Climate Transition
NVIDIA Corporation
- Increasing focus on energy-efficient AI chips but high power consumption remains a challenge.
Analog Devices, Inc.
- Strong commitment to sustainability in industrial products, better alignment with ESG trends.
7. Geopolitical Exposure
NVIDIA Corporation
- High exposure to US-China tensions impacting semiconductor exports and collaborations.
Analog Devices, Inc.
- Moderate geopolitical exposure, diversified client base across stable regions.
Which company shows a better risk-adjusted profile?
NVIDIA’s greatest risk lies in market volatility and geopolitical export controls, while Analog Devices faces capital structure and innovation pace challenges. Despite NVIDIA’s high beta, its dominant market position and superior financial strength offer a better risk-adjusted profile. Recent data show NVIDIA’s debt remains minimal with exceptional interest coverage, underscoring financial resilience amid uncertainty.
Final Verdict: Which stock to choose?
NVIDIA’s superpower lies in its exceptional capital efficiency and rapid profit expansion, outpacing peers with a durable competitive moat. Its premium valuation and elevated current ratio signal a point of vigilance. NVIDIA suits investors targeting aggressive growth with tolerance for stretched multiples.
Analog Devices boasts a strategic moat rooted in steady recurring revenues and conservative balance sheet management. It offers a safer profile than NVIDIA, with solid free cash flow yield and strong financial health scores. ADI fits well within GARP portfolios seeking stability combined with moderate growth.
If you prioritize high-growth exposure and a company that consistently outshines peers in return on invested capital, NVIDIA is the compelling choice despite valuation risks. However, if you seek better stability and steady cash generation anchored by a resilient moat, Analog Devices offers a more balanced, risk-conscious scenario.
Disclaimer: Investment carries a risk of loss of initial capital. The past performance is not a reliable indicator of future results. Be sure to understand risks before making an investment decision.
Go Further
I encourage you to read the complete analyses of NVIDIA Corporation and Analog Devices, Inc. to enhance your investment decisions: