Home > Comparison > Technology > TSEM vs NVEC
The strategic rivalry between Tower Semiconductor Ltd. and NVE Corporation shapes the semiconductor sector’s innovation frontier. Tower operates as a capital-intensive foundry specializing in analog and mixed-signal devices. NVE, by contrast, is a niche player focused on spintronic sensor technology with a leaner operational model. This analysis explores their divergent paths to determine which offers superior risk-adjusted returns for a diversified portfolio amid evolving industry dynamics.
Table of contents
Companies Overview
Tower Semiconductor Ltd. and NVE Corporation both command unique niches within the semiconductor industry, shaping technological innovation across diverse applications.
Tower Semiconductor Ltd.: Independent Analog and Mixed-Signal Foundry
Tower Semiconductor Ltd. stands as a leading independent foundry specializing in analog intensive mixed-signal semiconductors. It generates revenue chiefly by providing customizable fabrication services and advanced process technologies like SiGe and MEMS. In 2026, the company’s strategic focus centers on expanding its wafer fabrication capacity and enhancing design enablement platforms to serve automotive, industrial, and aerospace clients more effectively.
NVE Corporation: Spintronics Innovator for Industrial Automation
NVE Corporation pioneers in the spintronics sector, developing sensors and couplers that leverage electron spin for data acquisition and transmission. Its core revenue derives from manufacturing spintronic products aimed primarily at factory automation and medical device markets. In 2026, NVE concentrates on advancing its industrial Internet of Things offerings and pursuing R&D contracts to license its magnetoresistive memory technology.
Strategic Collision: Similarities & Divergences
Tower Semiconductor embraces a broad analog foundry model, offering diverse process technologies, while NVE focuses on a niche spintronics innovation. Their primary competition unfolds in delivering cutting-edge semiconductor solutions to industrial and medical sectors. Investors face contrasting profiles: Tower commands scale and process versatility, whereas NVE offers specialized technology with high growth potential but limited scale.
Income Statement Comparison
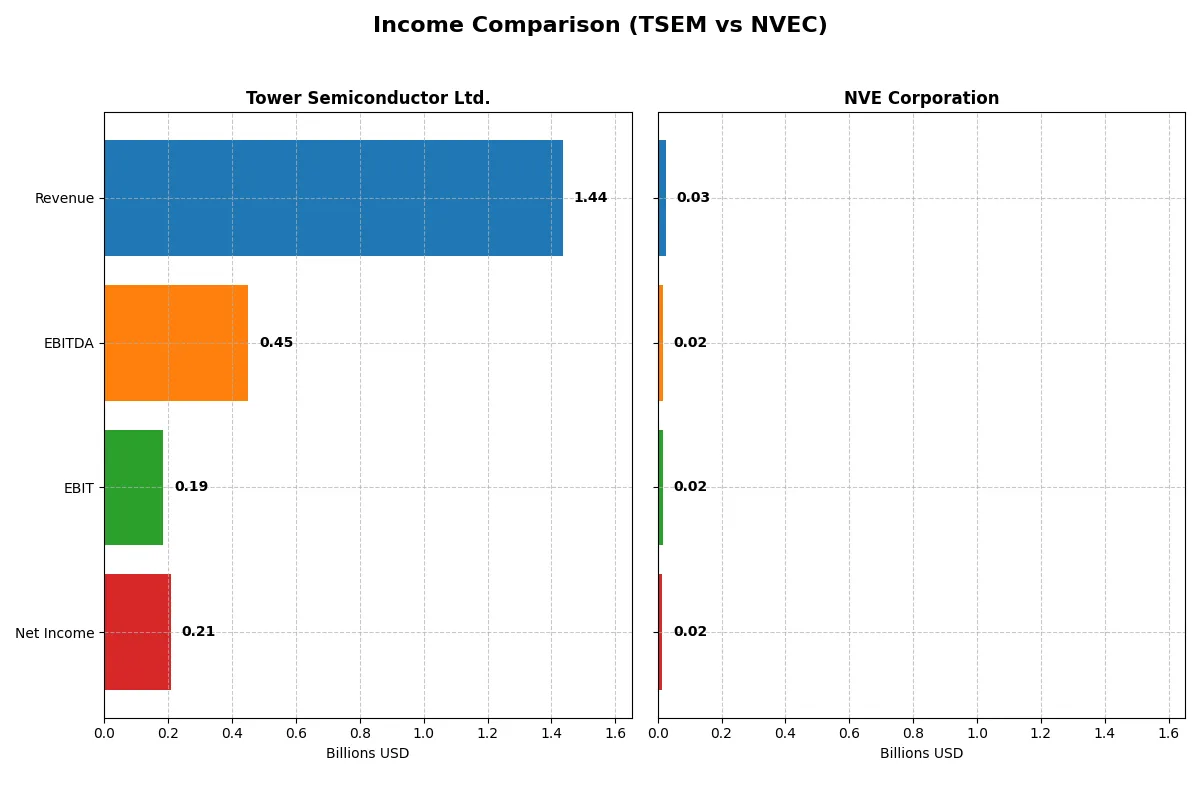
This data dissects the core profitability and scalability of both corporate engines to reveal who dominates the bottom line:
| Metric | Tower Semiconductor Ltd. (TSEM) | NVE Corporation (NVEC) |
|---|---|---|
| Revenue | 1.44B | 25.9M |
| Cost of Revenue | 1.10B | 4.24M |
| Operating Expenses | 148.1M | 5.64M |
| Gross Profit | 339.4M | 21.6M |
| EBITDA | 451.3M | 16.3M |
| EBIT | 185.0M | 16.0M |
| Interest Expense | 5.86M | 0 |
| Net Income | 207.9M | 15.1M |
| EPS | 1.87 | 3.12 |
| Fiscal Year | 2024 | 2025 |
Income Statement Analysis: The Bottom-Line Duel
This income statement comparison reveals which company converts revenue into profit most efficiently in their respective markets.
Tower Semiconductor Ltd. Analysis
Tower Semiconductor’s revenue rose modestly by 0.94% in 2024 to $1.44B, yet net income plunged 60.3% to $208M, reflecting margin pressure. Gross margin slipped slightly to 23.6%, while net margin contracted to 14.5%. The sharp EBIT decline signals operating challenges despite a favorable five-year growth trend in revenue (13.5%) and net income (153%).
NVE Corporation Analysis
NVE Corporation posted a 13.2% revenue decline in fiscal 2025 to $26M, but it sustained a robust net margin of 58.2% and generated $15M in net income. Its gross margin remains exceptionally high at 83.6%, with EBIT margin at 61.8%. Despite short-term revenue headwinds, NVE’s consistent margin strength underpins ongoing profitability growth over the 2021–2025 period.
Margin Dominance vs. Revenue Resilience
NVE’s commanding margins and strong EBIT yield offer a clear edge in profitability efficiency over Tower Semiconductor’s larger but struggling revenue base. Tower’s recent income contraction and margin deterioration contrast with NVE’s ability to maintain high profitability despite a sales dip. Investors seeking durable earnings quality may favor NVE’s lean, high-margin profile over Tower’s scale-dependent performance.
Financial Ratios Comparison
These vital ratios act as a diagnostic tool to expose the underlying fiscal health, valuation premiums, and capital efficiency of the companies compared below:
| Ratios | Tower Semiconductor Ltd. (TSEM) | NVE Corporation (NVEC) |
|---|---|---|
| ROE | 7.83% | 24.19% |
| ROIC | 6.41% | 21.14% |
| P/E | 27.54 | 20.46 |
| P/B | 2.16 | 4.95 |
| Current Ratio | 6.18 | 28.40 |
| Quick Ratio | 5.23 | 22.03 |
| D/E | 0.07 | 0.01 |
| Debt-to-Assets | 5.87% | 1.43% |
| Interest Coverage | 32.64 | 0 |
| Asset Turnover | 0.47 | 0.40 |
| Fixed Asset Turnover | 1.11 | 8.91 |
| Payout ratio | 0 | 128% |
| Dividend yield | 0% | 6.28% |
| Fiscal Year | 2024 | 2025 |
Efficiency & Valuation Duel: The Vital Signs
Ratios act as a company’s DNA, revealing hidden risks and operational excellence behind the financial statements.
Tower Semiconductor Ltd.
Tower Semiconductor shows moderate profitability with a 7.8% ROE and a 14.5% net margin, but its 27.5 P/E ratio signals an expensive valuation. The company posts a strong current ratio of 6.18, flagged as unfavorable due to excess liquidity. It pays no dividend, instead reinvesting cautiously in R&D at 1.4% of revenue to support growth.
NVE Corporation
NVE Corporation outperforms with a robust 24.2% ROE and an impressive 58.2% net margin, reflecting operational efficiency. Its valuation is reasonable at a 20.5 P/E, though a high 4.95 P/B ratio suggests stretched equity pricing. NVE returns value through a 6.3% dividend yield while allocating 14% of revenue to R&D for innovation.
Premium Valuation vs. Operational Safety
NVE delivers superior profitability and shareholder returns with a balanced valuation, while Tower Semiconductor carries a higher P/E but less efficient capital use. Investors favoring growth and income may lean toward NVE’s profile, whereas those valuing liquidity and reinvestment might consider Tower’s cautious approach.
Which one offers the Superior Shareholder Reward?
I observe that Tower Semiconductor Ltd. (TSEM) pays no dividends and maintains a minimal free cash flow yield with a payout ratio of zero. It prioritizes reinvestment and modest buybacks, with a free cash flow per share of just 0.11 in 2024. In contrast, NVE Corporation (NVEC) combines a strong dividend yield near 6% in 2025 with a high payout ratio above 100%, supported by robust free cash flow per share of 2.7. NVEC’s aggressive buybacks and consistent dividend payments signal a shareholder-friendly capital allocation. I judge NVEC’s distribution model more sustainable and rewarding, offering superior total shareholder returns in 2026.
Comparative Score Analysis: The Strategic Profile
The radar chart reveals the fundamental DNA and trade-offs of Tower Semiconductor Ltd. and NVE Corporation, highlighting their strengths and vulnerabilities:
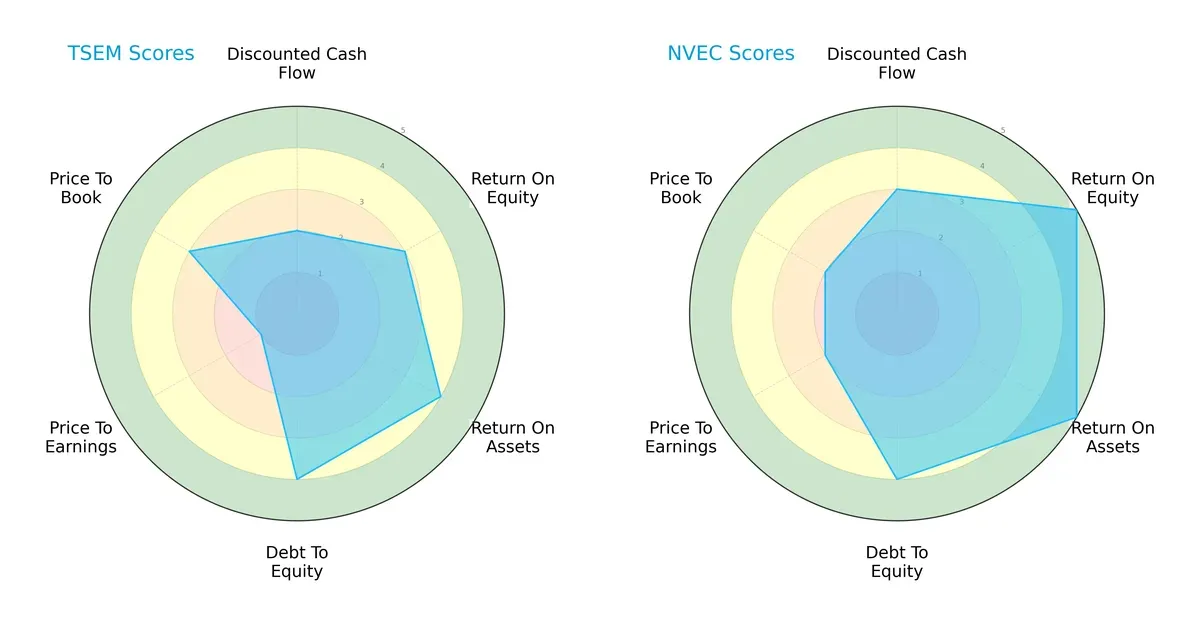
NVE Corporation shows a more balanced profile with superior ROE (5 vs. 3) and ROA (5 vs. 4) scores, indicating efficient capital and asset utilization. Tower Semiconductor Ltd. leans on stronger debt management (debt-to-equity score 4 for both but with better ROA) but suffers from a very unfavorable P/E score (1 vs. 2), signaling potential overvaluation risks. NVE’s moderate DCF and valuation scores reinforce its overall financial robustness compared to TSEM’s moderate and weaker valuation metrics.
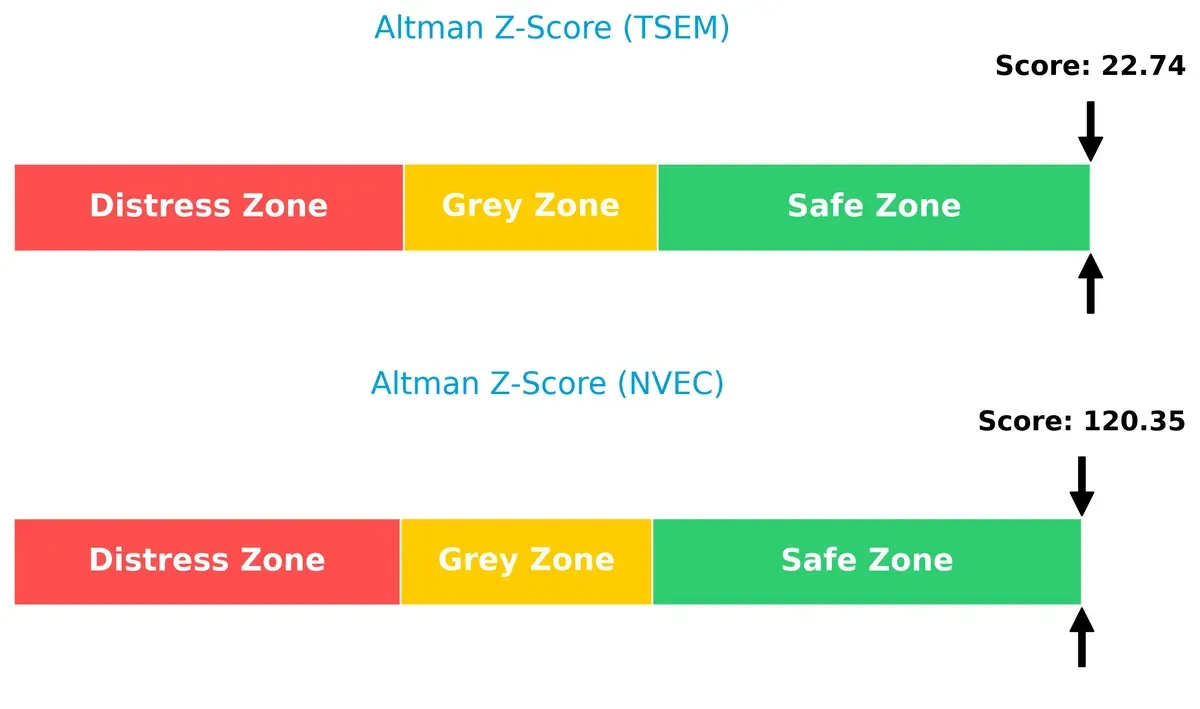
Bankruptcy Risk: Solvency Showdown
The Altman Z-Score difference between Tower Semiconductor Ltd. (22.7) and NVE Corporation (120.4) implies both firms are in the safe zone, but NVE’s extraordinarily high score signals exceptionally strong solvency and minimal bankruptcy risk in this cycle:
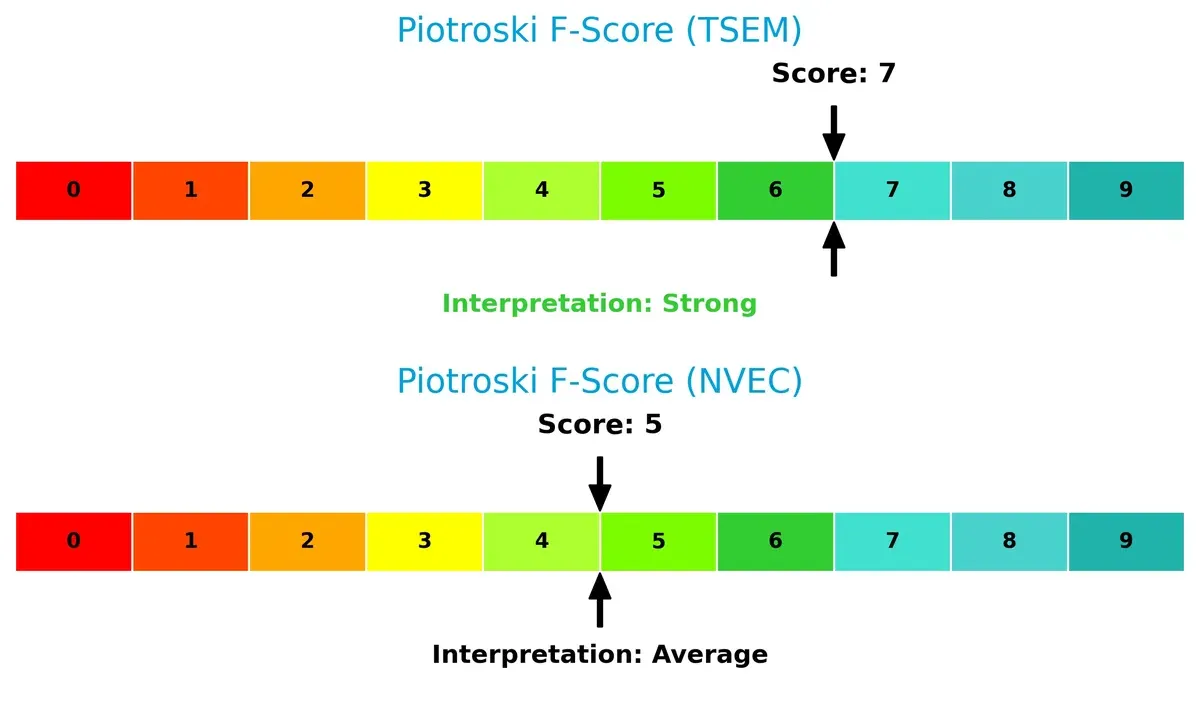
Financial Health: Quality of Operations
Tower Semiconductor Ltd.’s Piotroski F-Score of 7 indicates strong financial health, outperforming NVE Corporation’s average score of 5. This suggests TSEM maintains more robust internal fundamentals, though NVE remains stable without red flags:
How are the two companies positioned?
This section dissects Tower Semiconductor and NVE’s operational DNA by comparing revenue distribution and internal strengths and weaknesses. The goal is to confront their economic moats to identify which model offers the most resilient competitive advantage today.
Revenue Segmentation: The Strategic Mix
This comparison dissects how Tower Semiconductor Ltd. and NVE Corporation diversify their income streams and highlights their primary sector bets:
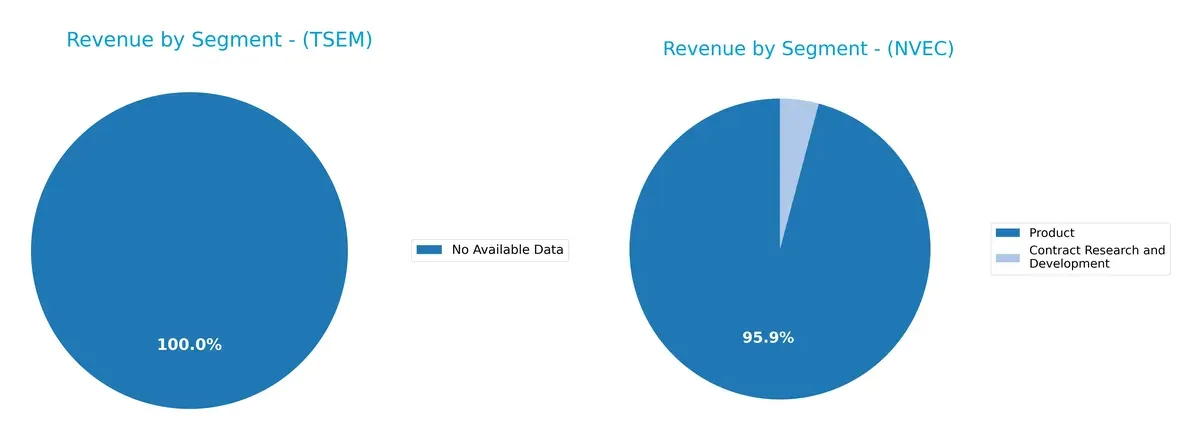
Tower Semiconductor Ltd. lacks available revenue segmentation data, limiting analysis. NVE Corporation relies heavily on its Product segment, generating around $25.9B in 2022 and anchoring its revenue. Contract Research and Development contributes under $1.2M, showing minimal diversification. NVE’s concentration in Product signals strong infrastructure dominance but exposes it to sector-specific risks without broader ecosystem lock-in.
Strengths and Weaknesses Comparison
This table compares the strengths and weaknesses of Tower Semiconductor Ltd. and NVE Corporation:
TSEM Strengths
- Favorable net margin at 14.47%
- Low debt-to-assets at 5.87%
- High interest coverage at 31.57
- Strong quick ratio at 5.23
- Favorable WACC below ROIC
NVEC Strengths
- Exceptionally high net margin at 58.22%
- ROE and ROIC strongly favorable at 24.19% and 21.14%
- Very low debt-to-assets at 1.43%
- Infinite interest coverage
- High fixed asset turnover at 8.91
TSEM Weaknesses
- Unfavorable ROE at 7.83% below WACC
- PE ratio high at 27.54
- Low asset turnover at 0.47
- Unfavorable current ratio at 6.18
- No dividend yield
NVEC Weaknesses
- Unfavorable PB ratio at 4.95
- Very high current ratio at 28.4 may indicate inefficiency
- Lower asset turnover at 0.4
- Neutral WACC slightly above ROIC
Tower Semiconductor shows solid financial health with conservative leverage but struggles with profitability metrics like ROE and asset efficiency. NVE Corporation excels in profitability and asset utilization but faces potential liquidity inefficiencies reflected in an abnormally high current ratio and valuation concerns. These factors shape their strategic financial positioning within their sectors.
The Moat Duel: Analyzing Competitive Defensibility
A structural moat is the only thing protecting long-term profits from the erosion of competition. Let’s examine the core advantages of these two semiconductor firms:
Tower Semiconductor Ltd.: Custom Process Technology Moat
Tower Semiconductor’s moat lies in its customizable analog and mixed-signal process technologies. This specialization supports decent margin stability but ROIC trails WACC, signaling value erosion. New product development and market expansion in automotive and industrial sectors could deepen this moat if executed well.
NVE Corporation: Spintronics Innovation Moat
NVE’s moat stems from proprietary spintronic nanotechnology, a rare and complex intangible asset. It delivers exceptional profitability with ROIC well above WACC, reflecting strong capital efficiency. Growth in industrial IoT and medical sensors offers promising avenues to widen its competitive lead.
Moat Battle: Specialized Technology vs. Breakthrough Innovation
NVE holds the deeper moat with a sustainable ROIC advantage and unique technology that commands premium margins. Tower’s moat is narrower, challenged by value destruction despite rising ROIC. NVE appears better equipped to defend and grow its market share in 2026.
Which stock offers better returns?
Over the past year, Tower Semiconductor Ltd. surged sharply, while NVE Corporation declined, highlighting contrasting trading dynamics and investor sentiment between these two semiconductor stocks.
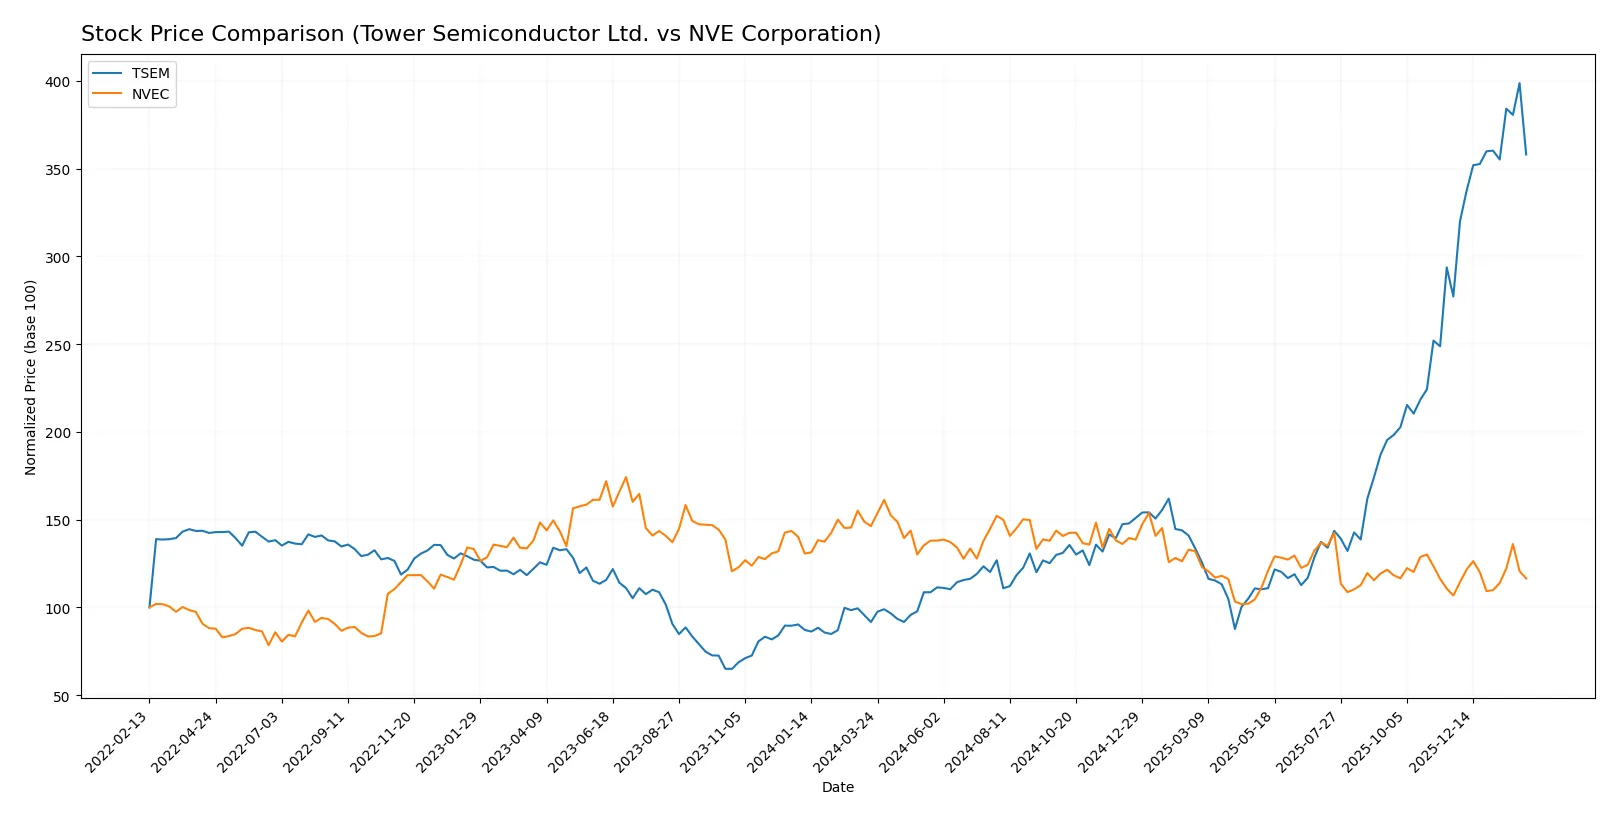
Trend Comparison
Tower Semiconductor Ltd. posted a strong 291% gain over 12 months, showing an accelerating bullish trend with high volatility. It hit a low of 29.65 and a high of 134.73.
NVE Corporation declined 20.4% over the same period, marking an accelerating bearish trend with moderate volatility. Its price ranged from 56.99 to 90.18.
Tower Semiconductor Ltd. outperformed NVE Corporation significantly, delivering the highest market returns and stronger momentum over the past year.
Target Prices
Tower Semiconductor Ltd. shows a clear target consensus from credible analysts.
| Company | Target Low | Target High | Consensus |
|---|---|---|---|
| Tower Semiconductor Ltd. | 66 | 125 | 96 |
Analysts expect Tower Semiconductor’s price to average 20% below the current 120.08 USD stock price, signaling potential downside risk despite recent strength. No verified target price data is available for NVE Corporation.

Don’t Let Luck Decide Your Entry Point
Optimize your entry points with our advanced ProRealTime indicators. You’ll get efficient buy signals with precise price targets for maximum performance. Start outperforming now!
How do institutions grade them?
The following tables summarize recent institutional grades for Tower Semiconductor Ltd. and NVE Corporation:
Tower Semiconductor Ltd. Grades
The table below shows Tower Semiconductor Ltd.’s latest grades from reputable analysts.
| Grading Company | Action | New Grade | Date |
|---|---|---|---|
| Benchmark | Maintain | Buy | 2026-01-09 |
| Wedbush | Downgrade | Neutral | 2025-12-31 |
| Benchmark | Maintain | Buy | 2025-11-11 |
| Susquehanna | Maintain | Positive | 2025-11-11 |
| Wedbush | Maintain | Outperform | 2025-11-11 |
| Barclays | Maintain | Equal Weight | 2025-11-11 |
| Benchmark | Maintain | Buy | 2025-09-08 |
| Susquehanna | Maintain | Positive | 2025-08-05 |
| Benchmark | Maintain | Buy | 2025-08-05 |
| Benchmark | Maintain | Buy | 2025-08-04 |
Which company has the best grades?
Tower Semiconductor Ltd. has multiple Buy and Positive ratings with occasional Neutral and Equal Weight grades. NVE Corporation has no institutional grades available. This disparity leaves Tower Semiconductor as the better-graded stock, offering investors clearer analyst sentiment signals.
Risks specific to each company
The following categories identify the critical pressure points and systemic threats facing both firms in the 2026 market environment:
1. Market & Competition
Tower Semiconductor Ltd.
- Faces intense competition in semiconductor foundry with moderate asset turnover signaling operational constraints.
NVE Corporation
- Operates in niche spintronics market with high fixed asset turnover but limited scale and higher market volatility.
2. Capital Structure & Debt
Tower Semiconductor Ltd.
- Maintains low debt (D/E 0.07) and strong interest coverage (31.57), indicating solid balance sheet.
NVE Corporation
- Extremely low leverage (D/E 0.01), practically no debt risk, with infinite interest coverage.
3. Stock Volatility
Tower Semiconductor Ltd.
- Beta of 0.89 suggests lower volatility than market, offering relative stability.
NVE Corporation
- Higher beta of 1.22 exposes investors to amplified market swings and risk.
4. Regulatory & Legal
Tower Semiconductor Ltd.
- Global footprint across US, Asia, Europe exposes to diverse regulatory environments and compliance costs.
NVE Corporation
- US-focused with specialized technologies, but potential IP and licensing legal risks in spintronics R&D.
5. Supply Chain & Operations
Tower Semiconductor Ltd.
- Complex global supply chain and wafer fabrication process pose operational and geopolitical risks.
NVE Corporation
- Smaller scale and specialized components may limit supply chain complexity but increase dependency on niche suppliers.
6. ESG & Climate Transition
Tower Semiconductor Ltd.
- Large manufacturing footprint implies notable energy consumption and emissions to manage during energy transition.
NVE Corporation
- Lower scale may reduce environmental impact, but R&D intensity requires attention to sustainable innovation.
7. Geopolitical Exposure
Tower Semiconductor Ltd.
- Headquartered in Israel with operations in multiple regions, faces geopolitical tensions impacting supply and sales.
NVE Corporation
- US-based with less direct exposure but reliant on global industrial IoT markets sensitive to trade policies.
Which company shows a better risk-adjusted profile?
Tower Semiconductor’s greatest risk lies in its complex global supply chain and geopolitical exposure. NVE Corporation faces significant stock volatility and niche market dependency. Overall, NVE shows a better risk-adjusted profile, supported by stronger profitability and balance sheet metrics despite higher beta. Tower’s broad market exposure demands caution amid 2026’s shifting geopolitical landscape.
Final Verdict: Which stock to choose?
Tower Semiconductor Ltd. (TSEM) impresses with its robust liquidity and steadily improving profitability, reflecting a resilient operational engine. Its main point of vigilance lies in a slightly unfavorable ROIC relative to WACC, signaling ongoing challenges in creating value. TSEM could suit investors seeking turnaround potential within an Aggressive Growth portfolio.
NVE Corporation (NVEC) stands out for its commanding economic moat, driven by exceptional margins and efficient capital use. Its pristine balance sheet and higher return metrics offer better financial safety compared to TSEM. NVEC fits well in a GARP (Growth at a Reasonable Price) portfolio, balancing growth with relative stability.
If you prioritize strong competitive advantages and consistent value creation, NVEC is the compelling choice due to its sustainable moat and superior returns. However, if you seek exposure to a recovering player with upside from improving profitability, TSEM offers a riskier but potentially rewarding scenario. Both demand careful monitoring of sector dynamics and execution risks.
Disclaimer: Investment carries a risk of loss of initial capital. The past performance is not a reliable indicator of future results. Be sure to understand risks before making an investment decision.
Go Further
I encourage you to read the complete analyses of Tower Semiconductor Ltd. and NVE Corporation to enhance your investment decisions: