Home > Comparison > Technology > TXN vs NVEC
The strategic rivalry between Texas Instruments Incorporated and NVE Corporation shapes the semiconductor sector’s evolution. Texas Instruments operates as a capital-intensive industrial giant with broad analog and embedded processing portfolios. In contrast, NVE Corporation specializes in niche spintronic sensor technology within semiconductors, emphasizing innovation over scale. This head-to-head pits scale and diversification against specialized innovation. This analysis aims to identify which corporate path offers superior risk-adjusted returns for a diversified portfolio.
Table of contents
Companies Overview
Texas Instruments Incorporated and NVE Corporation play pivotal roles in the semiconductor industry, each focusing on unique technologies and markets.
Texas Instruments Incorporated: Semiconductor Powerhouse
Texas Instruments dominates the semiconductor space through its Analog and Embedded Processing segments. It generates revenue by selling power management products and microcontrollers to diverse industries, including automotive and industrial. In 2026, it strategically emphasizes expanding its power solutions and embedded processing offerings to capture evolving electronics demands.
NVE Corporation: Spintronics Innovator
NVE Corporation specializes in spintronic technology, developing sensors and couplers that leverage electron spin for data transmission. Its core revenue comes from sales to factory automation and medical device markets. The company focuses on advancing spintronic applications and licensing magnetoresistive memory technology to grow its niche presence in 2026.
Strategic Collision: Similarities & Divergences
Texas Instruments prioritizes broad market reach with mature analog products, while NVE bets on proprietary spintronics innovation. They compete mainly in industrial sensing and automation sectors. TI’s scale and diversified portfolio contrast sharply with NVE’s specialized, high-beta profile, offering distinct investment dynamics anchored in market breadth versus technological differentiation.
Income Statement Comparison
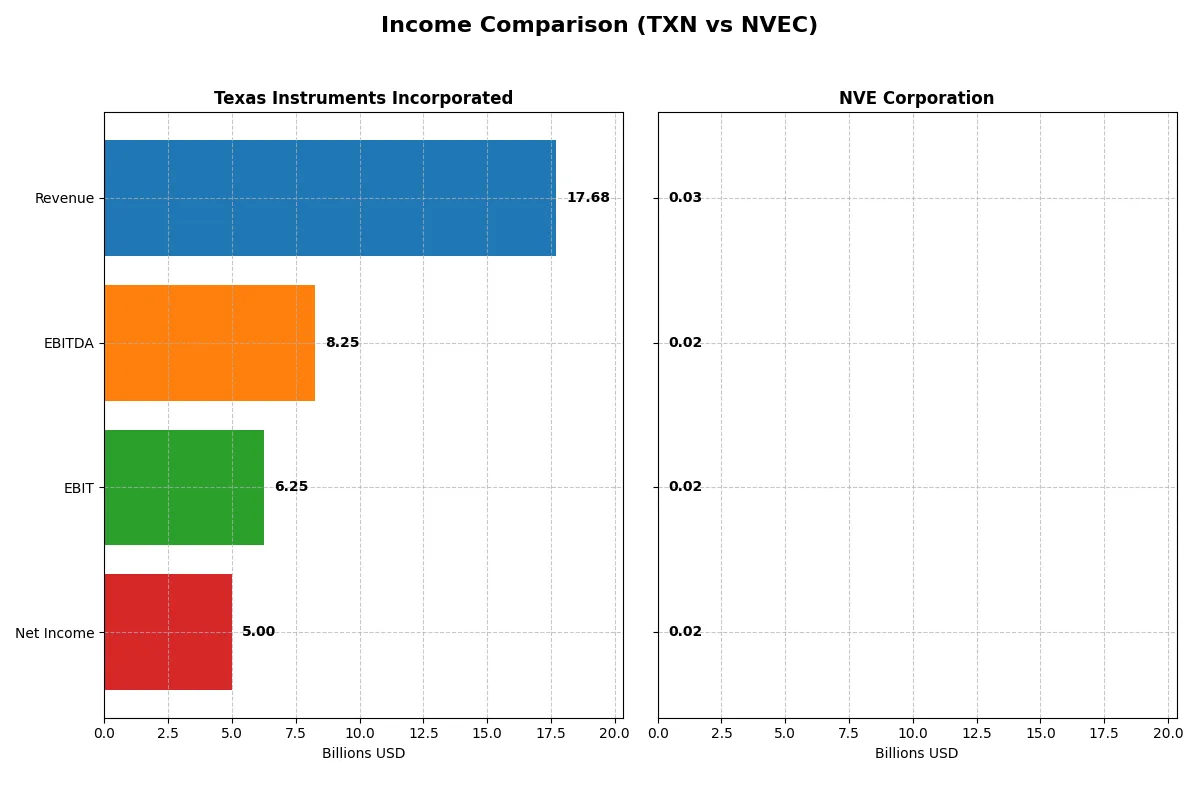
This data dissects the core profitability and scalability of both corporate engines to reveal who dominates the bottom line:
| Metric | Texas Instruments Incorporated (TXN) | NVE Corporation (NVEC) |
|---|---|---|
| Revenue | 17.7B | 26M |
| Cost of Revenue | 7.6B | 4.2M |
| Operating Expenses | 4.1B | 5.6M |
| Gross Profit | 10.1B | 22M |
| EBITDA | 8.3B | 16M |
| EBIT | 6.3B | 16M |
| Interest Expense | 543M | 0 |
| Net Income | 5.0B | 15M |
| EPS | 5.45 | 3.12 |
| Fiscal Year | 2025 | 2025 |
Income Statement Analysis: The Bottom-Line Duel
This income statement comparison reveals how each company transforms revenue into profit, highlighting operational efficiency and margin strength.
Texas Instruments Incorporated Analysis
Texas Instruments shows a revenue rebound to $17.7B in 2025 after a dip, with net income at $5B, reflecting solid earnings despite a downward trend over five years. Its gross margin remains healthy at 57%, while net margin sits at 28%, indicating strong cost control and operational discipline. The latest year reveals moderate EBIT growth but a slight net margin contraction, signaling cautious momentum.
NVE Corporation Analysis
NVE Corporation generates $25.9M in revenue for 2025, down from previous peaks, yet its net income at $15.1M reflects exceptional profitability. The company commands an impressive gross margin of 84% and a net margin of 58%, underlining its premium pricing or cost efficiency. Despite recent revenue declines, NVE sustains robust earnings momentum and margin expansion over the longer term.
Margin Dominance vs. Scale Resilience
Texas Instruments leverages scale with $17.7B revenue and mid-20% net margins, while NVE excels in margin dominance despite a modest $26M top line. NVE’s superior profitability ratio outpaces TXN’s, but TXN’s scale offers stability. For investors, NVE’s profile appeals for high-margin growth potential; TXN suits those focused on resilient revenue and solid cash flow.
Financial Ratios Comparison
These vital ratios act as a diagnostic tool to expose the underlying fiscal health, valuation premiums, and capital efficiency of the companies compared below:
| Ratios | Texas Instruments (TXN) | NVE Corporation (NVEC) |
|---|---|---|
| ROE | 30.7% | 24.2% |
| ROIC | 16.5% | 21.1% |
| P/E | 31.5 | 20.5 |
| P/B | 9.69 | 4.95 |
| Current Ratio | 4.35 | 28.40 |
| Quick Ratio | 2.83 | 22.03 |
| D/E (Debt-to-Equity) | 0.86 | 0.01 |
| Debt-to-Assets | 40.6% | 1.43% |
| Interest Coverage | 11.1 | 0 |
| Asset Turnover | 0.51 | 0.40 |
| Fixed Asset Turnover | 1.44 | 8.91 |
| Payout Ratio | 100.0% | 128.4% |
| Dividend Yield | 3.17% | 6.28% |
| Fiscal Year | 2025 | 2025 |
Efficiency & Valuation Duel: The Vital Signs
Ratios act as the company’s DNA, revealing hidden risks and operational excellence behind headline numbers.
Texas Instruments Incorporated
Texas Instruments shows robust profitability with a 30.7% ROE and a healthy 28.3% net margin. The stock trades at a stretched P/E of 31.5, suggesting premium valuation. It offers a solid 3.17% dividend yield, rewarding shareholders steadily while maintaining a strong reinvestment focus on R&D at 11.8% of revenue.
NVE Corporation
NVE impresses with a higher net margin of 58.2% and a respectable 24.2% ROE, reflecting operational efficiency. Its P/E of 20.5 is reasonable, though price-to-book at 4.95 is less attractive. NVE favors growth reinvestment, dedicating 14.1% of revenue to R&D, alongside a 6.28% dividend yield, balancing returns and innovation.
Premium Valuation vs. Operational Efficiency
NVE offers a more favorable ratio profile with higher profitability and better capital efficiency despite some valuation concerns. Texas Instruments commands a premium price but compensates with steady dividends and R&D investment. Value-oriented investors may prefer NVE’s efficiency, while income seekers might lean toward Texas Instruments’ dividend stability.
Which one offers the Superior Shareholder Reward?
I see Texas Instruments (TXN) distributes nearly all free cash flow via dividends, yielding ~3.2% with a payout ratio near 100%. Its buybacks are modest, indicating a conservative capital return. NVE Corporation (NVEC) offers a higher dividend yield around 6.3%, but with payout ratios exceeding 100%, relying heavily on buybacks to supplement returns. NVEC’s buybacks are aggressive, supported by strong free cash flow coverage above 90%. Historically in tech hardware, such high payout ratios risk sustainability. TXN’s model is more balanced, combining steady dividends and moderate buybacks, which I find more sustainable for long-term value. Despite NVEC’s punchier yield, TXN offers a superior total return profile in 2026 due to prudent capital allocation and solid cash flow fundamentals.
Comparative Score Analysis: The Strategic Profile
The radar chart reveals the fundamental DNA and trade-offs of Texas Instruments and NVE Corporation, illustrating their core financial strengths and vulnerabilities:
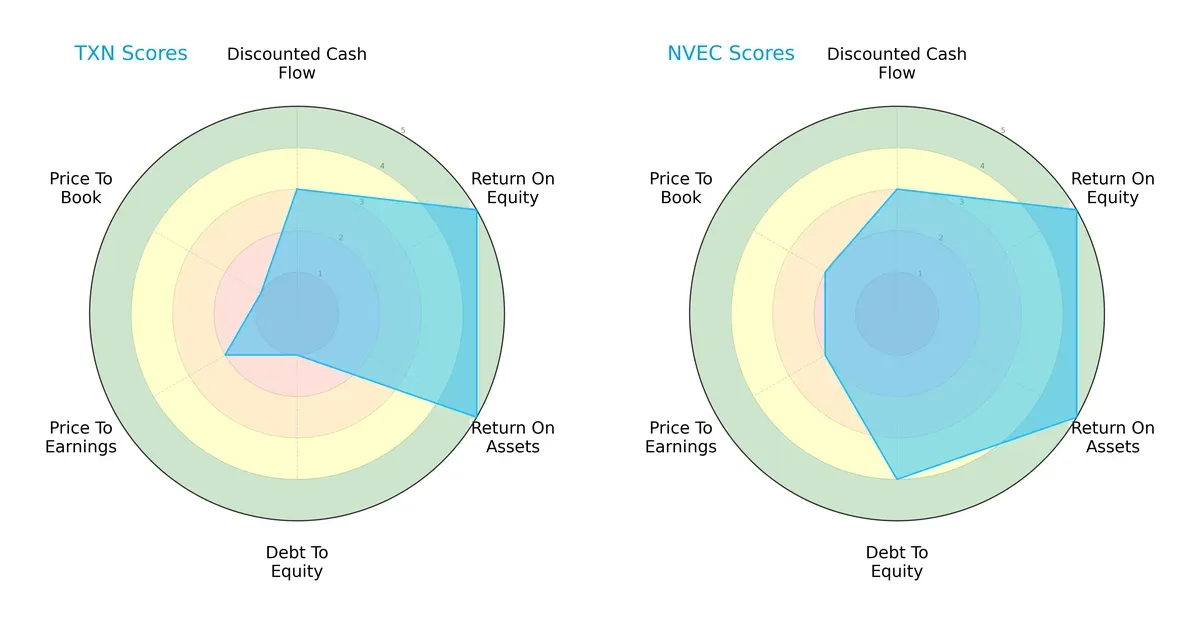
Texas Instruments and NVE both excel in ROE and ROA, signaling strong profitability and asset efficiency. NVE boasts a more balanced debt-to-equity profile, scoring 4 versus Texas Instruments’ weak 1, indicating healthier leverage management. Texas Instruments relies heavily on operational efficiency but struggles with valuation metrics, showing very unfavorable P/B and moderate P/E scores. NVE edges ahead with a favorable overall score and better balance across valuation and leverage, making it the more well-rounded investment in this cycle.
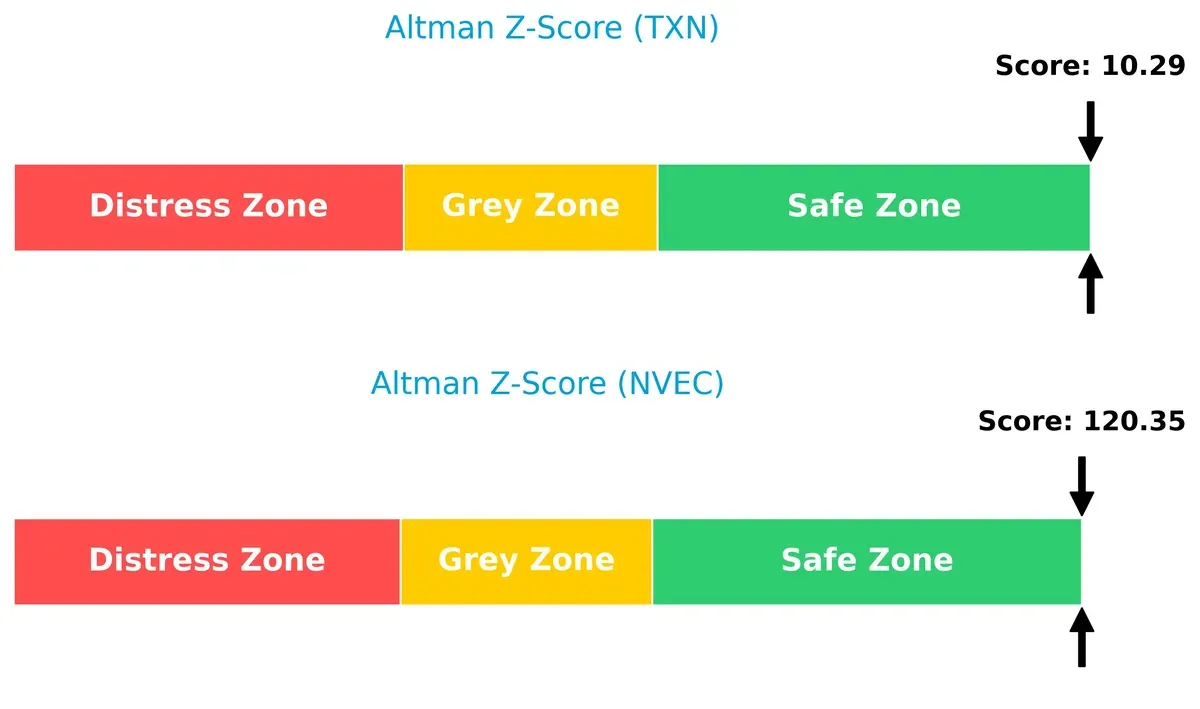
Bankruptcy Risk: Solvency Showdown
The Altman Z-Score delta strongly favors NVE, which scores an exceptional 120.35 compared to Texas Instruments’ 10.29. Both sit comfortably in the safe zone, but NVE’s astronomical figure signals near-zero bankruptcy risk, underscoring superior long-term stability in today’s challenging environment:
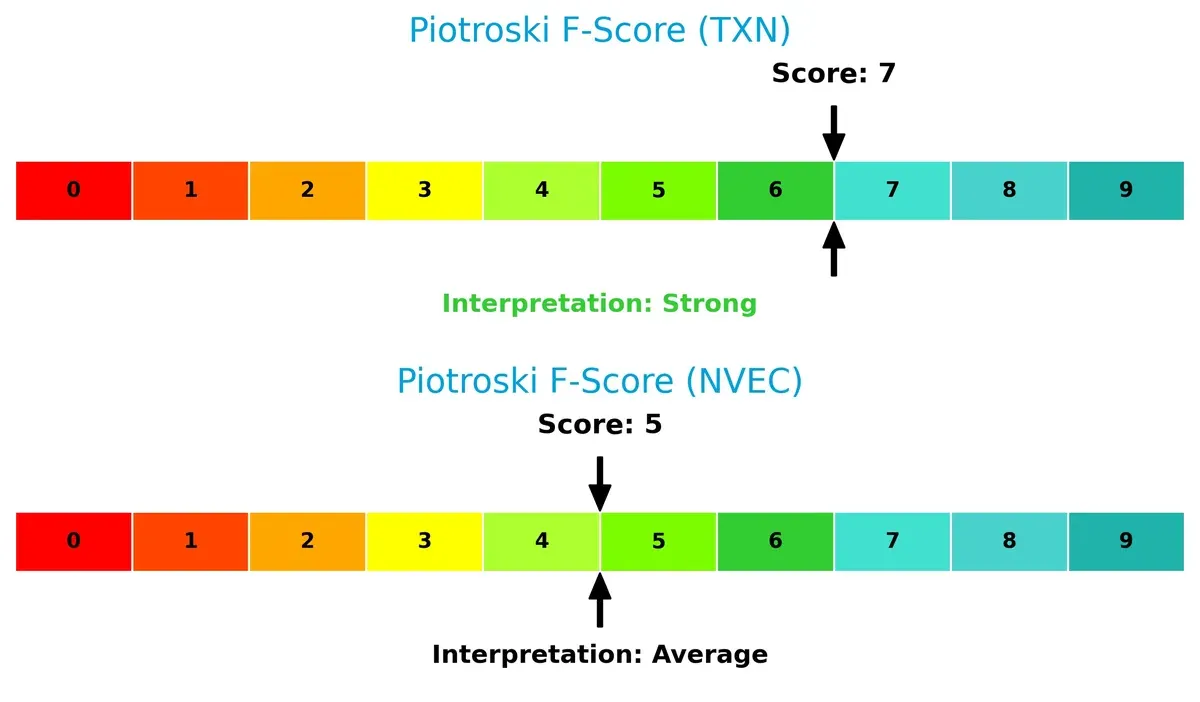
Financial Health: Quality of Operations
Texas Instruments leads with a Piotroski F-Score of 7, indicating strong financial health and operational quality. NVE’s score of 5 is average, suggesting some caution on internal metrics. Texas Instruments demonstrates fewer red flags, making it the more robust company from an internal financial quality perspective:
How are the two companies positioned?
This section dissects the operational DNA of TXN and NVEC by comparing their revenue distribution and internal dynamics. The goal is to confront their economic moats and identify which model offers the most resilient competitive advantage today.
Revenue Segmentation: The Strategic Mix
This visual comparison dissects how Texas Instruments and NVE Corporation diversify their income streams and where their primary sector bets lie:
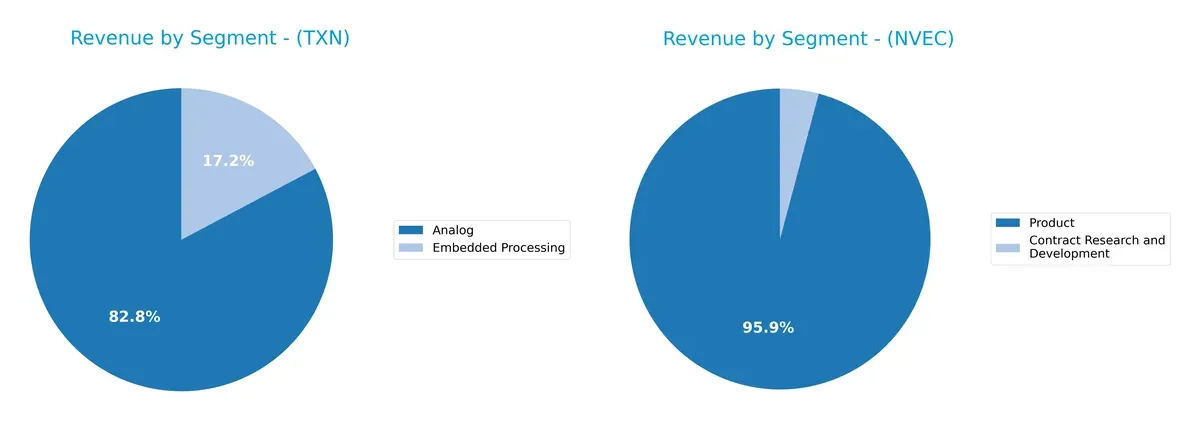
Texas Instruments anchors its revenue with a dominant Analog segment at $12.2B in 2024, supplemented by $2.5B from Embedded Processing. This mix shows moderate diversification but leans heavily on Analog’s ecosystem lock-in. NVE Corporation pivots on a concentrated Product segment near $26M, with minimal Contract Research and Development income. TI’s scale and segment breadth dwarf NVE’s focused approach, reducing concentration risk while NVE faces higher dependency on a single revenue stream.
Strengths and Weaknesses Comparison
This table compares the Strengths and Weaknesses of Texas Instruments Incorporated and NVE Corporation:
Texas Instruments Strengths
- Diverse revenue from Analog and Embedded Processing segments
- Strong global presence with significant sales in US, China, EMEA
- Favorable profitability ratios: 28.28% net margin, 30.73% ROE
- Solid quick ratio at 2.83 supports liquidity
- Consistent dividend yield at 3.17%
NVE Strengths
- High profitability with 58.22% net margin and 21.14% ROIC
- Extremely low debt levels with 0.01 debt-to-equity ratio
- Strong fixed asset turnover at 8.91 indicates efficient asset use
- Favorable interest coverage with infinite ratio
- Higher dividend yield potential at 6.28% (neutral status)
Texas Instruments Weaknesses
- High P/E of 31.53 and PB of 9.69 indicate possible overvaluation
- Unfavorable current ratio at 4.35 suggests unusual liquidity structure
- Moderate debt-to-assets at 40.62% could constrain flexibility
- Asset turnover at 0.51 is neutral but not optimal
NVE Weaknesses
- Unfavorable current ratio extremely high at 28.4, signaling potential balance sheet inefficiency
- Asset turnover at 0.4 is low, possibly limiting revenue generation from assets
- PB ratio at 4.95 is unfavorable, indicating valuation concerns
Texas Instruments shows a balanced mix of strengths in diversification and profitability but faces valuation and liquidity scrutiny. NVE excels in profitability and low leverage but contends with liquidity and asset utilization challenges. Both companies must manage their weaknesses carefully within their strategic frameworks.
The Moat Duel: Analyzing Competitive Defensibility
A structural moat is the only true shield protecting long-term profits from relentless competitive erosion. Let’s examine how these two players defend their turf:
Texas Instruments Incorporated: Durable Cost Advantage
Texas Instruments leverages a cost advantage rooted in scale and diversified analog semiconductor products. Its 35% EBIT margin signals efficiency, though declining ROIC warns of margin pressure. New industrial and automotive markets could deepen this moat if innovation accelerates in 2026.
NVE Corporation: Niche Intangible Asset Moat
NVE’s moat stems from proprietary spintronic technology, creating high barriers in specialized sensor markets. Its 62% EBIT margin and growing ROIC reflect strong value creation. Despite smaller scale, expanding industrial IoT adoption offers upside to fortify its unique positioning.
Moat Strength Face-off: Scale Cost Efficiency vs. Specialized Tech Leadership
NVE’s rising ROIC and rare technology underpin a deeper moat despite smaller size. Texas Instruments’ scale delivers strong profits but a declining ROIC signals vulnerability. NVE appears better equipped to defend and grow market share through innovation in 2026.
Which stock offers better returns?
Texas Instruments Incorporated’s stock surged 29.3% over the past year, showing accelerating gains and robust buyer dominance. NVE Corporation’s shares declined 20.8%, despite a modest recent recovery.
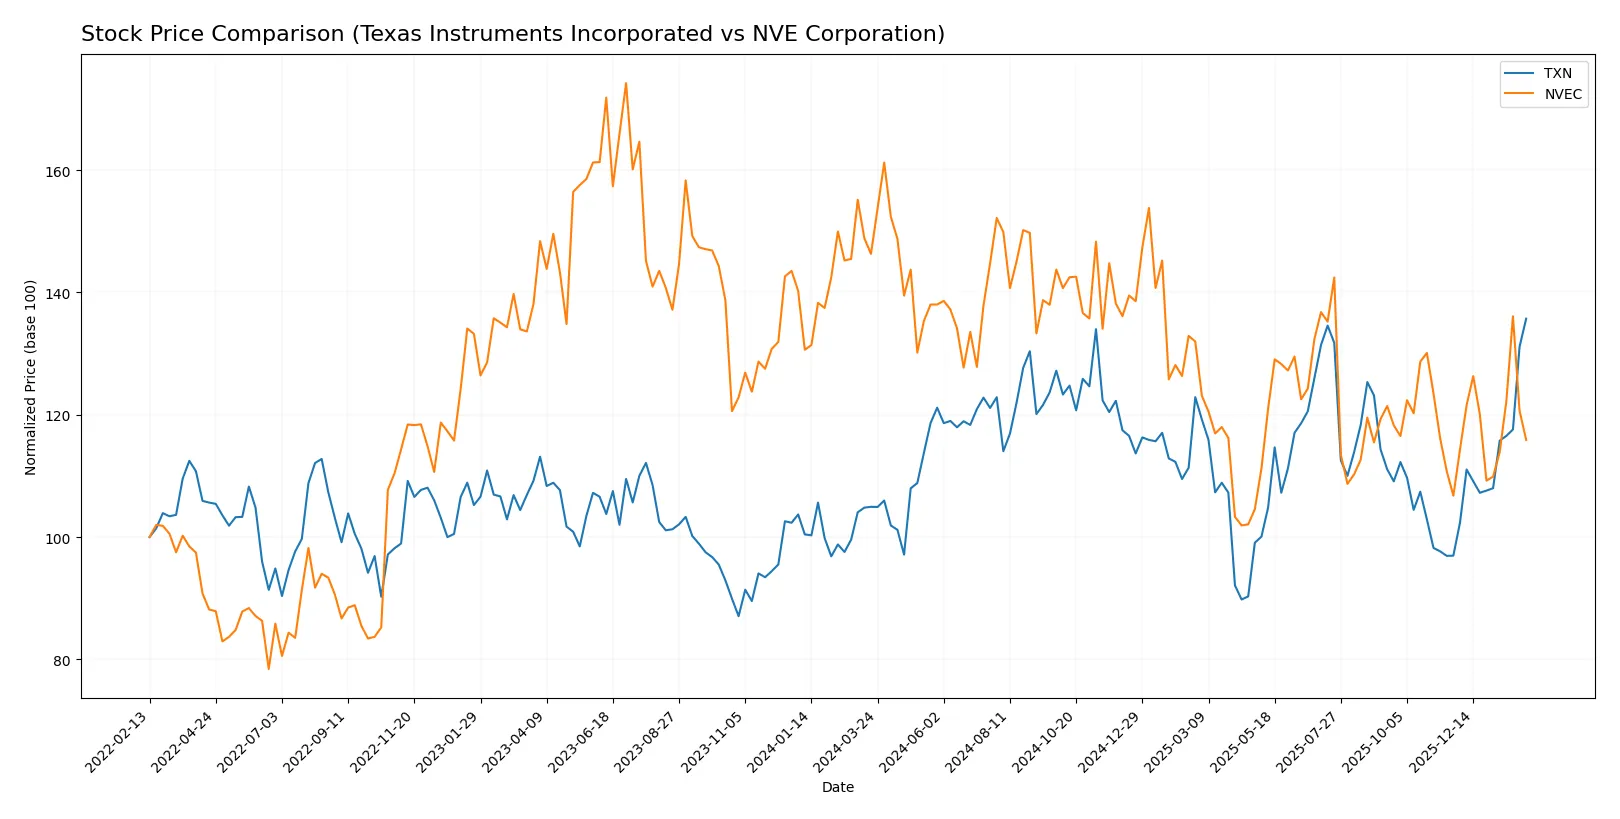
Trend Comparison
Texas Instruments posted a bullish 29.3% gain over 12 months with accelerating upward momentum and high volatility, peaking at 223.11 and bottoming at 147.6.
NVE Corporation’s stock fell 20.8% over the same period, marking a bearish trend with accelerating decline. Recent months show a slight 8.5% rebound with lower volatility.
Texas Instruments outperformed NVE Corporation, delivering the highest market return with sustained price acceleration and stronger volume dominance.
Target Prices
Analysts present a moderate target consensus for Texas Instruments Incorporated, reflecting cautious optimism.
| Company | Target Low | Target High | Consensus |
|---|---|---|---|
| Texas Instruments Incorporated | 160 | 260 | 204.64 |
The consensus target price of $204.64 sits below the current stock price of $223.47, suggesting limited upside or valuation concerns. No verified target price data is available for NVE Corporation.

Don’t Let Luck Decide Your Entry Point
Optimize your entry points with our advanced ProRealTime indicators. You’ll get efficient buy signals with precise price targets for maximum performance. Start outperforming now!
How do institutions grade them?
The following are the latest institutional grades for Texas Instruments Incorporated:
Texas Instruments Incorporated Grades
Here are the recent grades from recognized financial institutions for TXN:
| Grading Company | Action | New Grade | Date |
|---|---|---|---|
| Jefferies | maintain | Hold | 2026-01-28 |
| Cantor Fitzgerald | maintain | Neutral | 2026-01-28 |
| Goldman Sachs | maintain | Sell | 2026-01-28 |
| Truist Securities | maintain | Hold | 2026-01-28 |
| Deutsche Bank | maintain | Hold | 2026-01-28 |
| Stifel | maintain | Hold | 2026-01-28 |
| UBS | maintain | Buy | 2026-01-28 |
| B of A Securities | upgrade | Neutral | 2026-01-28 |
| Wells Fargo | maintain | Equal Weight | 2026-01-28 |
| JP Morgan | maintain | Overweight | 2026-01-28 |
Which company has the best grades?
Texas Instruments Incorporated has multiple institutional grades, mostly Hold or Neutral, with some Buy and Overweight ratings. NVE Corporation lacks institutional grades. Investors may view TXN’s diverse opinions as a balanced outlook reflecting cautious optimism.
Risks specific to each company
The following categories identify critical pressure points and systemic threats facing Texas Instruments Incorporated and NVE Corporation in the 2026 market environment:
1. Market & Competition
Texas Instruments Incorporated
- Dominates analog and embedded processing with large scale but faces intense semiconductor sector rivalry.
NVE Corporation
- Operates niche spintronics market with limited scale but benefits from specialized technology.
2. Capital Structure & Debt
Texas Instruments Incorporated
- Moderate debt-to-equity at 0.86 reflects balanced leverage but raises some financial risk.
NVE Corporation
- Extremely low debt-to-equity of 0.01 signals strong balance sheet and minimal financial risk.
3. Stock Volatility
Texas Instruments Incorporated
- Beta near 1 (0.995) suggests stock volatility aligns with market, providing relative stability.
NVE Corporation
- Higher beta (1.219) indicates above-market volatility, increasing investment risk.
4. Regulatory & Legal
Texas Instruments Incorporated
- Large multinational exposure may invite regulatory scrutiny across jurisdictions.
NVE Corporation
- Smaller scale reduces regulatory complexity but limits influence on policy.
5. Supply Chain & Operations
Texas Instruments Incorporated
- Extensive global supply chain risks include component shortages and geopolitical constraints.
NVE Corporation
- Smaller, specialized operations reduce complexity but increase dependency on limited suppliers.
6. ESG & Climate Transition
Texas Instruments Incorporated
- ESG pressures from large manufacturing footprint and energy consumption.
NVE Corporation
- Emerging technology focus may align better with clean tech trends, but data is limited.
7. Geopolitical Exposure
Texas Instruments Incorporated
- Global sales subject to trade tensions, especially US-China tech conflicts.
NVE Corporation
- Limited global footprint reduces geopolitical risk but also market reach.
Which company shows a better risk-adjusted profile?
Texas Instruments’ most impactful risk is its sizable debt level, which tempers its robust operating metrics. NVE’s principal risk comes from higher stock volatility and limited scale. Despite this, NVE’s very low leverage and strong Altman Z-Score indicate a cleaner financial risk profile. I see NVE as having a better risk-adjusted profile, supported by its minimal debt and favorable financial safety margin, compared to Texas Instruments’ moderate leverage and valuation concerns.
Final Verdict: Which stock to choose?
Texas Instruments’ superpower lies in its unmatched operational efficiency and robust capital returns. Despite its high valuation multiples and a current ratio that signals working capital management challenges, it consistently delivers value creation. This stock suits portfolios aiming for steady income and established industry leaders.
NVE Corporation stands out with a strategic moat of rapidly growing profitability and an exceptionally strong balance sheet. Its minimal debt and high free cash flow yield offer a safety cushion that Texas Instruments lacks. NVE fits well within portfolios focused on growth at a reasonable price with an appetite for emerging market leaders.
If you prioritize operational efficiency and proven value creation, Texas Instruments is the compelling choice due to its consistent profitability and income stability. However, if you seek growth backed by a fortress-like balance sheet and rising returns on capital, NVE offers better stability and upside potential despite recent price softness.
Disclaimer: Investment carries a risk of loss of initial capital. The past performance is not a reliable indicator of future results. Be sure to understand risks before making an investment decision.
Go Further
I encourage you to read the complete analyses of Texas Instruments Incorporated and NVE Corporation to enhance your investment decisions: